Principal Investigator

Christine Fleming

Imagen
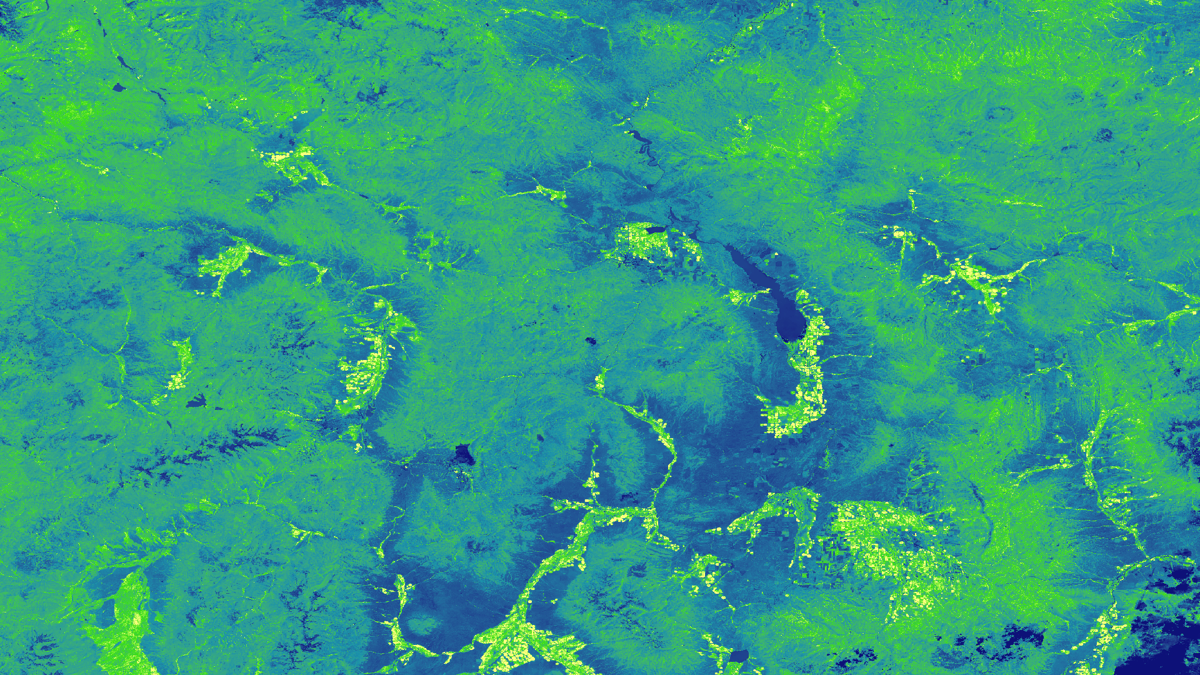
This is a processed image that shows the average of the Normalized Difference Water Index (NDWI) and the Modified NDWI (MNDWI) derived from June 1, 2017 Landsat 8 OLI data, with yellow and orange colors representing higher wetness relative to the dryer dark blue and green colors. The image shows the southern coast of Lake Ontario, centered on the city of Niagara Falls, New York, and indicates areas inundated by water.

Approximately 11 million people reside in the Lake Ontario watershed. Extreme high water levels in the spring of 2017 caused severe flood damage to communities off the coast of Lake Ontario. Niagara Falls drainage infrastructure did not accommodate floodwater inundation...

Principal Investigator

Henrik Westerkam

Imagen
Employing Remote Sensing Techniques to Quantify Sediment Supply and Evaluate Marsh Vulnerability in the Plum Island Estuary

The Plum Island Estuary (PIE) in Massachusetts is New England's largest salt marsh. This dynamic ecosystem plays an important role in the surrounding communities by providing ecosystem services and acting as a center for education, research, and recreation. However, marshes around the world are threatened...

Principal Investigator

Olivia Landry

Imagen
Displayed is a processed NDVI (Normalized Difference Vegetation Index) image using 2019 Landsat 8 Operational Land Imager red and near infrared bands. The Image shows agricultural zones in Polk County, Iowa. Darker green shades indicate dense healthy vegetation whereas lighter green shades indicate less dense or moderately healthy vegetation. Purple shades indicate water, and wetlands. NDVI values can be used as a proxy of a crop’s performance and help farmers monitor their crops' progress.  Keywords: Olivia Landry (Project Lead), Liam Bhajan, Otto Castillo Altun, Owen Smith, NDVI, Landsat 8 OLI

Farmers across Iowa, Minnesota, and Wisconsin have access to accurate and ample phenological data for large-grain crops like corn and soybeans. These data are useful metrics that describe changes during different stages of crop growth which help farmers evaluate crop...

Principal Investigator

Collin Pampalone

Imagen
Enhancements to Visualization of CALIPSO (VOCAL) through Case Studies of Saharan Dust

The Cloud-Aerosol LiDAR and Infrared Pathfinder Satellite Observation (CALIPSO) satellite's CALIOP sensor generates vertical LiDAR profiles of the atmosphere at a global scale. Currently, the standard visualization tool for these data is written in Interactive Data Language (IDL), a proprietary language that does not support...

Principal Investigator

Alina Schulz

Imagen
NDWI Composite from Landsat 8 tier 1 (2019) is shown with surface slope, derived from a statewide DEM of Maryland (2011), clipped to the border of Howard County, overlaid. The greater Baltimore area is shown; the merge of the Patapsco River and the Chesapeake Bay is seen lower right. Lighter shades of blue indicate higher surface and plant water content. In regards to the DEM, yellow shows a high degree of slope, while purple shows low slope. The convergence points of several watersheds along the Patapsco river (bright yellow border) can be identified, including the Tiber-Hudson watershed at Ellicott City. High NDWI values and steep slopes indicate areas in danger of flooding due to runoff.  Keywords: DEM, Landsat 8, NDWI, Ellicott City, watershed

As flooding events in the United States grow in frequency and intensity, the use of technological advancements and applied science are increasingly necessary for effective flood monitoring and warning systems. The NASA DEVELOP Ellicott City Disasters II project investigated the...

Principal Investigator

Danielle Ruffe

Imagen
Enhancing Coastal Management by Monitoring Hampton’s Coastline and Barrier Island Transgression with the Aid of NASA Earth Observations

Situated at the mouth of the Chesapeake Bay, Hampton, Virginia is one of the most vulnerable areas in the United States for environmental stressors such as flooding, sea level rise, and storm surge. The city is engaged in several initiatives and partnerships to aggregate geospatial...

Principal Investigator

Austin Counts

Imagen
Enhancing Pre- and Post-Wildfire Vegetation Type Characterization Using NASA Earth Observations

Increasing wildfire frequency has emphasized the importance of post-wildfire recovery efforts in southern Idaho's sagebrush-steppe ecosystem. The changing fire regime favors annual invasive grass species while hindering native grasses and sagebrush habitat regeneration, causing a positive feedback cycle of invasive plants. Due, in part, to...

Principal Investigator

Chloe Schneider

Imagen
Mean snow cover in March 2020 in the Missouri River Basin, derived from the Normalized Difference Snow Index (NDSI), is displayed. The NDSI is obtained from NASA Terra Moderate Resolution Imaging Spectroradiometer imagery. Lighter shades indicate the presence of snow and darker shades indicate absence of snow. Monthly snow cover is compared to historic conditions to assist in drought and flood predictions in the Missouri River Basin.  Keywords: NDSI, Terra, MODIS, snow cover

The Missouri River Basin is a major global breadbasket, containing large amounts of agricultural land. Recent devastating weather events have motivated regional organizations to dedicate efforts to drought and flood monitoring and early warning systems. The DEVELOP team partnered with...

Principal Investigator

Brooke Bartlett

Imagen
This image depicts a January through June 2019 Normalized Difference Vegetation Index (NDVI) map for the Burlington, Vermont, area derived from Landsat 8 Operational Land Imager (OLI) data. NDVI quantifies vegetation health by calculating the difference between two bands, near-infrared and red. The purple pixels in the image represent low NDVI values, indicating poor vegetation health, and the green pixels represent high NDVI values, indicating healthy vegetation.

syrup production has historically been at the heart of Vermont’s cultural and economic identity. In 2018, the state was the leading producer in the US, generating 46.6 percent of the country’s maple syrup. However, temperature fluctuations, drought, and variable defoliation...

Principal Investigator

Sydney Boogaard

Imagen
LST-processed imagery using April-October 2019 Landsat 8 TIRS data. The Salt River flows through the northern boundary of Tempe, Arizona. The ArcGIS Pro 2.6.2 Multipart Color Scheme is applied to display variation in LST. Shades of blue indicate low LST, such as the Salt River and golf courses in northwestern Tempe. Shades of yellow indicate medium LST and shades of red indicate high LST. The local municipality can identify areas for urban heat mitigation initiatives.   Keywords: LST, Tempe, Arizona, Anson Pang, Blake Steiner, John Dialesandro, Sydney Boogaard

Located in the northern Sonoran Desert, Tempe, Arizona, features a semi-arid climate with summer daily maximum temperatures regularly exceeding 37.8° C (100.0° F). The area has experienced an increase in surface and air temperatures due to a steep expansion of...