NASA

NASA
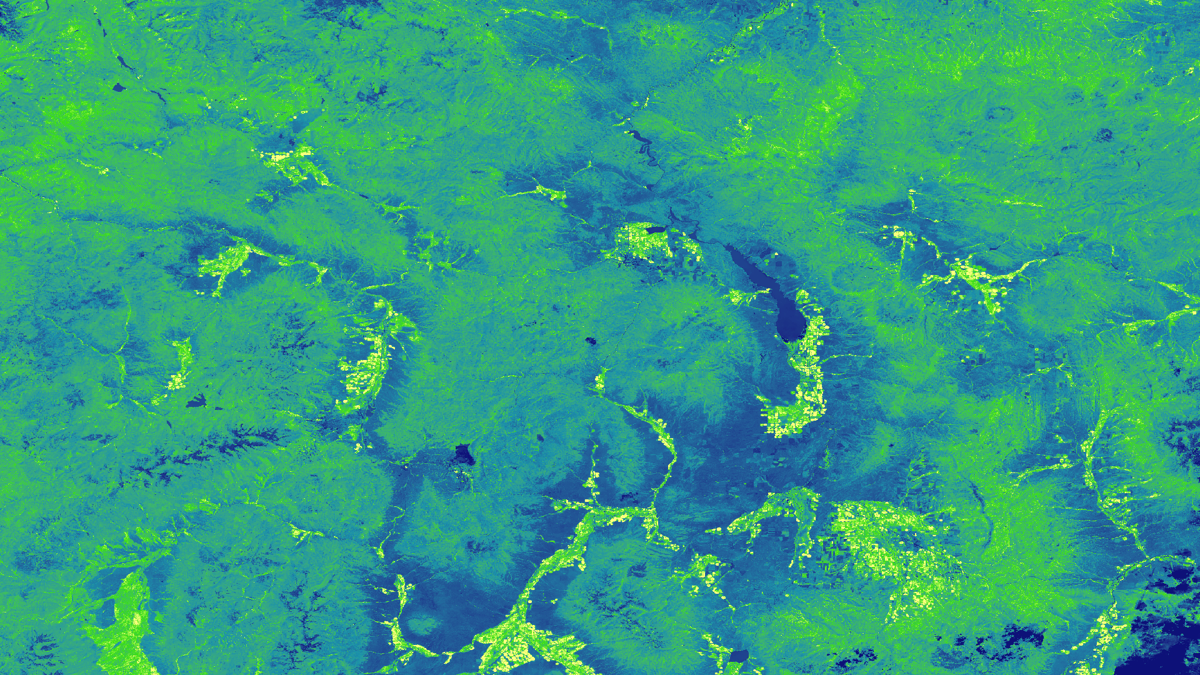
Tasseled cap greenness transformation derived from Landsat 8 imagery over lodgepole pine forest in the Intermountain West study area
Completed Projects
John Dialesandro
Exposure to heat exacerbated by an increase in urbanization as well as increasing global temperatures has become a growing concern for cities and their residents. Excess heat can cause increased heat-related morbidity, mortality, and energy costs. Vulnerability to heat-related illnesses...
Jillian Walechka
The City of Yonkers, New York, is located directly north of the Bronx in Westchester County and currently hosts a population of nearly 200,000. In response to increasing hot-weather episodes, the risk of heat-related illnesses and mortality is disproportionately affecting...
Cody O'Dale
Understanding water dynamics in southeast Idaho is critical to planning and improving water management practices. Partner organizations that focus on water resource management, such as the Bureau of Land Management (BLM) and Idaho Department of Water Resources (IDWR), currently use the National Hydrography Dataset...
Madeline Ruid
The hemlock woolly adelgid, Adelges tsugae (Annand), is an invasive species first identified on the East Coast of the United States in Richmond, Virginia in 1951. The pest has spread rapidly and has devastated eastern hemlock, Tsuga canadensis (L.) Carrière, populations from Georgia to...
Thinley Yidzin Wangden
Habitat loss of the endangered Asian elephants (Elephas maximus) accompanied by rapid urbanization has contributed to the rising Human-Elephant Conflict (HEC) crisis in southern Bhutan. This poses a serious threat to the survival of Asian elephants, a keystone...
Thinley Yidzin Wangden
The diverse landscapes of Bhutan host a rich biodiversity of animal and plant species. Asian elephants (Elephas maximus) are a flagship keystone wildlife species whose conservation is essential for the functioning of Bhutan’s forest ecosystems. Despite this, increasing habitat loss...
Emma Hatcher
The rapid expansion of purple loosestrife (Lythrum salicaria) and reed canarygrass (Phalaris arundinacea L.) into aquatic and wetland systems has reduced native plant abundance, decreased species diversity, and degraded wildlife habitats for birds and amphibians throughout North America. The expansion of these invasive species into...
Victor Lenske
Tidal wetlands, such as marshes, are among the Chesapeake Bay's most protective natural features. Not only do they provide vital ecological services such as breeding grounds and water purification, but wetlands also deliver direct benefits to coastal communities through water absorption, wave attenuation, and sediment...
Nara McCray
Toa Baja, located just west of San Juan in Puerto Rico, is known as “the underwater city” due to its propensity to flood. The city contains the mouth of the island’s longest river, Río de la Plata, which drains...
Andrew Shannon
In October 2015, the state of South Carolina experienced a recording-breaking precipitation event leading to detrimental flooding that caused 19 fatalities and over one billion dollars of damages, which has prompted researchers and resource managers to enhance their understanding of extreme precipitation. This project explored...