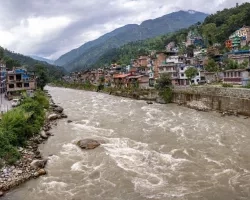
Examples of Ambae data products from the AIRS Rapid Response Website at JPL. This site, currently under development, contains data products generated automatically for AIRS granules, or scenes.
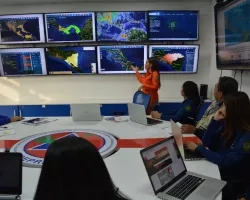
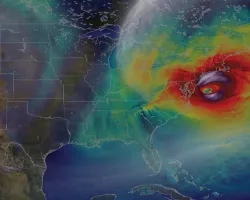
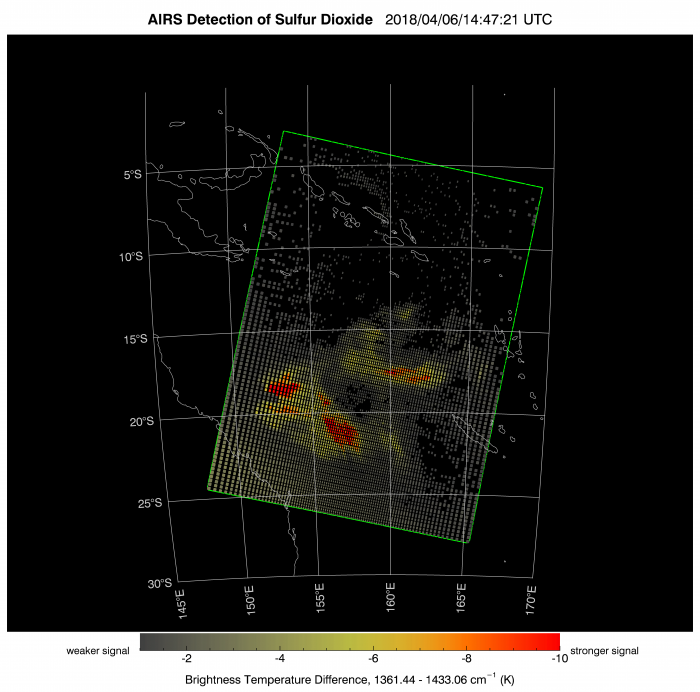
The AIRS Rapid Response products may be used to track the dispersion of SO2 (Image 1) and ash clouds (Image 2) following an explosive volcanic eruption. The cloud cover product (Image 3) is an aid to interpreting the SO2 and ash detection products. The cloud cover was dense, with a tropical cyclone developing off the coast of Australia. The apparent lack of ash, relative to the presence of SO2, suggests that much of the ash produced by the eruption was below the altitude of the cloud deck.
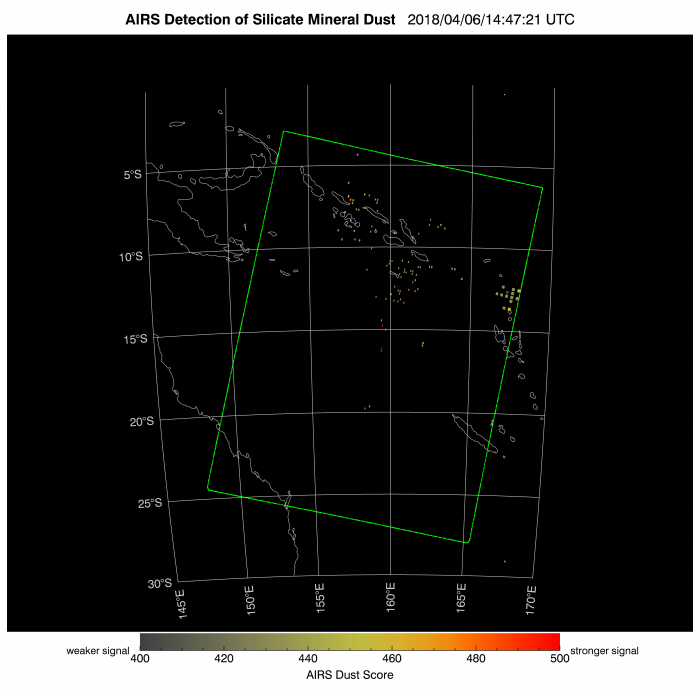

Data acquired by the Atmospheric Infrared Sounder (AIRS). AIRS provides daily global coverage through the combination of day and night-time observations.
Detection of SO2 and ash (silicate mineral dust) is based on the AIRS Near-Real Time (NRT) 'BT_diff_SO2' and 'Dust Score' products, which in turn are based on the AIR1BQAP_NRT product. The NRT products are generated at the Goddard Earth Science Data and Information Services Center (GES-DISC), and are available with 3 hours of the corresponding satellite observation.
The Plume Detection procedure, developed at JPL, is applied to every BT_diff and Dust Score product. The procedure identifies grid cells where the BT_Diff and Dust Score values exceed preset thresholds, counts the number of flagged cells, and evaluates the adjacency between flagged cells. The JPL map products are generated automatically for scenes containing sufficient contiguous detections, and are available within 4 hours of the corresponding satellite observation.