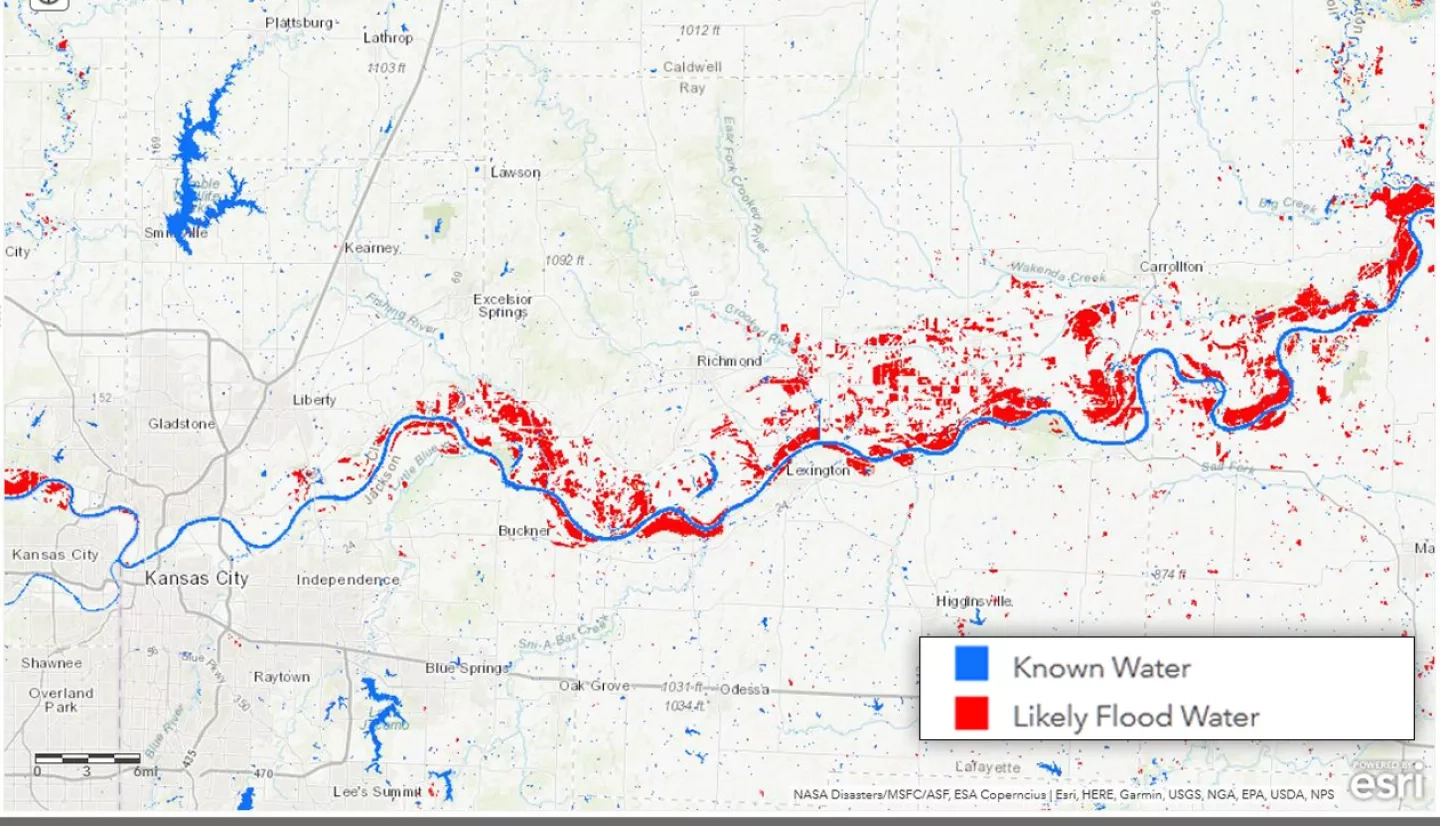
The NASA Disasters Program responded to a request from the USDA National Agricultural Statistics Service (NASS) to provide water extent maps for the regions affected by the recent flooding rainfall in the central U.S. Maps were generated using Sentinel 1A/B satellite overpasses of the central U.S. from 5/22/19 to 6/17/19 and were made available in GIS format on the NASA Disasters Mapping Portal. The USDA NASS is using these maps to identify croplands in the region that are likely to be impacted by the flooding. Flooding can reduce crop yields, which has impacts on both the local economy and the global food market.
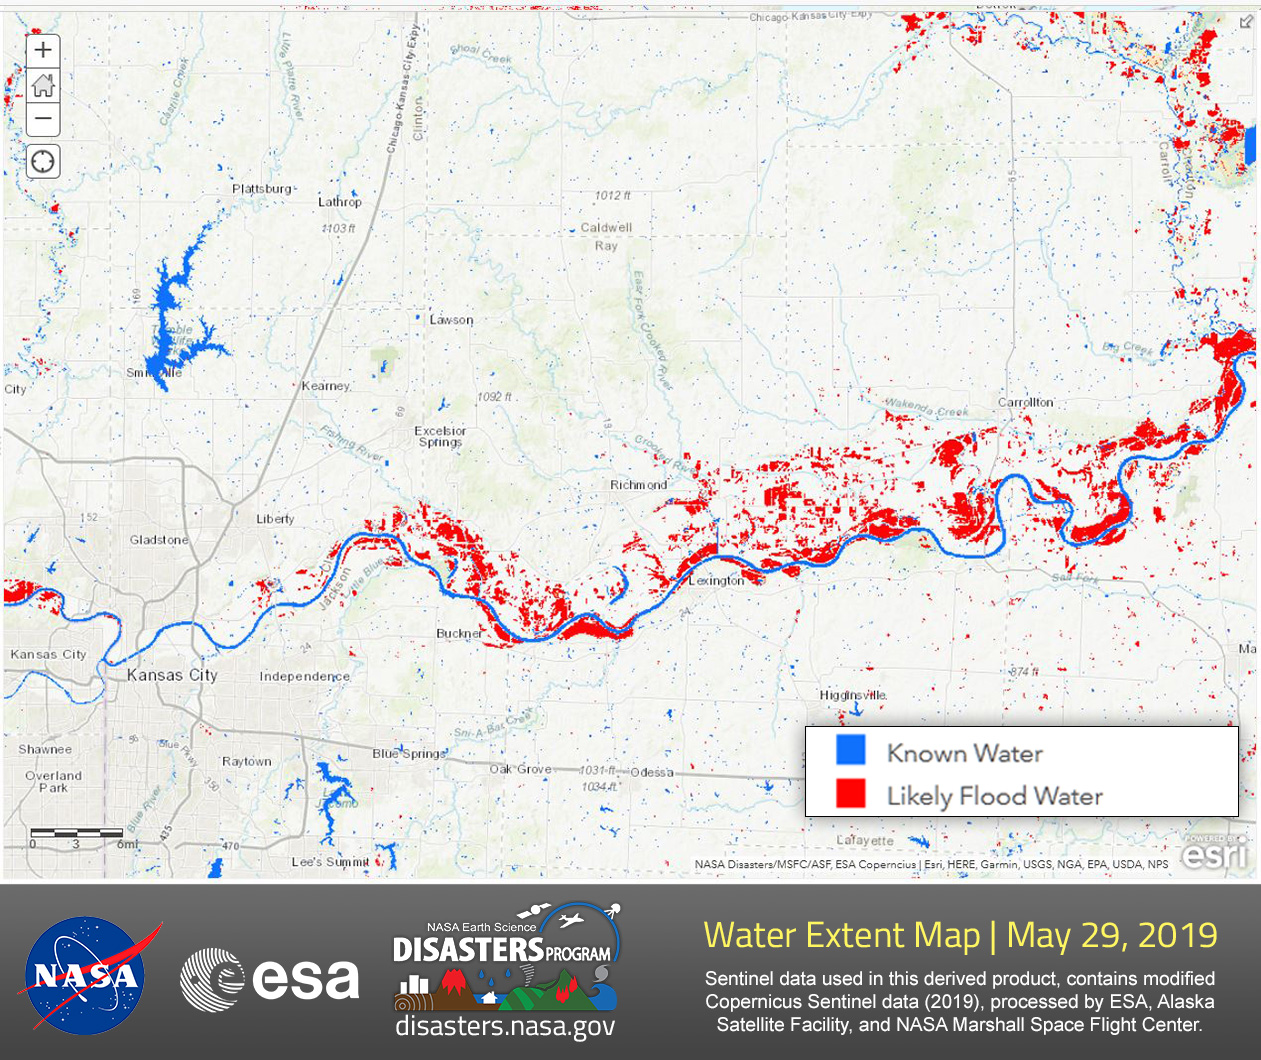
These water extent maps are generated using data from the European Space Agency's (ESA) Sentinel-1A/B satellites. This data is then processed first by the Alaska Satellite Facility’s DAAC and then by researchers at NASA’s Marshall Space Flight Center. The synthetic aperture radar (SAR) aboard Sentinel-1A/B allows for the detection of water on the surface even when clouds are present, as well as during the night time hours.