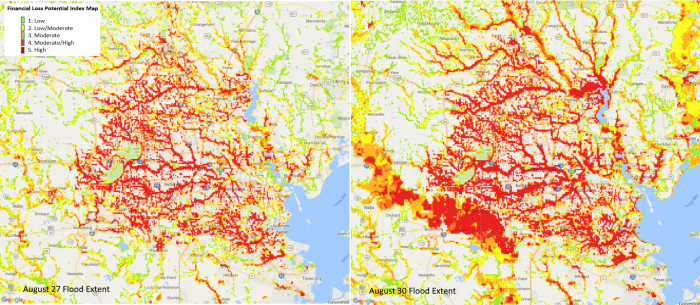
This Financial Loss Potential Index map combines extent of flooding and depth information and overlays it with exposed property values located in the flooded areas.
The Financial Loss Potential Index represents the concentration of high flood hazard and/or high value property locations at a grid level and can be used to validate loss estimates as well as review flood claims. The data is posted at 500m grid cells. The property exposure data is derived from years of research with support from NASA’s Applied Sciences program by integrating EO-data and information on property attributes as well as disaster forecasting and modeling parameters. The valuation data on US residential, commercial and industrial properties derived from NASA EO-data offer a key parameter for exposure quantification and is applicable for disaster response, relief as well as private insurance industry use.
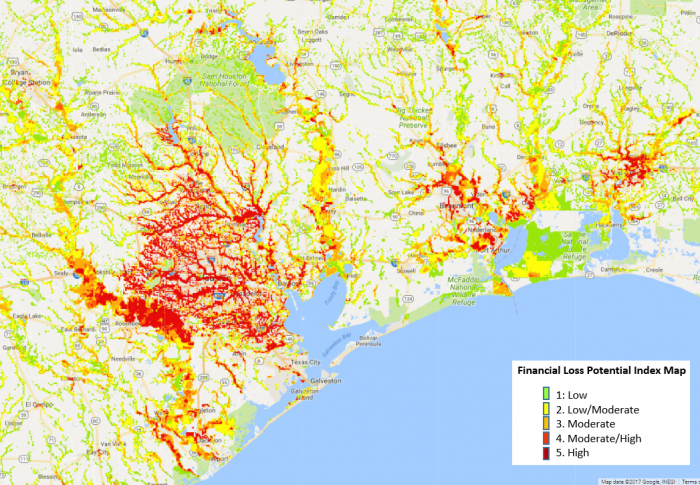
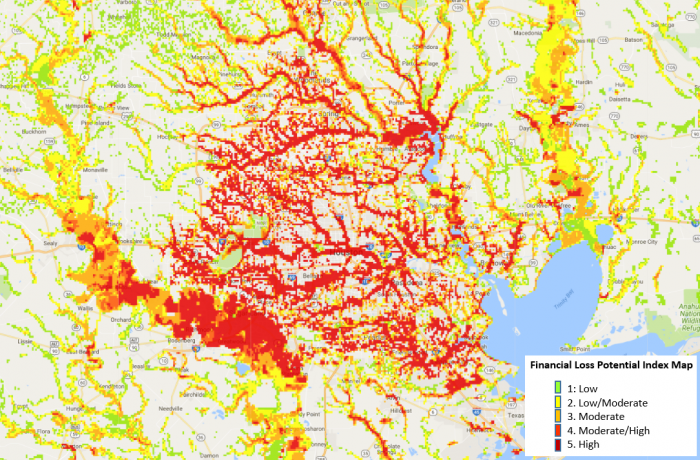
Data details – Exposure data layer used: ImageCat TEXAS exposure database version 1.0, ImageCat LOUISIANA exposure database version 1.0 and Flood depth data used - SSBN Harvey_2017_08_30.tif