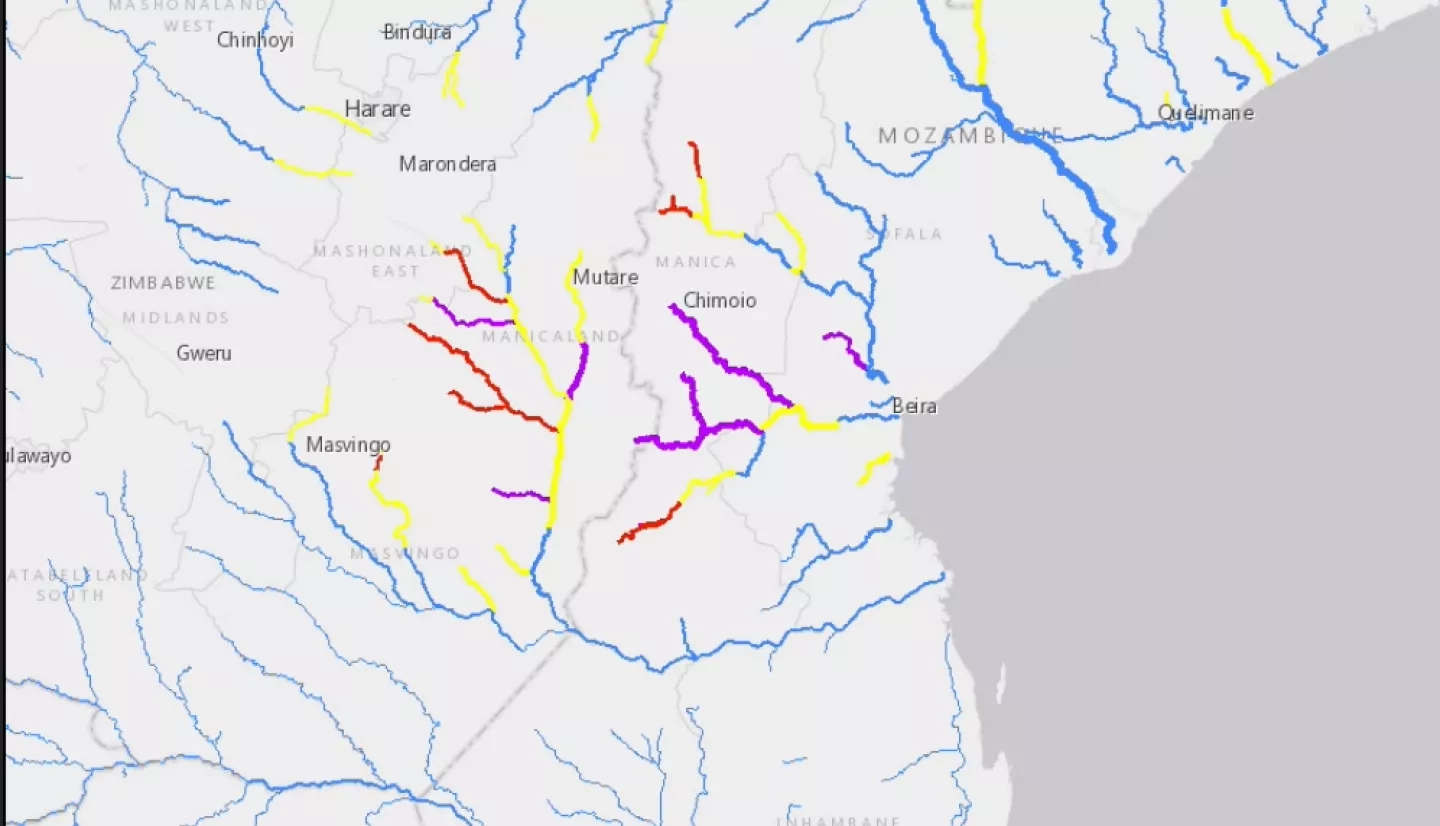
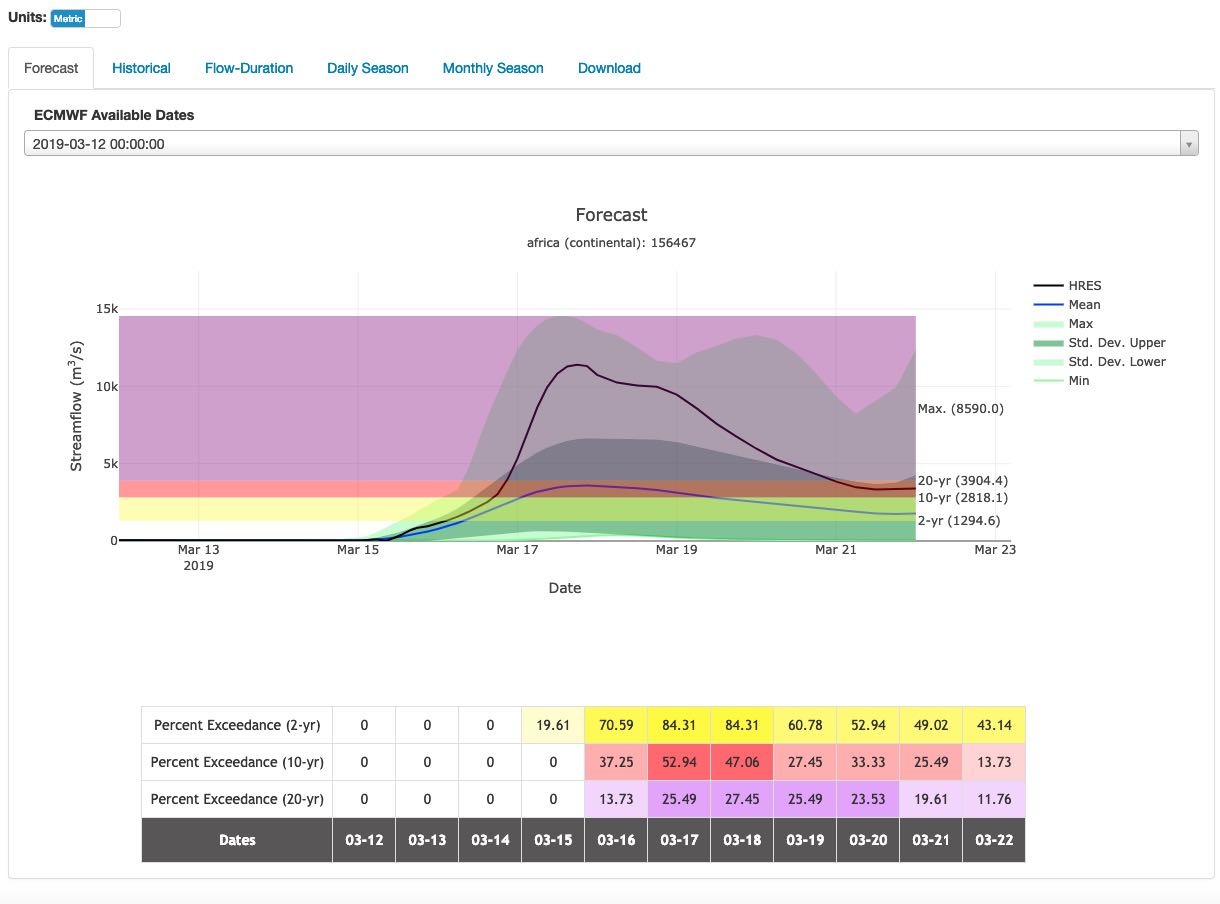
GEOGloWS Global Streamflow Forecasting derived from the European Center for Medium-range Forecasts (ECMWF) beginning March 12th that shows approximately a week in advance the forecasted storm. This is an ensemble forecast and you can see on the 16th the greater certainty and magnitude overall of the forecasted flood. This service also produces an animated sequence showing time/space of rivers with extreme flooding (greater than 2year - yellow, greater than 10year - red, greater than 20-year - purple) as compared to simulations done with the ERA-Interim 35-year reanalysis meteorology. It is not a flood map, but does show the timing of the flood in this case beginning on March 19th and going through March 23rd.
Download this video (right-click -> "Save As")
This is a forecasting service so the best application is having greater lead time in preparation for extreme flooding events. It can provide 10-15 days of lead time for an event, including the probability determined from the 51-member ensemble. Because it is a service it is possible to "consume" the forecast through an API for inclusion in other hydrodynamic models, reservoir operations, etc. (some downstream applications such as inundation/impact maps are being developed).
This service is still pre-operational however with support from the World Bank the team is working to transition to a more sustainable server by the end of 2019.