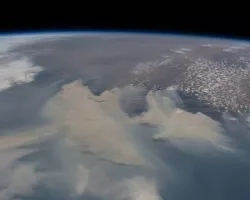
NASA researchers are using data from the Microwave Limb Sounder (MLS) instrument onboard the Aura satellite to track atmospheric carbon monoxide (CO) levels from the fires in Australia. Carbon monoxide is one the main trace gases emitted from fires and can be used to help track the path of smoke plumes. Carbon monoxide can also be used to track smoke which is injected directly to high altitudes from explosive fires.
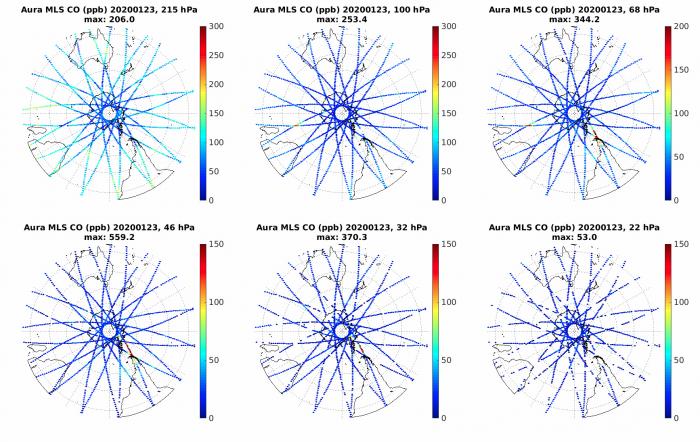
The above animation shows carbon monoxide (CO) levels in the region from December 25th, 2019 to January 20th, 2020. These concentrations were measured at an atmospheric pressure of 215 hectopascals (hPa), which is roughly 11km in altitude over southern Australia. Atmospheric pressures through the depth of the atmosphere, as measured in hPA’s, are used in meteorology as units of altitude.
Data from December 25th to December 29th show ‘normal’ background CO conditions, with higher CO between 150 parts per billion (ppb) and 200 ppb over the tropics from biomass burning in South America and Africa.
Much higher CO from the Australian bushfires first appears on December 30th over the Tasman Sea following a day of intense fire activity. On January 1st, CO concentrations of almost 1500 ppb were detected east of New Zealand, after which the plume is transported eastward over the southern Pacific. By January 4th, the plume spans an area of approximately 10 million km2 over the South Pacific. One segment of the plume stalls off the Chilean coast and ascends to the stratosphere, while another continues eastward. Traces of the plume can be seen to the south of Africa on January 9th and south of Australia on January 13th. At this point there is also ‘fresh’ CO over the central Pacific from a new plume that first appeared on January 6th.
High-altitude smoke plumes were discovered in the late 1990s. They occur periodically over Australia, North America and Russia, and can be monitored using MLS and other NASA satellite instruments. However the 2019 / 2020 Australian fires have had unprecedented consequences on stratospheric smoke loadings and heights which may trigger mid-to-long term impacts on atmospheric chemistry and climate. This is an active area of research
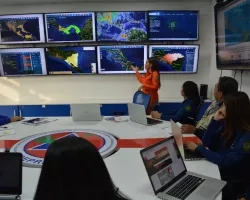
NASA is assisting the Australian Bureau of Meteorology (BOM) to improve air quality forecasts for the fires using Earth-observing data. The NASA Disasters Program is studying short and long-term impacts and risks from the fires associated with air quality, aviation, wildlife and ecosystems, and climate dynamics.