Published
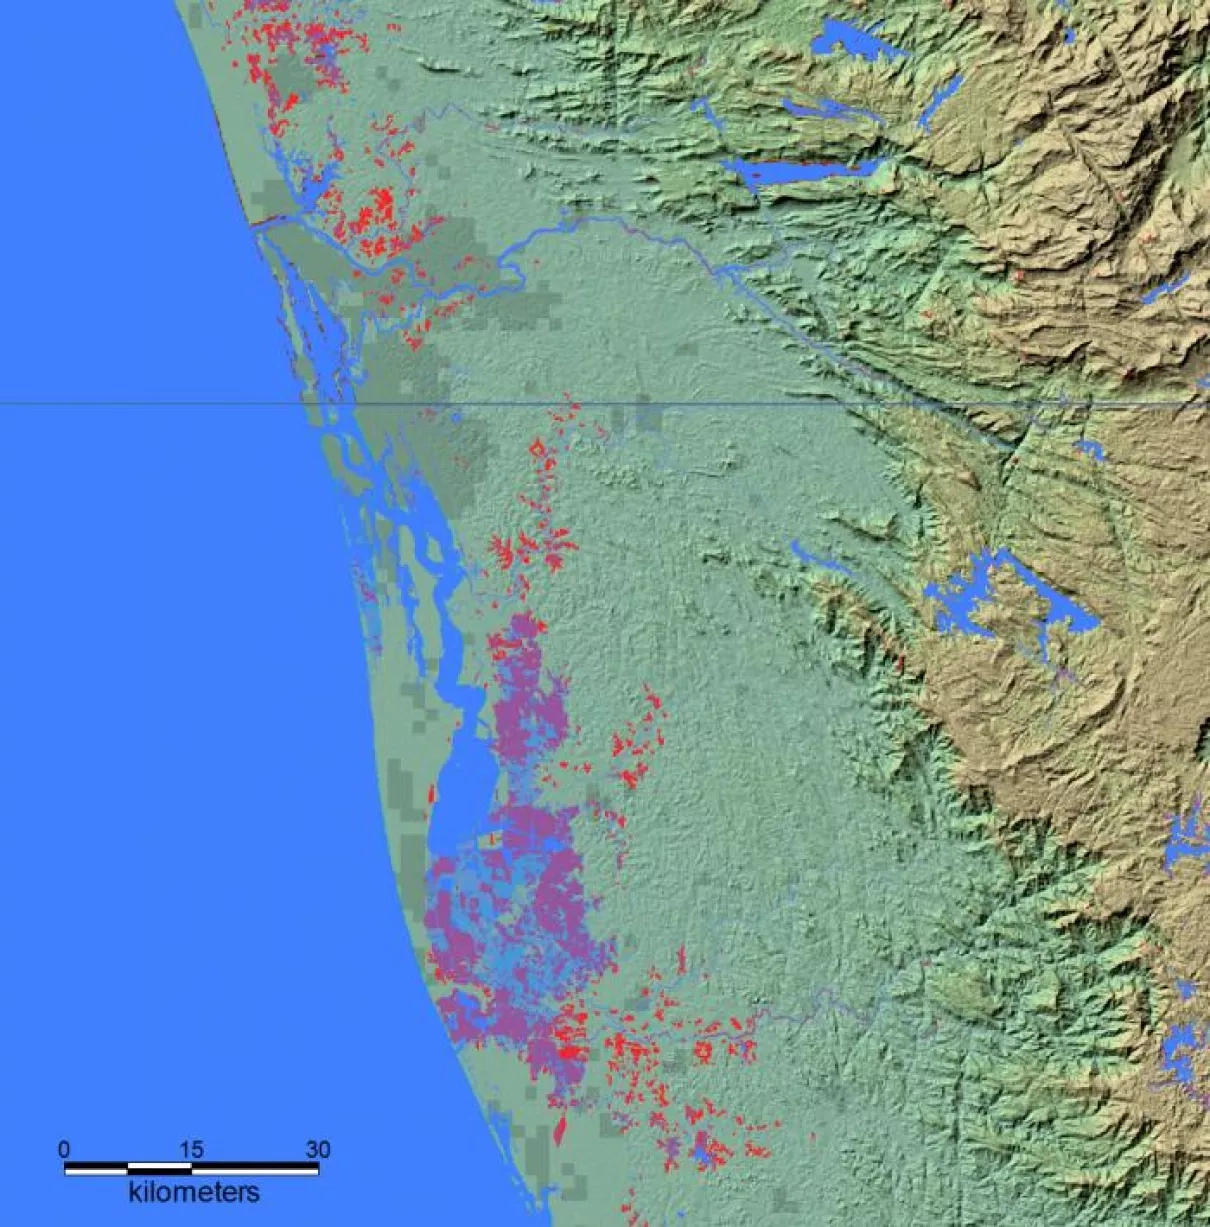
In the maximum observed flooding map, areas in RED are flooding mapped from Copernicus Sentinel 1 SAR data provided by the European Space Agency. Areas in PURPLE are currently flooded and also flooded in previous years. Areas in BLUE are covered by a reference normal water extent. Areas in LIGHT GRAY are all previously mapped flooding, since 1999.
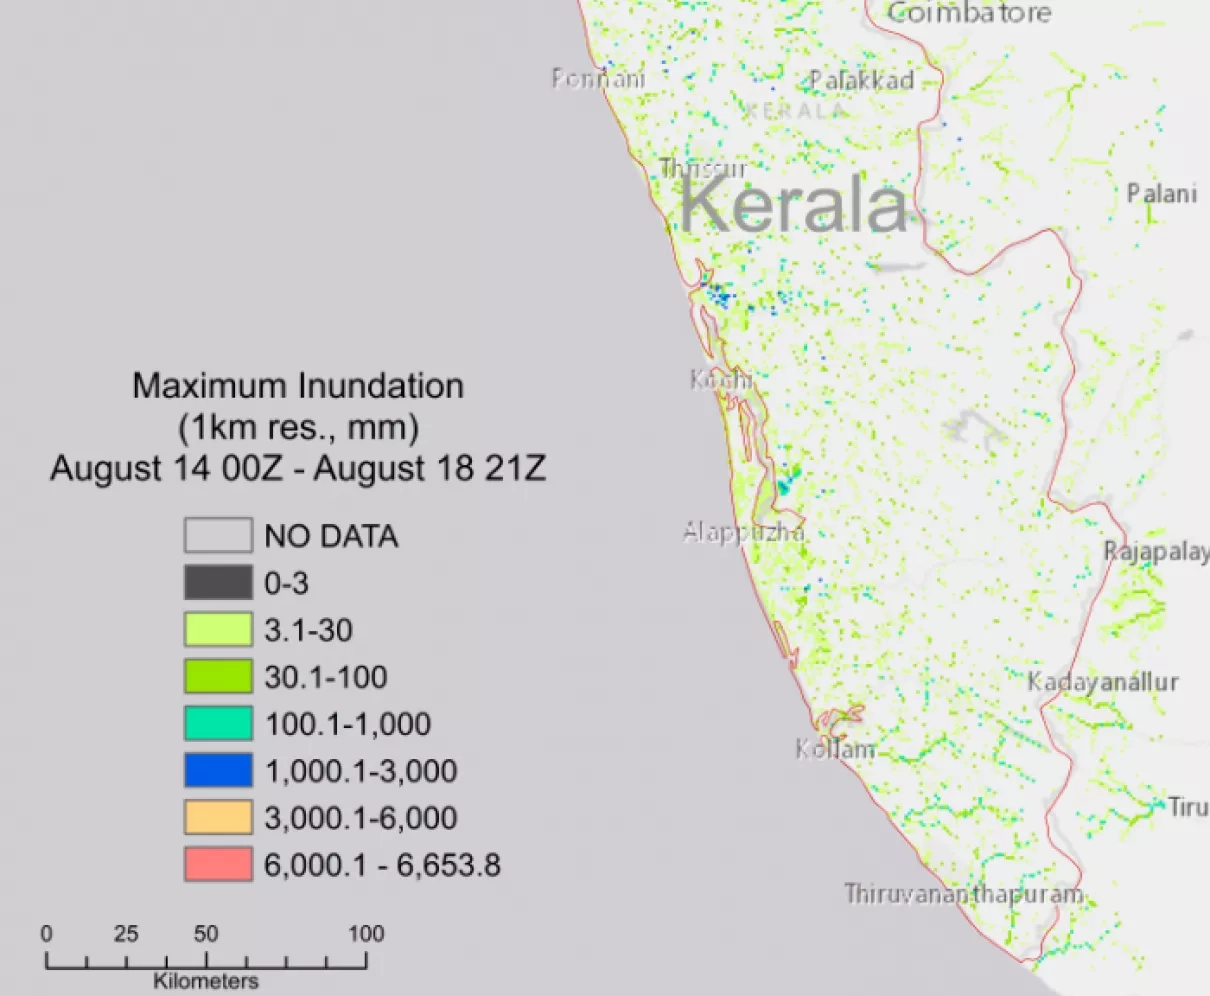
The observed and model-predicted flooding maps from SAR data can be used effectively for monitoring and analyzing the influence of flood water in a flood prone area. The flood product will help to reduce the flood hazard impact and provide critical information in the process of flood management.
915