Mid-June in Utah usually makes Dr. Jon Meyer smile. "It’s one of my favorite times of year because we get green for six weeks — and then we go back to brown for the rest of the year." June in Utah is the tail end of the most fertile time of year for crops. In a typical year, snowmelt in April and May wets the soil, resulting in a burst of blooming flowers and crop growth.
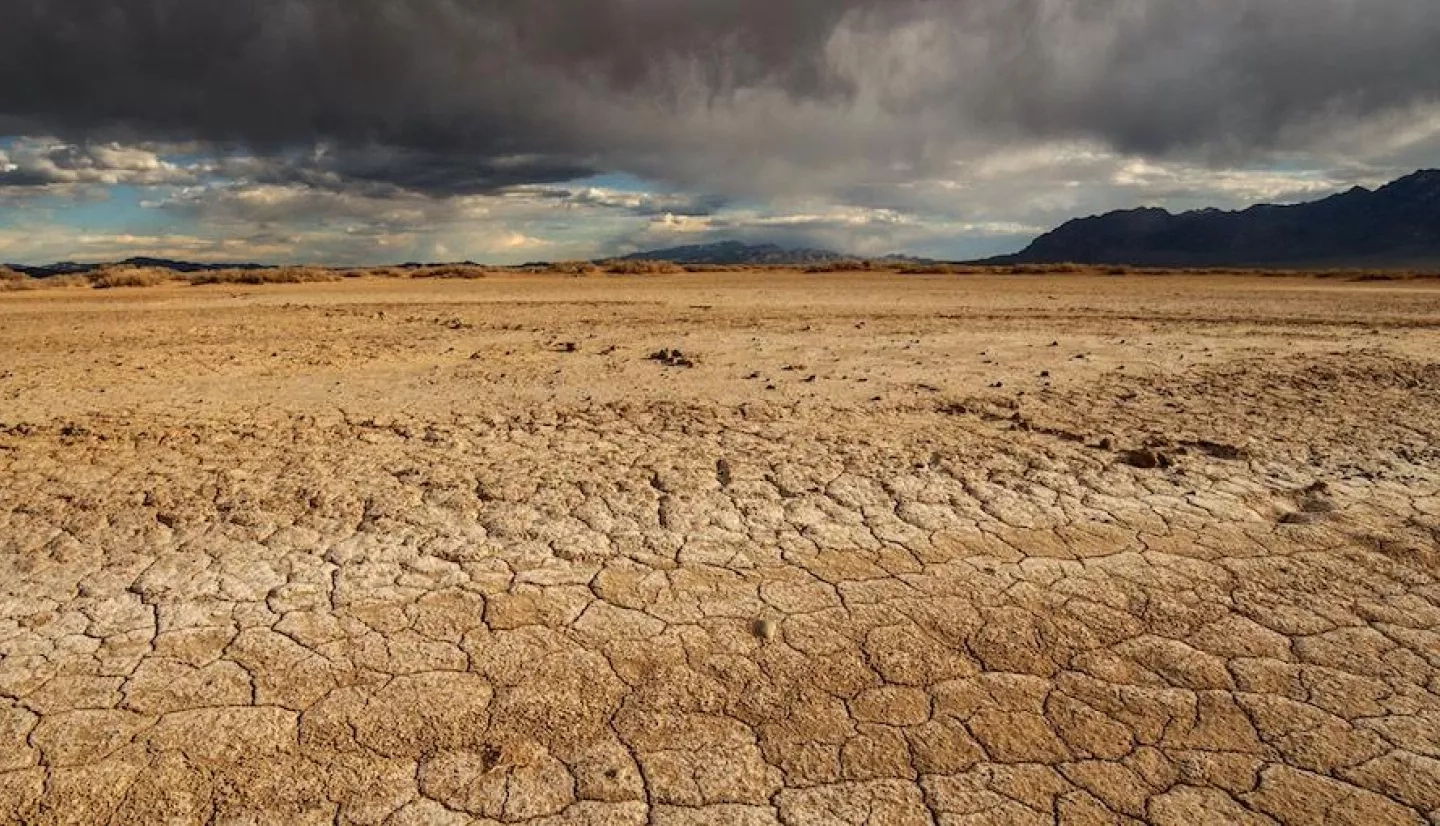
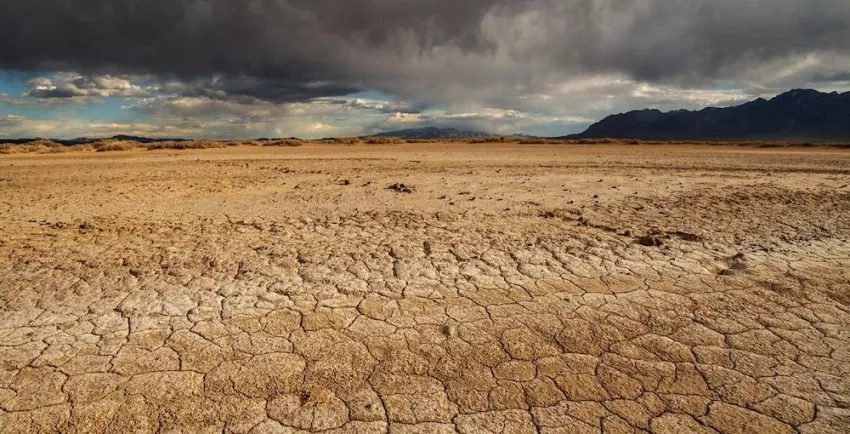
But in 2021 Meyer, a research climatologist with the Utah Climate Center, watched as drought gripped the American West. In Utah, more than 92 percent of the state met the criteria for “extreme drought,” fueled by what Dr. Meyer described as “a deadly combination of record heat and record dry.”
In a presentation on drought in the Southwest, Meyer showed a collection of grim indicators: high temperatures, little rainfall, low soil moisture, and finally, poor vegetative health. This last indicator has become an important metric for climate scientists and meteorologists trying to understand how weather and temperature impact the health of crops, and as an extension, food security, food prices and the global agricultural market.
In August, 2021, 216 million acres of crops in the U.S. experienced drought conditions and 76 million people are affected by drought, according to the National Integrated Drought Information System.
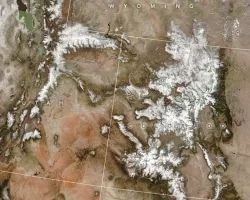
NASA and National Oceanic and Atmospheric Administration (NOAA) scientists have spent decades developing tools to help state and government officials plan for drought and food shortages. One of them is the Vegetation Health Index, or VHI. Using data from the JPSS program’s VIIRS instrument, first on the joint NASA-NOAA Suomi-NPP satellite and now on NOAA-20, the product shows crop health across the globe represented in color-coded maps. Green and blue indicate lush, healthy growth; red shows areas that are dry and sparse.
This last indicator has become an important metric for climate scientists and meteorologists trying to understand how weather and temperature impact the health of crops, and as an extension, food security, food prices and the global agricultural market.
Laura Haskell of the Utah Division of Water Resources coordinates the state of Utah’s official recommendation to the U.S. Drought Monitor map, which shows the drought status for each region of the United States, and plays an important role in decision-making involving agricultural reimbursements and other government assistance. Data from the Vegetation Health Index informs that recommendation, she said.
And it has a bigger role to play in what Eric Luebehusen, a meteorologist at the U.S. Department of Agriculture, calls “crop intelligence.” The USDA has a small but mighty team of meteorologists engaged in a major effort to develop estimates of crop production in more than 120 growing regions, covering 35 countries. They do this for major row crops, such as corn, wheat, sunflowers, soybeans, barley, cotton and rapeseed—and they rely on the VHI to help create these yield estimates.
The full version of this story can be found at NASA.gov at How Satellites Maps Help Prevent Another Great Grain Robbery.
NASA at Your Table is a series of articles, videos and other features highlighting how NASA data, satellites and other assets are in use to preserve the nation's agriculture.
This story is part of our Space for U.S. collection. To learn how NASA data are being used in your state, please visit nasa.gov/spaceforus.