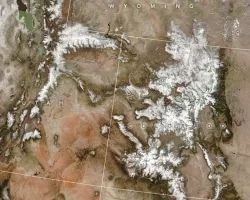
The Hudson River does not have a uniform width. It narrows and expands as it winds its way through New York. Satellite images can help researchers measure those distances.
Hydrologists have traditionally estimated river widths with topographic maps and measurements of river discharge. But the strength of the sediment, the presence of dams, and other factors can botch such estimates. And some riverbanks in North America are too remote for regular on-the-ground measurements.
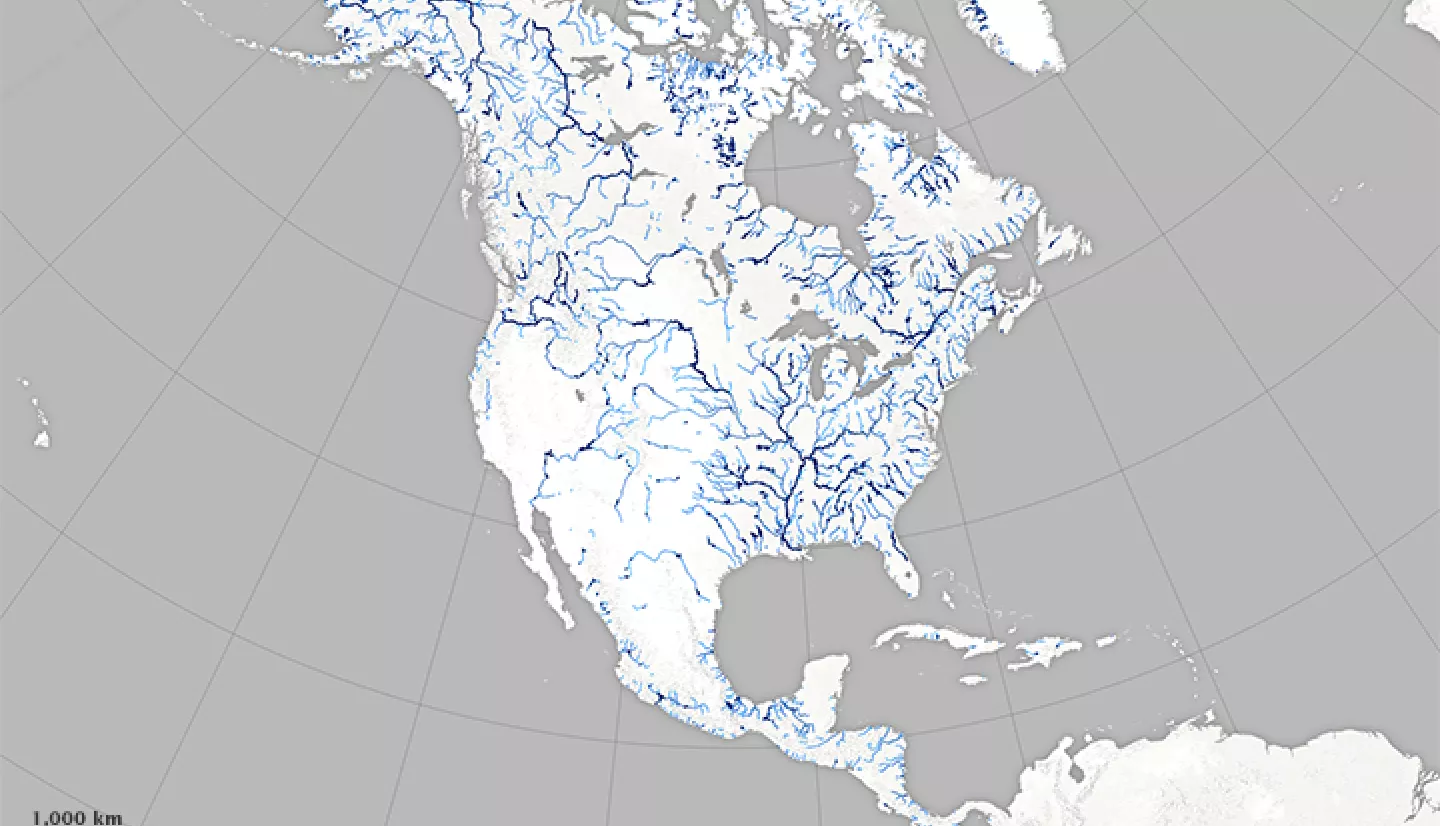
A team of hydrologists from the University of North Carolina sought a different approach. They mined a collection of 1,756 Landsat images with minimal cloud and ice cover. Then, they used a software program to locate the center line and edges of each river in the images. In their North American River Width Data Set, or NARWidth, the researchers mapped river widths for the whole continent.
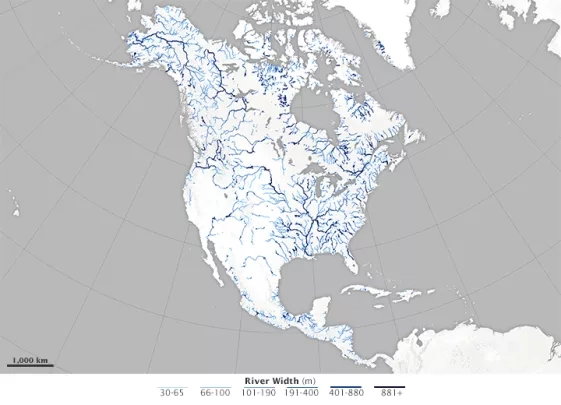
Such information can help scientists determine flood hazards or study ecological diversity. River widths can also help researchers who want to estimate the volume of greenhouse gases from freshwater sources.
The data may even help scientists interpret data from the Surface Water and Ocean Topography (SWOT) mission. That satellite is a collaboration between NASA and France’s space agency. It launched in December 2022 to map Earth's water with unprecedented detail.
More information available at the NASA Earth Observatory story A Satellite View of River Width.