Displaying 271 - 280 of 290
![Kernel density distributions of census tract-level cooling degree days from May through September 2013 in Fahrenheit by race/ethnicity across the climate regions of New York State. Cooling degree days are calculated with a threshold of 65°. White = Non-Hispanic White, Hispanic = Hispanic/Latino of any race, Black = Non-Hispanic Black, Asian = Non-Hispanic Asian.](/sites/default/files/styles/lis/public/2023-10/Carrion%20Project%20Page%20Image.png.webp?itok=yyxxauFg)
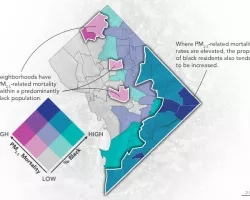
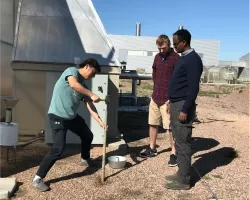
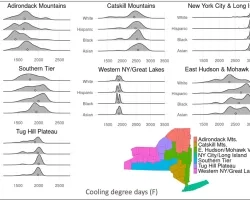
Identifying temperature disparities, energy insecurity, and social vulnerability for energy justice in New York State Team: Daniel Carrión (Yale School of Public Health), Anna Stouffer...
![Map showing southeast Los Angeles urban heat exposure around community locations identified by Research Leadership Academy participants.](/sites/default/files/styles/lis/public/2024-01/Douglas_EEJ.jpg.webp?itok=X2Hz9n30)
Topic
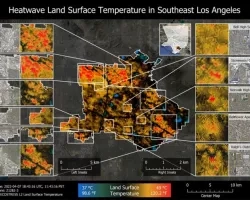
In partnership with Communities for a Better Environment, a community-based organization leading the advancement of zero-emission technologies and green infrastructure in environmental justice communities, our...
![Average aerosol optical depth (AOD) for the months of May and June in 2015 in Oregon and Washington, derived from MODIS data. Orange represents higher aerosol concentrations whereas purple represents areas with lower aerosol concentrations. The AOD averages show higher observed AOD along the coasts of Oregon and Washington.](/sites/default/files/styles/lis/public/2024-01/2023Sum_NC_PacificNorthWestHAQ_WebsiteImage.jpg.webp?itok=CKJ1vDx_)
Topic
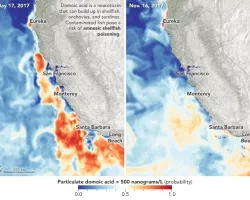
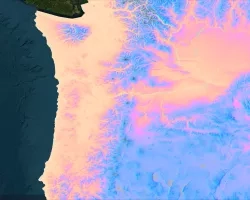
Pacific Northwest Health & Air Quality (Summer 2023) Team: Abby Sgan (Project Lead), Greta Bolinger, Tallis Monteiro, Cristina Villalobos-Heredia, Taylor West Summary: Recent studies have...
![2022 imagery of 95th percentile Aerosol Optical Depth (AOD) data from Terra/Aqua MODIS mapped against social vulnerability data from the EPA's EJScreen within the San Joaquin Valley's census tracts. Pink indicates higher levels of at-risk populations, and blue indicates higher levels of AOD. Darker shades of blue and purple indicate an overlap of high levels of air pollution and high at-risk population.](/sites/default/files/styles/lis/public/2024-01/2023Sum_VEJ_SanJoaquinValleyHAQ_WebsiteImage.png.webp?itok=RWE-BbSo)
Topic
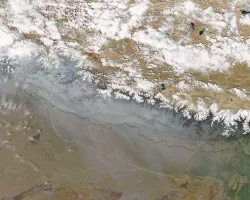
San Joaquin Valley Health & Air Quality (Summer 2023) Team: Jonathan Szeto (Project Lead), Jasper Beardslee, Piper Christian, Bethany MacCarter, Alma Quintero Summary: Little Manila...
Applied Sciences
Capacity Building
Health & Air Quality
Prizes & Challenges