Displaying 1 - 9 of 9
![2022 Spring AZ Phoenix Climate Website Image](/sites/default/files/styles/lis/public/2022-06/2022Spring_AZ_PhoenixClimate_WebsiteImage_v2.png.webp?itok=UX2zeyTY)
Topic
Phoenix Climate (Spring 2022) Team: Alison Bautista (Project Lead), Haley Stuckmeyer, Gloria Liu, Ben Schafermeyer Summary: Phoenix, Arizona is the hottest city in the United...
![Present day Island of Hawai'i coastal flood risk, with higher risk indicated in dark blue, was modeled to aid the County of Hawai'i in their shoreline setback plan. Sea Surface Temperature Anomaly (SSTA) data from 2022 GHRSST MODIS indicate low temperatures in the East (red) to high in the West (orange). Inland, high probability locations of wetlands are shown in bright yellow and will aid in climate adaptation planning. ](/sites/default/files/styles/lis/public/2022-11/2022Sum_AZ_HawaiiClimate_WebsiteImage_0.jpg.webp?itok=k16qFZYS)
Topic
Hawai'i Island Climate (Summer 2022) Team: Lisa Tanh (Project Lead), Ian Lee, Connor Racette, Matilda Anokye Summary: Climate-induced sea level rise poses a risk to...
![NDVI-processed imagery from Landsat 8 OLI data. This composite image of Wichita, KS, was created using 2018–2022 summer imagery. Lighter shades of yellow indicate limited vegetation in built-up areas and bodies of water, while darker shades of purple indicate dense vegetation. Understanding the spatial distribution of vegetation, such as tree canopy, is essential to recognizing and mitigating heat risk, and prioritizing intervention.](/sites/default/files/styles/lis/public/2022-11/2022Sum_VEJ_WichitaClimate_WebsiteImage.jpg.webp?itok=1WmU74Wp)
Topic
Wichita Climate (Summer 2022) Team: Brooke Laird (Project Lead), Melissa Ashbaugh, Muskaan Khemani, Sadie Murray Summary: Wichita, Kansas is facing a host of climate threats...
![Landsat 8 OLI data processed into the median NDVI for 2016-2021 with an overlay showing deforestation that occurred during this time period in the Talladega National Forest. The deforestation layer is derived from Global Forest Watch's forest cover data, which uses the Landsat series, and was calculated as the difference between forested areas in 2016 and forested areas in 2021. Shades of green indicate the density of forest, while red areas indicate areas deforested in 2021.](/sites/default/files/styles/lis/public/2023-02/2022Fall_PUP_SoutheastUSClimate_WebsiteImage.jpeg.webp?itok=9thA-LxI)
Topic
Southeast US Climate (Fall 2022) Team: Heidi Rogers (Project Lead), Mistaya Smith, Maggie Mason, Anish Holla Summary: Deforestation, a significant contributor to carbon emissions, is...
![Daytime land surface temperature for Wichita, Kansas summer 2017-2022, retrieved through Landsat 8 TIRS and Landsat 9 TIRS-2 surface temperature. Located in the northwest corner of the city, this image depicts higher temperatures through dark orange hues in developed areas, and lighter orange hues to blue colors where the temperature is lower. The land surface temperature was utilized to construct a heat vulnerability index for the city, looking into disproportionate impacts on underserved communities.](/sites/default/files/styles/lis/public/2023-02/2022Fall_VEJ_WichitaClimateII_WebsiteImage.png.webp?itok=oO4F6bs4)
Topic
Wichita Climate II (Fall 2022) Team: Ritisha Ghosh (Project Lead), Richard Kirschner, Ria Mukherjee, Raina Monaghan Summary: Wichita, Kansas is experiencing a host of climate...
![Map displaying Oklahoma City Heat Vulnerability Index in 2020.](/sites/default/files/styles/lis/public/2023-09/Cheng_2020.png.webp?itok=cV1JbpSh)
Topic
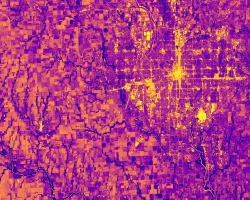
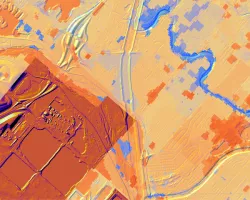
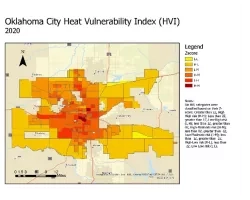
A spatial decision support system for identifying heat vulnerability based on a comprehensive energy budget model and multi-criteria decision analysis in Oklahoma City, OK Team...
DEVELOP
Wildland Fires
Climate
Capacity Building
Ecological Conservation
Health & Air Quality
Water Resources
![Kernel density distributions of census tract-level cooling degree days from May through September 2013 in Fahrenheit by race/ethnicity across the climate regions of New York State. Cooling degree days are calculated with a threshold of 65°. White = Non-Hispanic White, Hispanic = Hispanic/Latino of any race, Black = Non-Hispanic Black, Asian = Non-Hispanic Asian.](/sites/default/files/styles/lis/public/2023-10/Carrion%20Project%20Page%20Image.png.webp?itok=yyxxauFg)
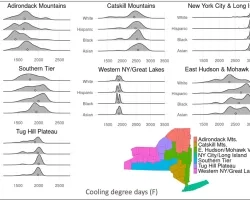
Identifying temperature disparities, energy insecurity, and social vulnerability for energy justice in New York State Team: Daniel Carrión (Yale School of Public Health), Anna Stouffer...
![This example map from Hang’s project indicates MODIS land surface temperature over selected underserved communities in Atlanta in early 2005. This map was co-designed by residents from those communities that are concerned about the seasonal change of extreme weather, air pollution, accessibility to green space such as parks and Atlanta BeltLine. (Credits: Ethan Li and Yun Hang, Emory University)](/sites/default/files/styles/lis/public/2024-04/Hang%20Project%20Page%20Image.png.webp?itok=7MiGgISi)
Team: Melanie Pearson (Emory University), Christine Ekenga (Emory University), Yang Liu (Emory University), Ethan Li (Emory University), Erin Lebow-Skelley (Emory University), Alina Merceron (Emory University)...