Displaying 1 - 7 of 7
![Aerial imagery in four tiles to show environmental conditions around prisons.](/sites/default/files/styles/lis/public/2023-09/Mothes%20Project%20Page%20Image.jpg.webp?itok=vHiSACCn)
Topic
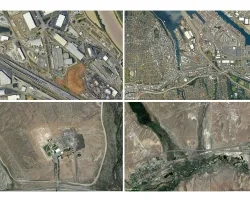
Leveraging Earth science data to heighten awareness of environmental injustices within the U.S. prison system Team: Dr. Carrie Chennault (Colorado State University; Prison Agriculture...
![Map displaying Oklahoma City Heat Vulnerability Index in 2020.](/sites/default/files/styles/lis/public/2023-09/Cheng_2020.png.webp?itok=cV1JbpSh)
Topic
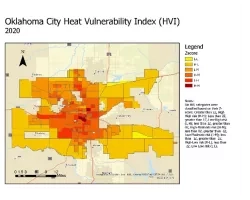
A spatial decision support system for identifying heat vulnerability based on a comprehensive energy budget model and multi-criteria decision analysis in Oklahoma City, OK Team...
DEVELOP
Wildland Fires
Climate
Capacity Building
Ecological Conservation
Health & Air Quality
Water Resources
![Kernel density distributions of census tract-level cooling degree days from May through September 2013 in Fahrenheit by race/ethnicity across the climate regions of New York State. Cooling degree days are calculated with a threshold of 65°. White = Non-Hispanic White, Hispanic = Hispanic/Latino of any race, Black = Non-Hispanic Black, Asian = Non-Hispanic Asian.](/sites/default/files/styles/lis/public/2023-10/Carrion%20Project%20Page%20Image.png.webp?itok=yyxxauFg)
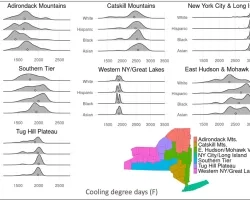
Identifying temperature disparities, energy insecurity, and social vulnerability for energy justice in New York State Team: Daniel Carrión (Yale School of Public Health), Anna Stouffer...
![Austin Multi-hazard Risk Index (flood + wildfire + heat + social vulnerability). The multi-hazard index previously computed utilized non-remote sensing, City-based data. An objective of the current project is to produce a similar index integrating remote sensing and socio-economic data. The current index shows there are clear spatial patterns with higher multi-hazard risk located in environmental justice communities in Austin.](/sites/default/files/styles/lis/public/2024-03/Climate%20hazard%20composite%20index.jpg.webp?itok=92aBbWp5)
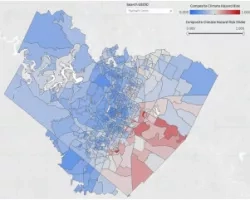
Team Members: Dev Niyogi (University of Texas at Austin), Carmen Llanes Pulido (Go Austin, Vamos Austin), Marc Coudert (City of Austin), Sergio Castellanos (University of...
![This example map from Hang’s project indicates MODIS land surface temperature over selected underserved communities in Atlanta in early 2005. This map was co-designed by residents from those communities that are concerned about the seasonal change of extreme weather, air pollution, accessibility to green space such as parks and Atlanta BeltLine. (Credits: Ethan Li and Yun Hang, Emory University)](/sites/default/files/styles/lis/public/2024-04/Hang%20Project%20Page%20Image.png.webp?itok=7MiGgISi)
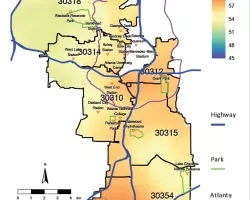
Team: Melanie Pearson (Emory University), Christine Ekenga (Emory University), Yang Liu (Emory University), Ethan Li (Emory University), Erin Lebow-Skelley (Emory University), Alina Merceron (Emory University)...
![Land surface temperatures for study area (Cuyahoga County, Ohio), as derived from Landsat. Black lines show boundaries of census blocks. Blue dots show the greenspaces and census blocks where the on the ground tree surveys have been conducted, with one census block highlighted as an inset. Image Credit: Rob Moore (Cleveland State).](/sites/default/files/styles/lis/public/2024-05/Mueller%20Project%20Page%20Image_0.png.webp?itok=nYl76fWk)
Topic
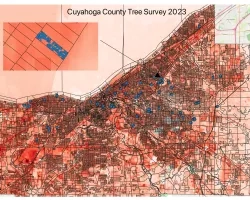
Team: Kevin Mueller (Cleveland State University), Brice Grunert (Cleveland State University), Thomas Hilde (Cleveland State University), Kaiguang Zhao (Ohio State University), Daniel Meaney (Cuyahoga County...