A joint project between the National Drought Mitigation Center (NDMC) and Center for Advanced Land Management Information Technologies (CALMIT) at the University of Nebraska-Lincoln, U.S. Geological Survey (USGS), U.S. Department of Agriculture (USDA) Agricultural Research Service (USDA ARS), and NASA Goddard Space Flight Center (GSFC) have developed an agricultural drought monitoring tool, called the Quick Drought Response Index (QuickDRI), which is tailored to detect short-term changes and rapid intensification of drought conditions through the integration of satellite, climate, and biophysical information. Project partners are now working to complete an operational QuickDRI tool that will characterize the intensification of short-term drought condition patterns on a weekly basis across the continental United States (CONUS) at a 1-km spatial resolution. The primary goal of QuickDRI is to serve as an “alarm” indicator of rapidly emerging events such as “flash drought”, which can manifest on the order of a few days to weeks, which are often difficult to detect using traditional drought indicators and can having devastating negative impacts on agriculture and natural resources. QuickDRI information is targeted to improve the spatial resolution and responsiveness of the U.S. Drought Monitor, which is used as a trigger by several federal and state drought assistance programs (e.g., USDA Range and Forage Program), as well as be integrated in the drought monitoring and planning activities of the National Integrated Drought Information System (NIDIS) regional drought early warning systems, state drought task forces, and other agricultural and natural resource drought management and response activities.
Geographic Focus
Continental United States
Application Readiness Level
ARL = 7 (Functionality Demonstrated)
The project has completed the testing and development of the national-level QuickDRI model and the operational QuickDRI production system hosted by USGS EROS. Results from this work demonstrated that QuickDRI detected early stage and rapid intensification of drought conditions across parts of the U.S. Corn Belt and Southern Great Plains regions during the severe 2011 and 2012 drought events, respectively. These results were evaluated by United States Drought Monitor (USDM) authors for representative time periods and locations during these two drought events that improved “flash” drought information was needed. This work demonstrated the utility of QuickDRI to provide early-stage drought emergence and intensification information that could be used to improve the responsiveness of the USDM during flash drought events. Since mid-summer 2016, near real-time, weekly QuickDRI maps have been produced over the CONUS using the operational production system and tested for integration into the USDM map development process with success. Feedback on map color scheme, value-added information products, and applications beyond the USDM are currently being collected from the USDM authors and other drought experts across the country. The feedback will be incorporated into the final, operational QuickDRI information that will be produced and delivered to the USDM authors and the general public starting at the beginning of the 2017 growing season.
Principal Investigator
Brian Wardlow, Center for Advanced Land Management Information Technologies (CALMIT)/University of Nebraska-Lincoln
Mark Svoboda, National Drought Mitigation Center/University of Nebraska-Lincoln
Project Team
Martha Anderson, USDA-ARS
Jesslyn Brown, USGS EROS
Michael Hayes and Tsegaye Tadesse, National Drought Mitigation Center/University of Nebraska-Lincoln
Matt Rodell, NASA GSFC
Collaborators & Stakeholders
U.S. Drought Monitor (USDM), USGS EROS, NASA Goddard Space Flight Center, USDA ARS, NASA GSFC, NOAA National Integrated Drought Information System (NIDIS)
Technical Overview
The rapid onset and intensification of drought conditions for events termed “flash” drought can have devastating negative impacts on the agricultural sector, natural resources, and the economy given the limited lead time to respond to and enact mitigation actions to minimize the impact. Monitoring is a key pillar in drought planning and mitigation activities that requires timely information on the location, severity, and duration of drought conditions. Many drought indicators exist for this purpose, but traditionally are developed for a specific application or only reflect the conditions of one component of a complex hydrologic cycle (e.g., soil moisture) that leads to the formation of drought. Given the complex nature of drought, the development of “composite” drought indicators that combine multiple indicators into a single drought indicator have been developed. The prime example is the U.S. Drought Monitor (USDM), which is considered the current state-of-the-art drought monitoring system for the United States and is used as a trigger for several federal and state drought assistance programs, as well as for monitoring activities in several state drought tasks forces and communicate drought information to the general public by the media. The USDM is developed from the analysis of an array of in situ, modeled, and remotely sensed data inputs and feedback from drought experts across the United States.
Despite being the state-of-the-art drought monitoring system, the USDM still has gaps in terms of high spatial resolution data inputs and short-term indicators of drought conditions that considered various components of the hydrologic cycle. Several remote sensing-based tools has been recently developed to begin to address that void including the Vegetation Drought Response Index (VegDRI) and Evaporative Stress Index (ESI), which provide useful information but are longer-term drought indicators or limited to one component of the hydrologic cycle, respectively. The VegDRI represents a seasonal, composite indicator of drought-related vegetation stress that integrates remote sensing, climate, and biophysical data that is being used by the USDM and other drought applications, but has too long of lag time to detect short-term, flash drought conditions. However, VegDRI provides the basis for an analytical, compositing framework that can be adapted to capitalize on several remotely sensed and in situ-based indicators sensitive to short-term conditions that can be integrated to detect early stage and rapid intensification in drought conditions.
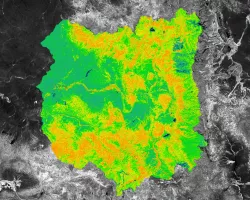
The project partners developed QuickDRI to address this information gap by integrating both remotely sensed and modeled data on vegetation health, evapotranspiration, and soil moisture along with a new climate-based drought indicator, the Standardized Precipitation Evapotranspiration Index (SPEI) that is based on precipitation and temperature observations and several biophysical environmental indicators (e.g., land use/land cover, soil type, and elevation) to characterize the short-term intensification of drought conditions on vegetation. All data inputs analyzed to produce the QuickDRI using data mining techniques represent conditions over the last month. QuickDRI results are provided in the form of 1-km spatial resolution maps over the CONUS depicting the level of intensification in drought conditions over the past month that are updated on a weekly basis. QuickDRI represents a drought “alarm” indicator of emerging or rapidly changing drought conditions that can be analyzed in combination with traditional, longer-term and/or application-specific drought indicators. QuickDRI will be provided to the USDM in near real-time for integration into the USDM map development process, as well as be distributed to the general public for other drought-related decision making activities.
Related Research Areas
Related Impact