Displaying 431 - 440 of 473
NASA DEVELOP 2024 Spring Proposed Project List
Topic
Resource Type
NASA DEVELOP Participant Recruiting Flyer
Topic
Resource Type
DEVELOP
Wildland Fires
Climate
Capacity Building
Ecological Conservation
Health & Air Quality
Water Resources
2024 Spring DEVELOP Tentative Project List
Topic
Resource Type
![This is a visualization of ECOSTRESS’ Evaporative Stress Index in Marin County, CA. The data is an average of summer months from 2018 – 2022. Scores closer to 0, or red/orange areas, indicate plants are in stress, meaning they are not meeting their potential evapotranspiration, while scores closer to 1, or blue areas, indicate plants are thriving and closer to reaching potential evapotranspiration.](/sites/default/files/styles/lis/public/2023-10/2023Sum_ARC_MarinCountyWildfiresII_WebsiteImage.jpg.webp?itok=pDMrUqyL)
Topic
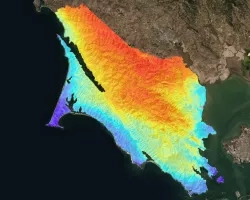
Marin County Wildland Fires II (2023 Summer) Team: Harrison Raine (Project Lead), Katherine Scott, Nikitha Shivakumar, Tiffany Mar, Anai Tene Summary: A future of increased...
![ACOLITE and NDVI processed imagery from Landsat 9 OLI-2 data. This composite image of the Coos Estuary and surrounding area was taken in September of 2022 after a period of increased precipitation. Shades of blue indicate vegetated land surface. The darker purple indicates higher turbidity while the lighter orange indicates lower turbidity.](/sites/default/files/styles/lis/public/2023-10/2023Sum_ARC_SouthSloughWaterResources_WebsiteImage.jpg.webp?itok=32Kahl4i)
Topic
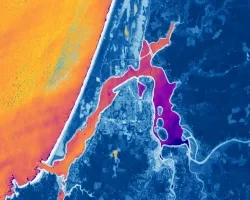
South Slough Water Resources (Summer 2023) Team: Maya Hall (Project Lead), Gabriel Halaweh, Sean McCollum, Zoë Siman-Tov Summary: The Coos estuary in Southern Oregon supports...
![Tasseled Cap Wetness calculated from Landsat 9 OLI-2 imagery from October 25, 2022. The Paria River, shown in dark blue, passes through the landscape. Shades of lighter blue indicate higher values of Tasseled Cap Wetness, with the gradient going towards dark purple and then bright pink for the lowest values of Tasseled Cap. Areas with higher Tasseled Cap Wetness values indicate moister environments, which can enable invasive species proliferation in riparian ecosystems.](/sites/default/files/styles/lis/public/2023-10/2023Sum_CO_PariaRiverEco_WebsiteImage.png.webp?itok=zqBudFvI)
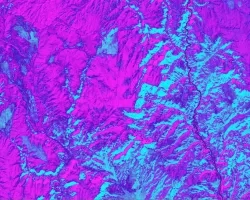
Paria River Ecological Conservation (Summer 2023) Team: Max VanArnam (Project Lead), Wesley Rancher, Truman Anarella, Annie Kowalski Summary: Invasive species within desert riparian environments significantly...
![Predicted cheatgrass green-up imagery from Landsat 8 OLI data. This composite image of the western portion of the Mullen Fire Study Area is from June 2022. Shades of green and yellow indicate an earlier green-up time, while orange, brown, and white areas show later predicted green-up times. This data was used to create NDVI difference maps which will help managers predict when and where to apply treatments to limit the spread of cheatgrass.](/sites/default/files/styles/lis/public/2023-10/2023Sum_CO_SouthernWyomingEcoII_WebsiteImage.jpg.webp?itok=Ht2hUpEj)
Southern Wyoming Ecological Conservation II (Summer 2023) Team: Bryan Graybill (Project Lead), Lillian Gordon, Estelle Lindrooth, Sarah Sathe Summary: Cheatgrass (Bromus tectorum) is an invasive...