Displaying 3371 - 3380 of 3650
![Normalized burn ratio calculated from Landsat 8 imagery both preceding and following the Bootleg Wildfire in the Beatty, Oregon area. The fire burned from July 6th to August 15th during the Summer of 2021 and its footprint shows varying levels of burn severity. Dark purple areas indicate highest severity, shades of red and orange indicate moderate severity, and yellow areas indicate low burn severity. Black areas depict unburned areas.](/sites/default/files/styles/lis/public/2023-02/2022Fall_NC_Gatlinburg%26BeattyWildfires_WebsiteImage.jpeg.webp?itok=_JPQMuhI)
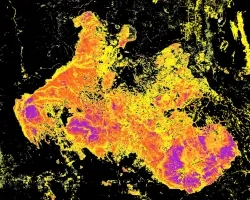
Gatlinburg & Beatty Wildfires (Fall 2022) Team: Kelli Roberts (Project Lead), William Hadley, Daniel Littleton Summary: Wildfire potential monitoring, which is increasingly vital under climate...
![Landsat 8 OLI data processed into the median NDVI for 2016-2021 with an overlay showing deforestation that occurred during this time period in the Talladega National Forest. The deforestation layer is derived from Global Forest Watch's forest cover data, which uses the Landsat series, and was calculated as the difference between forested areas in 2016 and forested areas in 2021. Shades of green indicate the density of forest, while red areas indicate areas deforested in 2021.](/sites/default/files/styles/lis/public/2023-02/2022Fall_PUP_SoutheastUSClimate_WebsiteImage.jpeg.webp?itok=9thA-LxI)
Topic
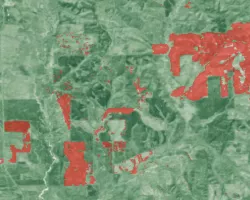
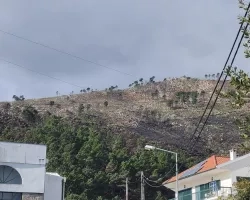
Southeast US Climate (Fall 2022) Team: Heidi Rogers (Project Lead), Mistaya Smith, Maggie Mason, Anish Holla Summary: Deforestation, a significant contributor to carbon emissions, is...
![This image of Land Surface Temperature (LST) illustrates the urban heat island (UHI) effect that Milwaukee County experiences. Light orange areas represent hotter temperatures, which are concentrated in the high impervious areas of the city. Darker pinks represent cooler rural areas and underscore the temperature contrast across the landscape. The hotter areas of the city are historically redlined communities of color that disproportionately feel the effects of the UHI, including higher energy bills heat re](/sites/default/files/styles/lis/public/2023-02/2022Fall_VEJ_MilwaukeeUrbanII_WebsiteImage.png.webp?itok=fmSKISME)
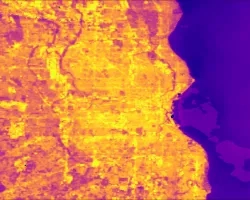
Milwaukee Urban Development II (Fall 2022) Team: Nash Keyes (Project Lead), caleigh McLaren, Nati Phan, Dalia Vazques Summary: Milwaukee’s neighborhoods experience increased social, health, and...
![Daytime land surface temperature for Wichita, Kansas summer 2017-2022, retrieved through Landsat 8 TIRS and Landsat 9 TIRS-2 surface temperature. Located in the northwest corner of the city, this image depicts higher temperatures through dark orange hues in developed areas, and lighter orange hues to blue colors where the temperature is lower. The land surface temperature was utilized to construct a heat vulnerability index for the city, looking into disproportionate impacts on underserved communities.](/sites/default/files/styles/lis/public/2023-02/2022Fall_VEJ_WichitaClimateII_WebsiteImage.png.webp?itok=oO4F6bs4)
Topic
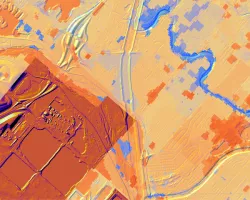
Wichita Climate II (Fall 2022) Team: Ritisha Ghosh (Project Lead), Richard Kirschner, Ria Mukherjee, Raina Monaghan Summary: Wichita, Kansas is experiencing a host of climate...
Topic
PI: Ashley Ballantyne, University of Montana Co-I: Marie Johnson, University of Montana Fire and other climate driven disturbances are shaping the future of our forests...
Topic
Mary Ellen Miller, Michigan Technological University Michael Billmire, Michigan Technological University Janice Coen, University Corporation For Atmospheric Research (UCAR) Wildfire is a known agent of...
Topic
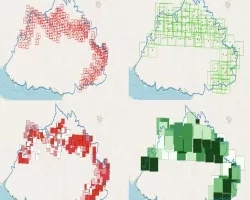
PI: Thomas Buchholz, Spatial Informatics Group Co-I: Max Moritz, Spatial Informatics Group Co-I: Graham Wesolowski, Spatial Informatics Group Natural Assets Laboratory Wildfire probability maps are...
Topic
PI: Pete Robichaud, U.S. Forest Service Co-I: Mariana Dobre. University of Idaho Co-I: Ian Floyd. U.S. Army Engineer Research and Development Center Co-I: Mary Miller...