Displaying 121 - 130 of 305
Podest, E.; McCartney, S.; Fielding, E.J.; Handwerger, A.L.; Grunfeld Brook, N.A. (2019).
![Annual max biomass calculated from 2021 daily Harmonized LandSat Sentinel-2 (HLS) dataset. Dark purple colors show low biomass while the bright orange show high biomass. Regions with high vegetation and tree canopy cover are shown in orange on the left of the image. High biomass values are of an interest to rangeland managers to help inform their grazing decisions based on which areas of the ranch produce the most biomass/vegetation.](/sites/default/files/styles/lis/public/2023-02/2022Fall_CO_EasternPlainsAgr_WebsiteImage.jpg.webp?itok=StO3rYYa)
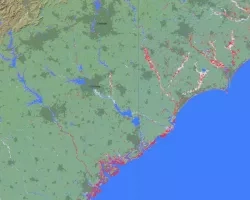
Eastern Plains Agriculture (Fall 2022) Team: Jillian Joubert, Sarah Hettema, Deni Ranguelova, TR Ingram, Max Stewart Summary: Adaptive management on cattle ranches requires rangeland managers...
![Median daily evapotranspiration (ET) from September 2021 to May 2022 calculated from ISS ECOSTRESS data. The image covers the agricultural fields adjacent to the Maipo River, Chile and depicts water stress. The color scale ranges from red (low ET) to blue (high ET), with higher ET observed over irrigated agricultural fields. ET is used for estimating crop irrigation requirements. This data will inform irrigation management practices and help alleviate water scarcity within the area. ](/sites/default/files/styles/lis/public/2022-11/2022Sum_PUP_MaipoRiverValleyAg_WebsiteImage.jpg.webp?itok=DiGPgMrj)
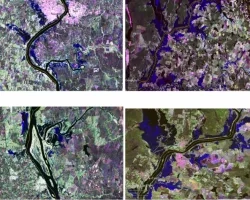
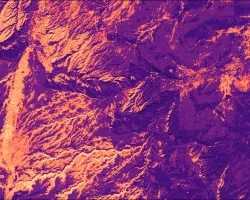
Maipo River Valley Agriculture (Summer 2022) Team: Benjamin Goffin (Project Lead), Duncan Srsic, Rishudh, Sarah Carlos Summary: Agriculture is the primary use of water in...
Learn how you can leverage our resources to help your community or organization, and how to partner with us for research, data sharing, training and more.
![Mt. Nyiragongo Lava Pool. Credits: Cai Tjeenk Willin (CC BY-SA 3.0)](/sites/default/files/styles/lis/public/2021-06/volcano-pool.jpg.webp?itok=IRc1gu9N)