Displaying 31 - 35 of 35
![ACOLITE and NDVI processed imagery from Landsat 9 OLI-2 data. This composite image of the Coos Estuary and surrounding area was taken in September of 2022 after a period of increased precipitation. Shades of blue indicate vegetated land surface. The darker purple indicates higher turbidity while the lighter orange indicates lower turbidity.](/sites/default/files/styles/lis/public/2023-10/2023Sum_ARC_SouthSloughWaterResources_WebsiteImage.jpg.webp?itok=32Kahl4i)
Topic
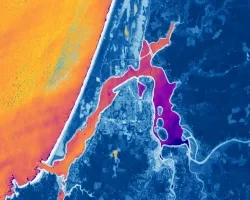
South Slough Water Resources (Summer 2023) Team: Maya Hall (Project Lead), Gabriel Halaweh, Sean McCollum, Zoë Siman-Tov Summary: The Coos estuary in Southern Oregon supports...
![Chlorophyll-a imagery from Aqua MODIS for March 2022 in the Gulf of Maine. Simulated PACE OCI data are derived from Aqua MODIS. Areas in red have a high chlorophyll-a concentration, meaning that the water is high in nutrients such as nitrogen and phosphorus, which cause algae to grow. Areas in blue have a low chlorophyll-a concentration, so the conditions are not present for harmful algal blooms.](/sites/default/files/styles/lis/public/2024-01/2023Sum_GSFC_PACEWater_WebsiteImage.jpg.webp?itok=_PCfcx9Q)
Topic
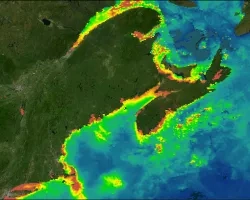
PACE Water Resources (Summer 2023) Team: Jules Kourelakos, Isabel Lubitz, Matt Romm, Grace Thorpe Summary: This project aimed to develop tools to support the future...
![NDVI-processed imagery from Landsat 8 OLI/TIRS data. This composite image of Washington, D.C., and the surrounding area representing max green values over the summer months of 2022. Blue shades in the image represent vegetated areas, while green and yellow shades represent water and areas with no vegetation. Plant cover has a major impact on water quality, making it crucial for the National Park Service to understand the state of vegetation in this region.](/sites/default/files/styles/lis/public/2024-01/2023Sum_GSFC_PotomacRiverBasinWater_WebsiteImage.png.webp?itok=6F3K9dyn)
Topic
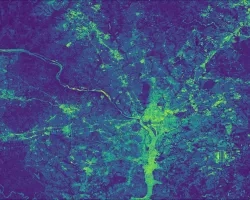
Potomac River Basin Water Resources (Summer 2023) Team: Zach Kinloch, Divina Lade, Xavier García López, Haydee Portillo Summary: The Potomac River Basin (PRB) is responsible...
![Lake Anna NDCI calculated using Sentinel-2 MSI images overlaying surface temperature imagery processed from Landsat 8 OLI data from May to September of 2021. Surface temperature is represented by shades of blue and green. Within the body of the lake, chlorophyll concentrations are represented on a gradient scale from purple to yellow, with yellow indicating highest concentrations. Higher temperatures can increase chlorophyll concentrations and are therefore of interest for Harmful Algal Blooms in Lake Anna.](/sites/default/files/styles/lis/public/2024-01/2023Sum_LaRC_LakeAnnaWater_WebsiteImage_v3.jpg.webp?itok=yv0lTk6B)
Topic
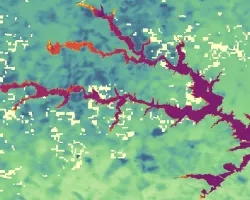
Lake Anna Water Resources (Summer 2023) Team: Olivia Etherton (Project Lead), Caroline Bahun, Alexander Krest, Justin Wilder Summary: Lake Anna is a man-made reservoir and...
![Normalized difference vegetation index (NDVI) calculated from Landsat 8 OLI showing land and aquatic vegetation around the Kankakee River in northeast Illinois on June 9, 2022. For land, dark blue represents high vegetation while light blue represents low vegetation. For water, light orange represents lack of aquatic vegetation, while purple represents the presence of aquatic vegetation. The image shows where along the Kankakee River aquatic vegetation exists.](/sites/default/files/styles/lis/public/2024-01/2023Sum_PUP_KankakeeWater_WebsiteImage.png.webp?itok=9byn7Wpt)
Topic
Kankakee Water Resources (Summer 2023) Team: Marisa Smedsrud (Project Lead); Hayden Hoffmeister; Oluwatosin Orimolade; Barira Rashid Summary: In recent years, unpredictable grassing events have occurred...