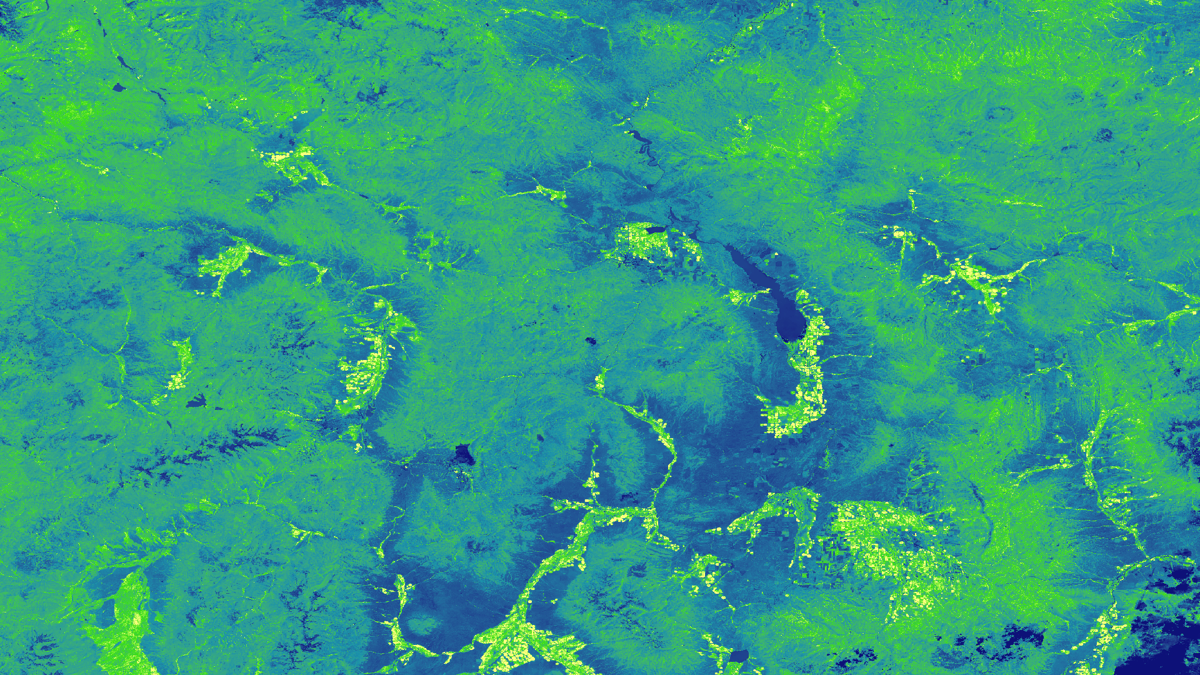
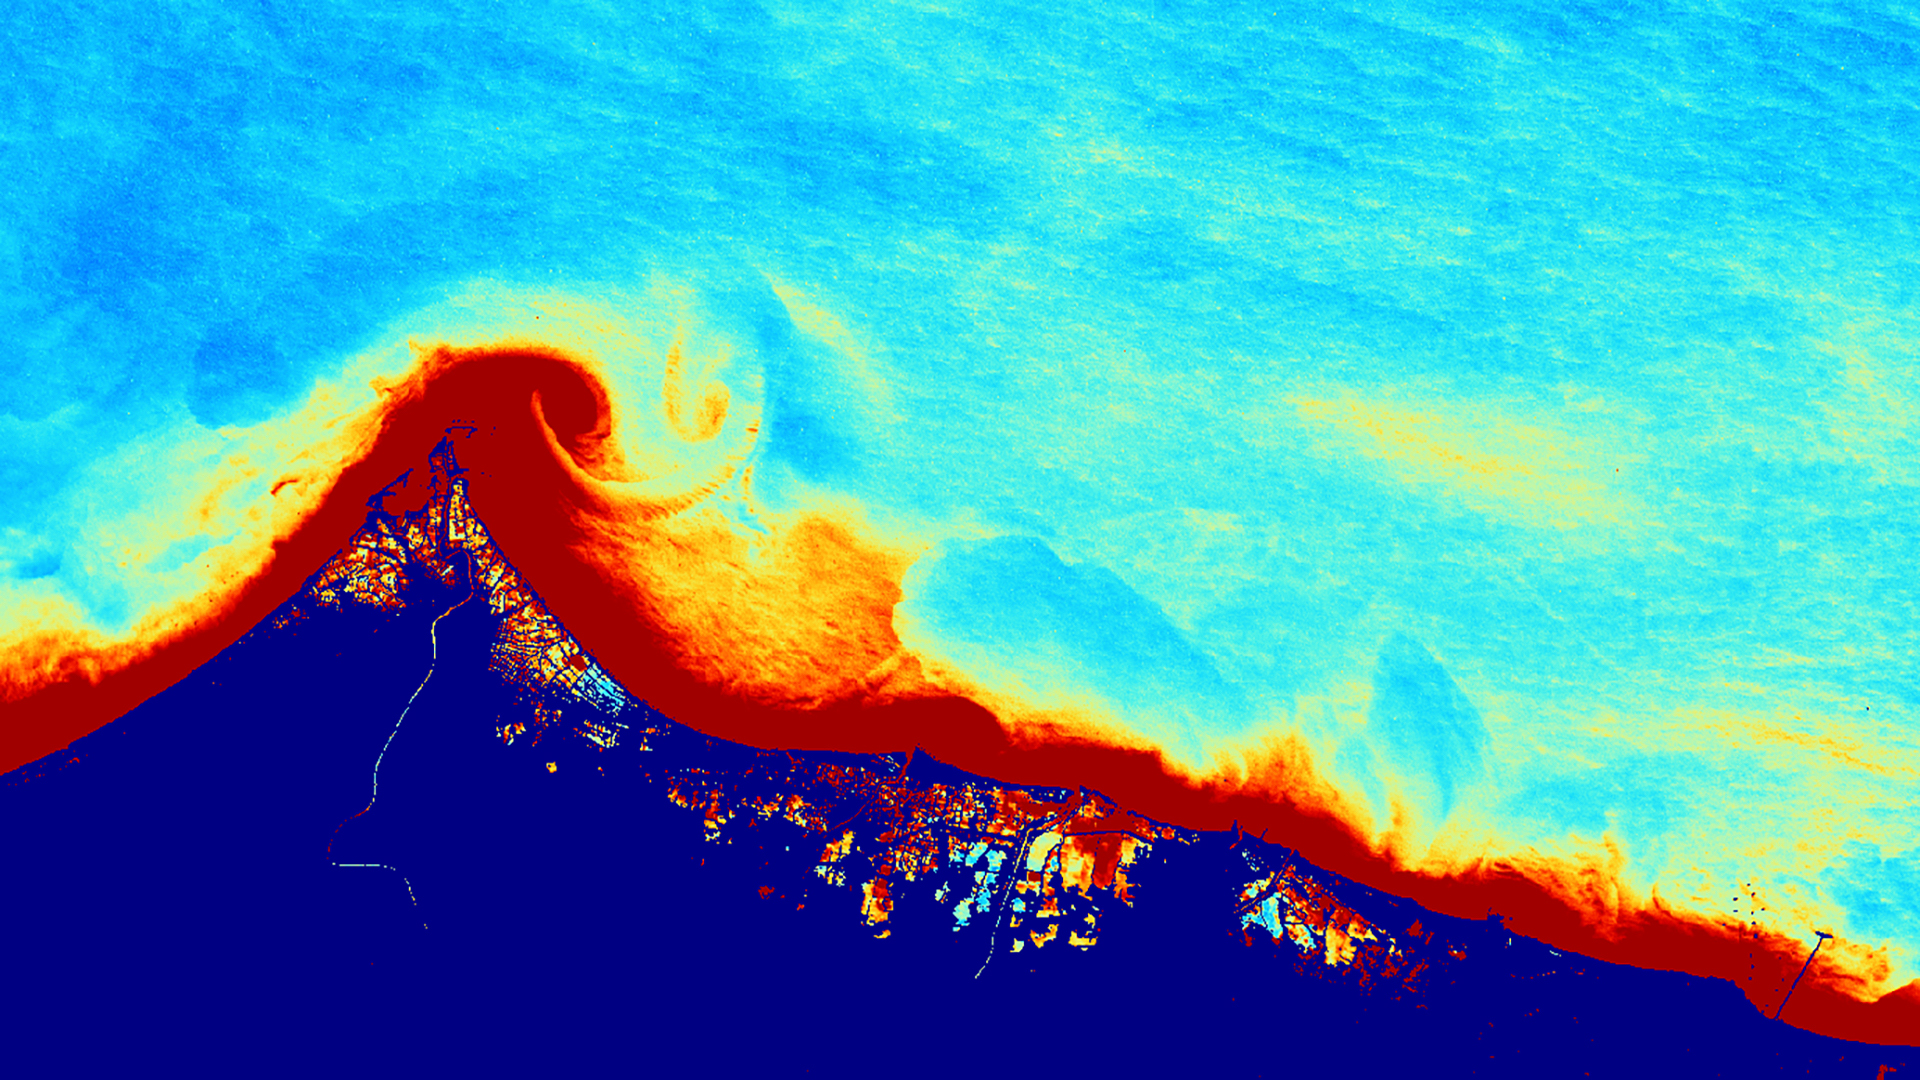
Principal Investigator

Danielle Ruffe

Imagen
Enhancing Coastal Management by Monitoring Hampton’s Coastline and Barrier Island Transgression with the Aid of NASA Earth Observations

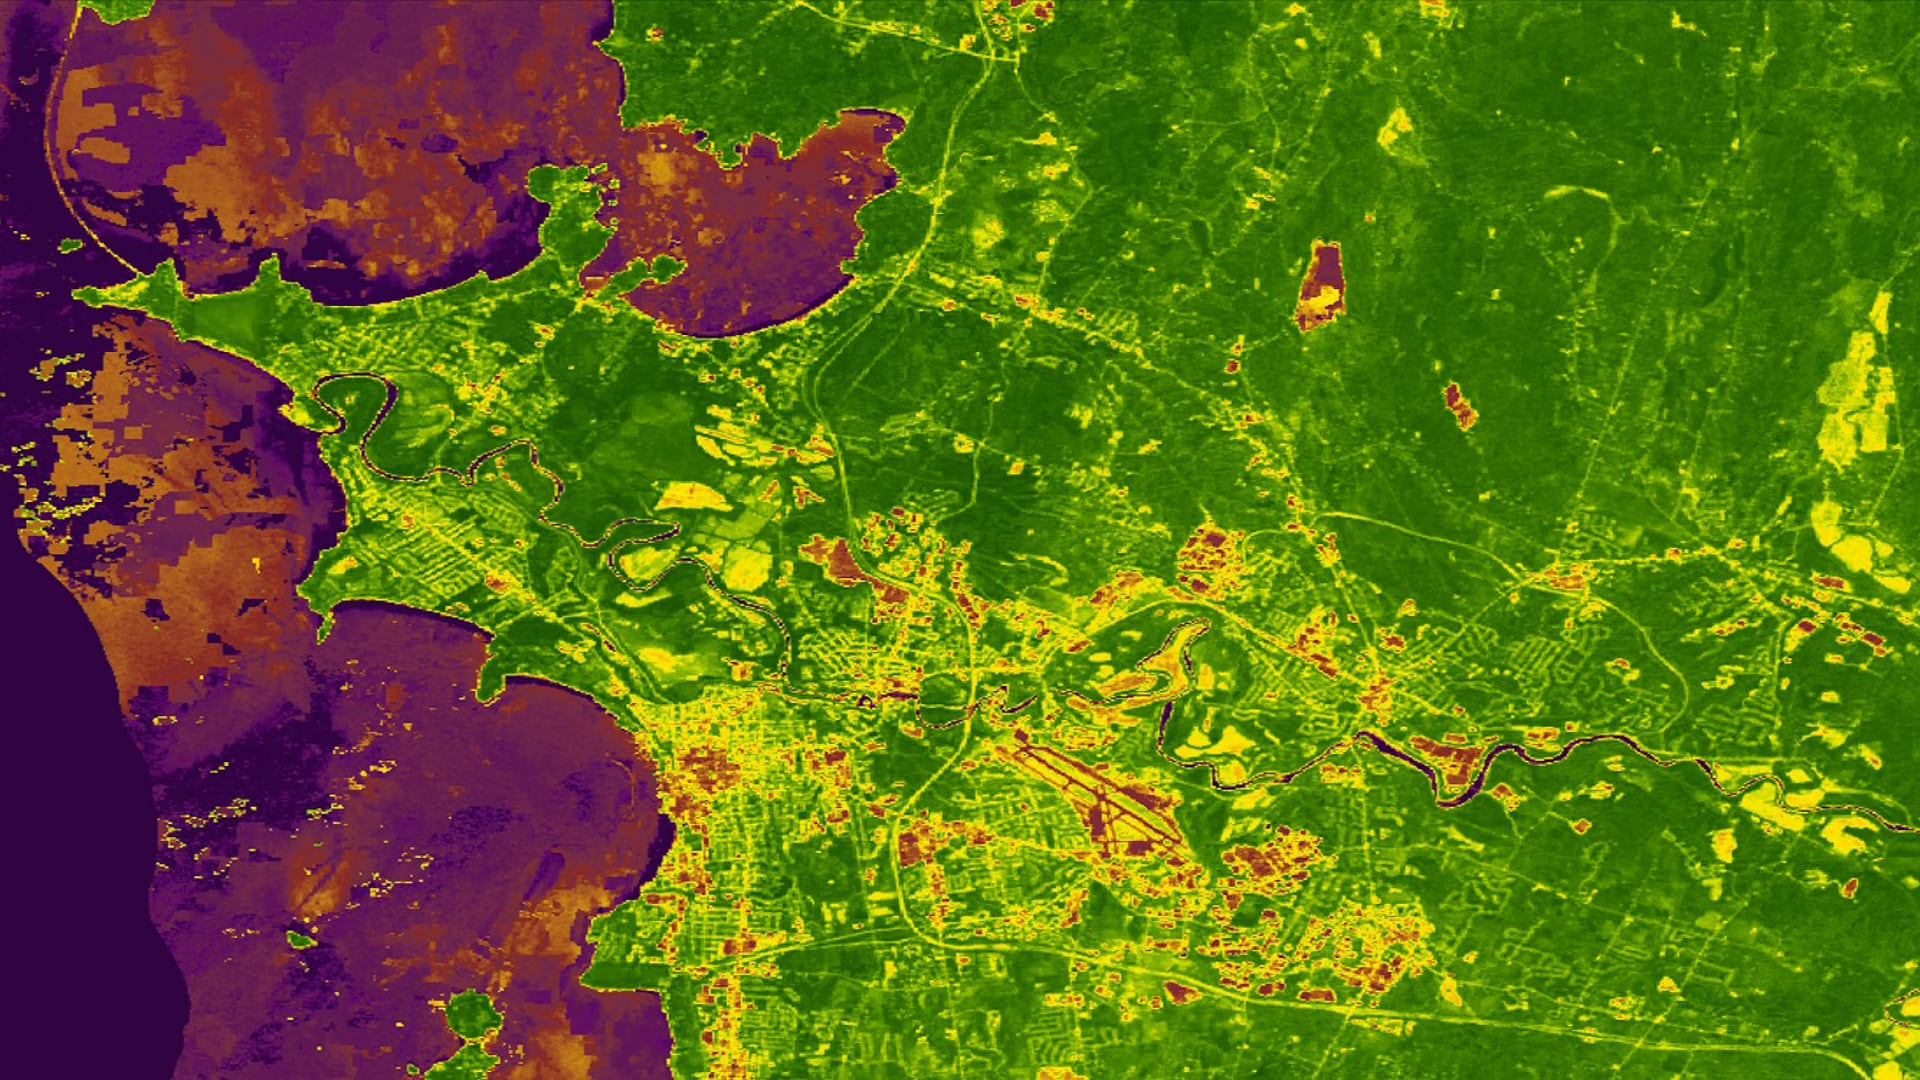
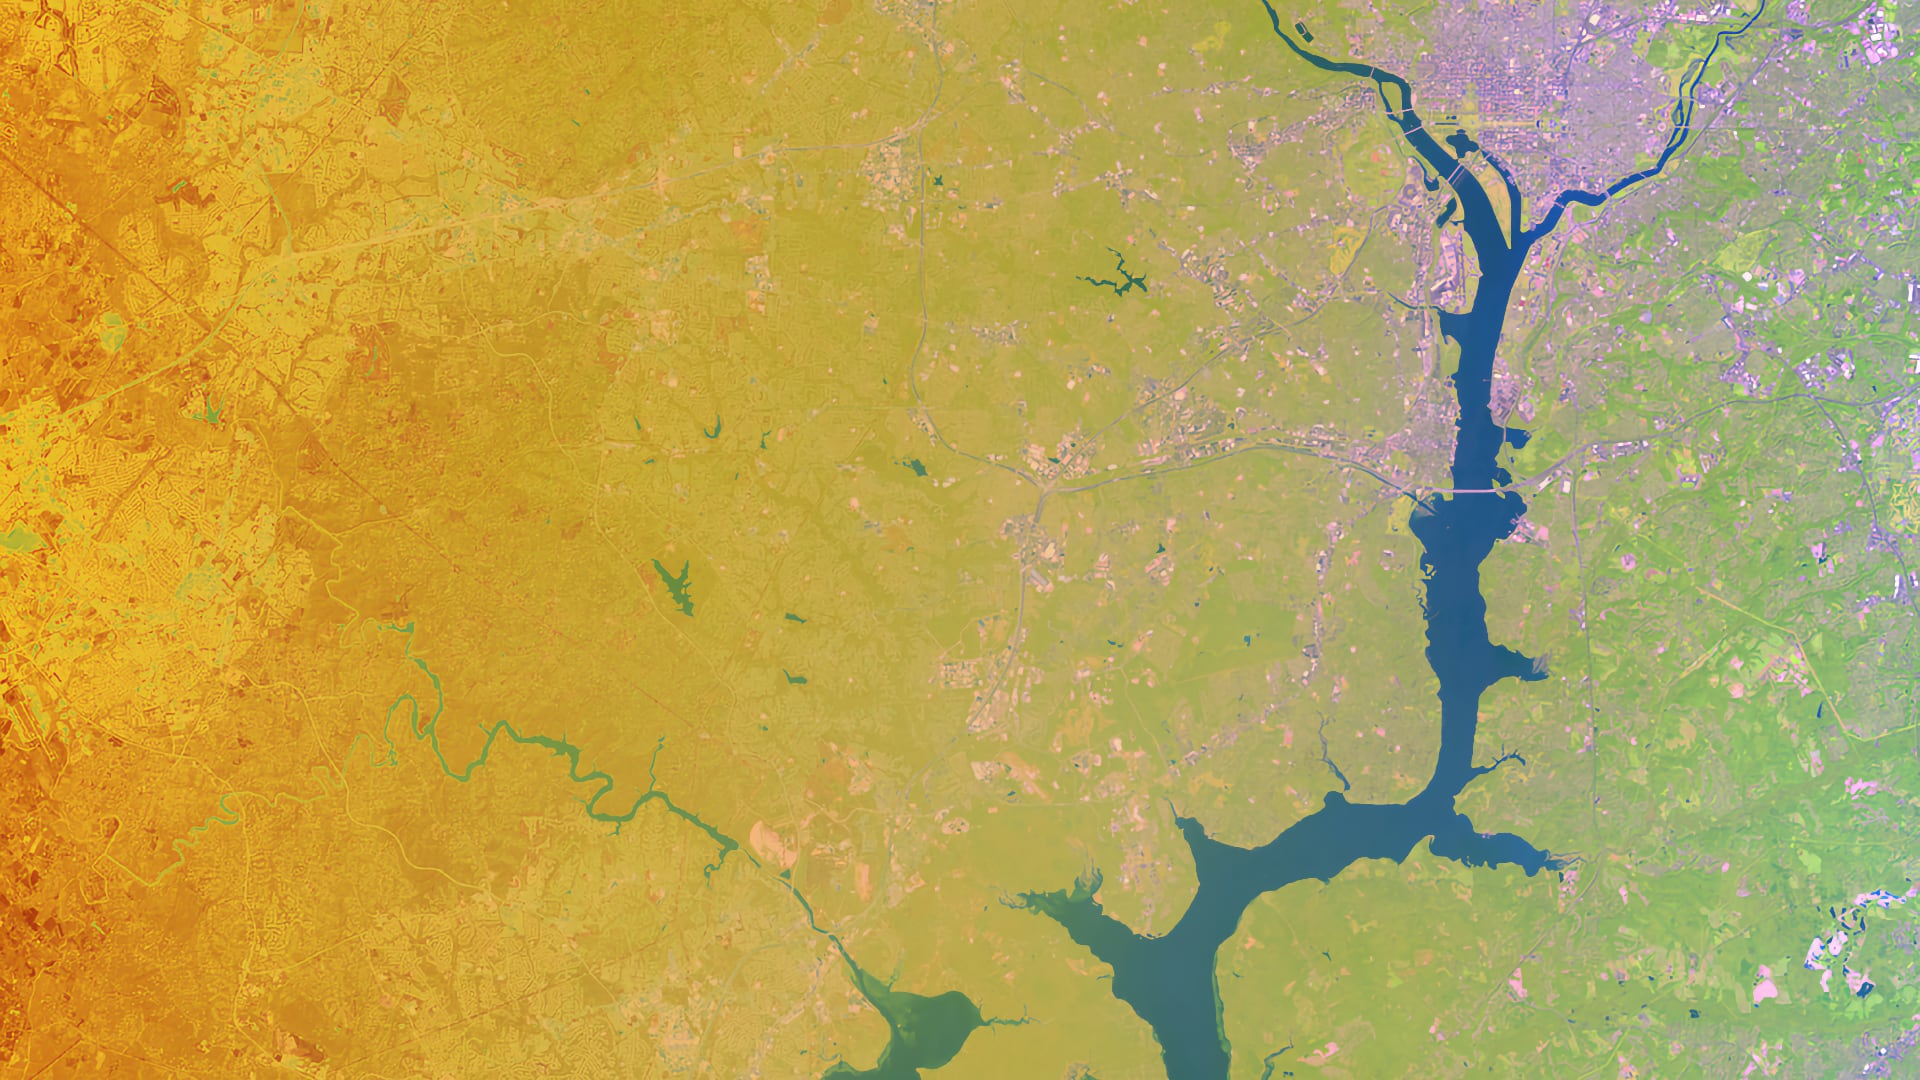
Situated at the mouth of the Chesapeake Bay, Hampton, Virginia is one of the most vulnerable areas in the United States for environmental stressors such as flooding, sea level rise, and storm surge. The city is engaged in several initiatives and partnerships to aggregate geospatial...

Principal Investigator

Austin Counts

Imagen
Enhancing Pre- and Post-Wildfire Vegetation Type Characterization Using NASA Earth Observations

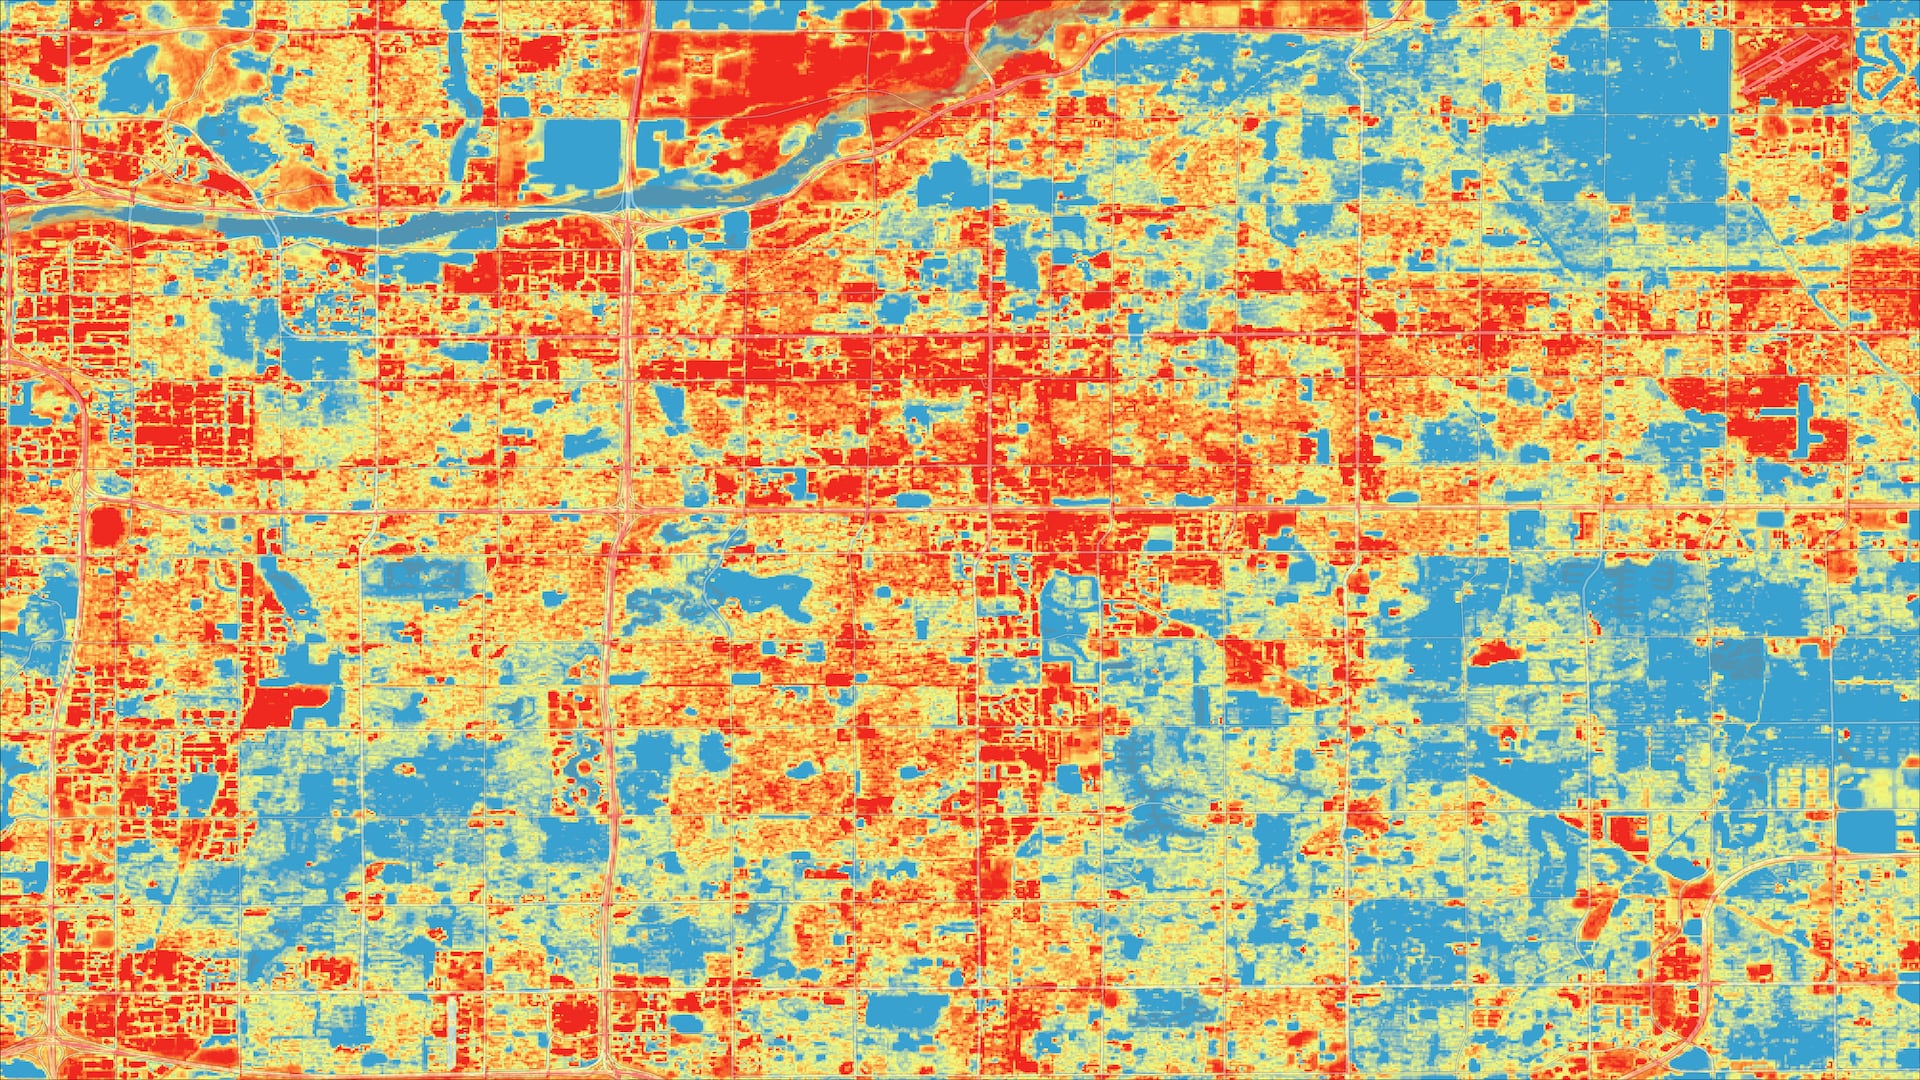
Increasing wildfire frequency has emphasized the importance of post-wildfire recovery efforts in southern Idaho's sagebrush-steppe ecosystem. The changing fire regime favors annual invasive grass species while hindering native grasses and sagebrush habitat regeneration, causing a positive feedback cycle of invasive plants. Due, in part, to...

Principal Investigator

Chloe Schneider

Imagen
Mean snow cover in March 2020 in the Missouri River Basin, derived from the Normalized Difference Snow Index (NDSI), is displayed. The NDSI is obtained from NASA Terra Moderate Resolution Imaging Spectroradiometer imagery. Lighter shades indicate the presence of snow and darker shades indicate absence of snow. Monthly snow cover is compared to historic conditions to assist in drought and flood predictions in the Missouri River Basin.  Keywords: NDSI, Terra, MODIS, snow cover

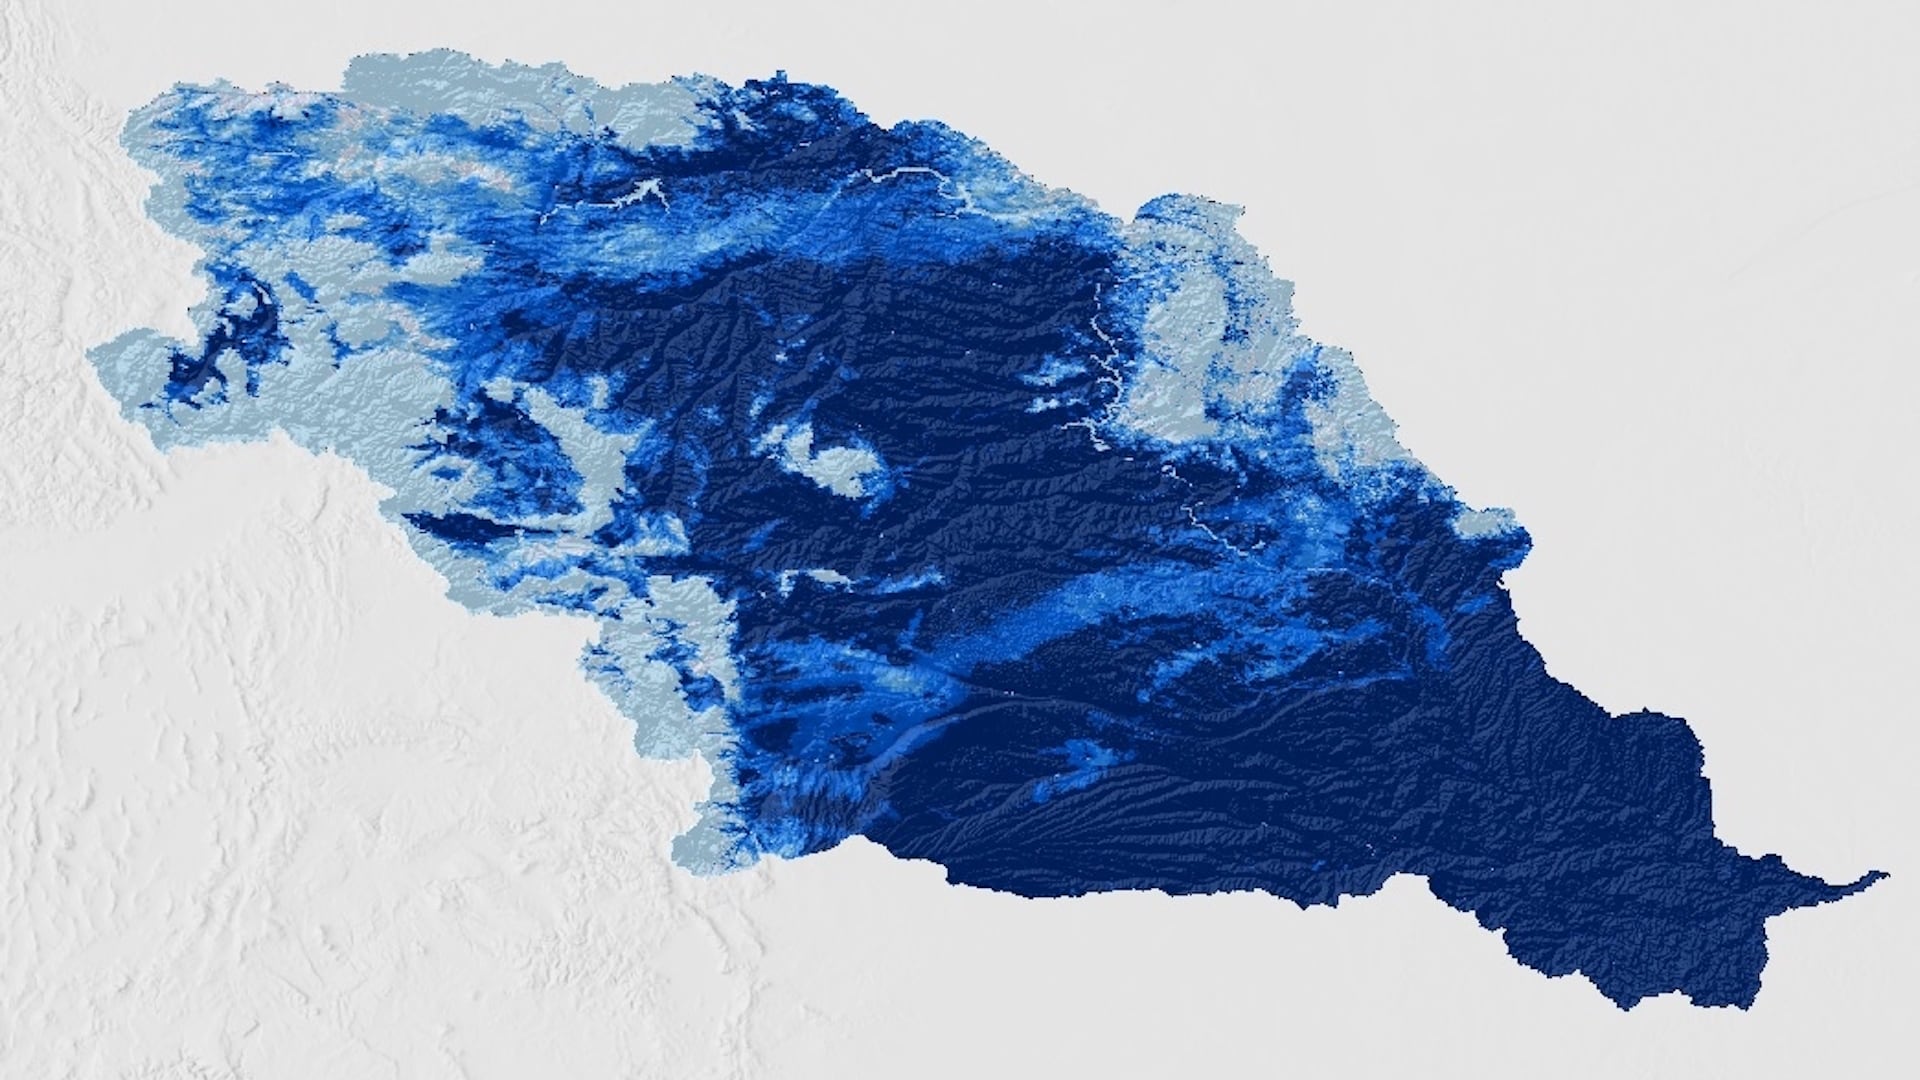
The Missouri River Basin is a major global breadbasket, containing large amounts of agricultural land. Recent devastating weather events have motivated regional organizations to dedicate efforts to drought and flood monitoring and early warning systems. The DEVELOP team partnered with...

Principal Investigator

Brooke Bartlett

Imagen
This image depicts a January through June 2019 Normalized Difference Vegetation Index (NDVI) map for the Burlington, Vermont, area derived from Landsat 8 Operational Land Imager (OLI) data. NDVI quantifies vegetation health by calculating the difference between two bands, near-infrared and red. The purple pixels in the image represent low NDVI values, indicating poor vegetation health, and the green pixels represent high NDVI values, indicating healthy vegetation.

syrup production has historically been at the heart of Vermont’s cultural and economic identity. In 2018, the state was the leading producer in the US, generating 46.6 percent of the country’s maple syrup. However, temperature fluctuations, drought, and variable defoliation...

Principal Investigator

Sydney Boogaard

Imagen
LST-processed imagery using April-October 2019 Landsat 8 TIRS data. The Salt River flows through the northern boundary of Tempe, Arizona. The ArcGIS Pro 2.6.2 Multipart Color Scheme is applied to display variation in LST. Shades of blue indicate low LST, such as the Salt River and golf courses in northwestern Tempe. Shades of yellow indicate medium LST and shades of red indicate high LST. The local municipality can identify areas for urban heat mitigation initiatives.   Keywords: LST, Tempe, Arizona, Anson Pang, Blake Steiner, John Dialesandro, Sydney Boogaard

Located in the northern Sonoran Desert, Tempe, Arizona, features a semi-arid climate with summer daily maximum temperatures regularly exceeding 37.8° C (100.0° F). The area has experienced an increase in surface and air temperatures due to a steep expansion of...

Principal Investigator

Ian Lauer

Imagen
Estimating Soil Moisture in Semi-arid Sagebrush Steppe Utilizing NASA Earth Observations

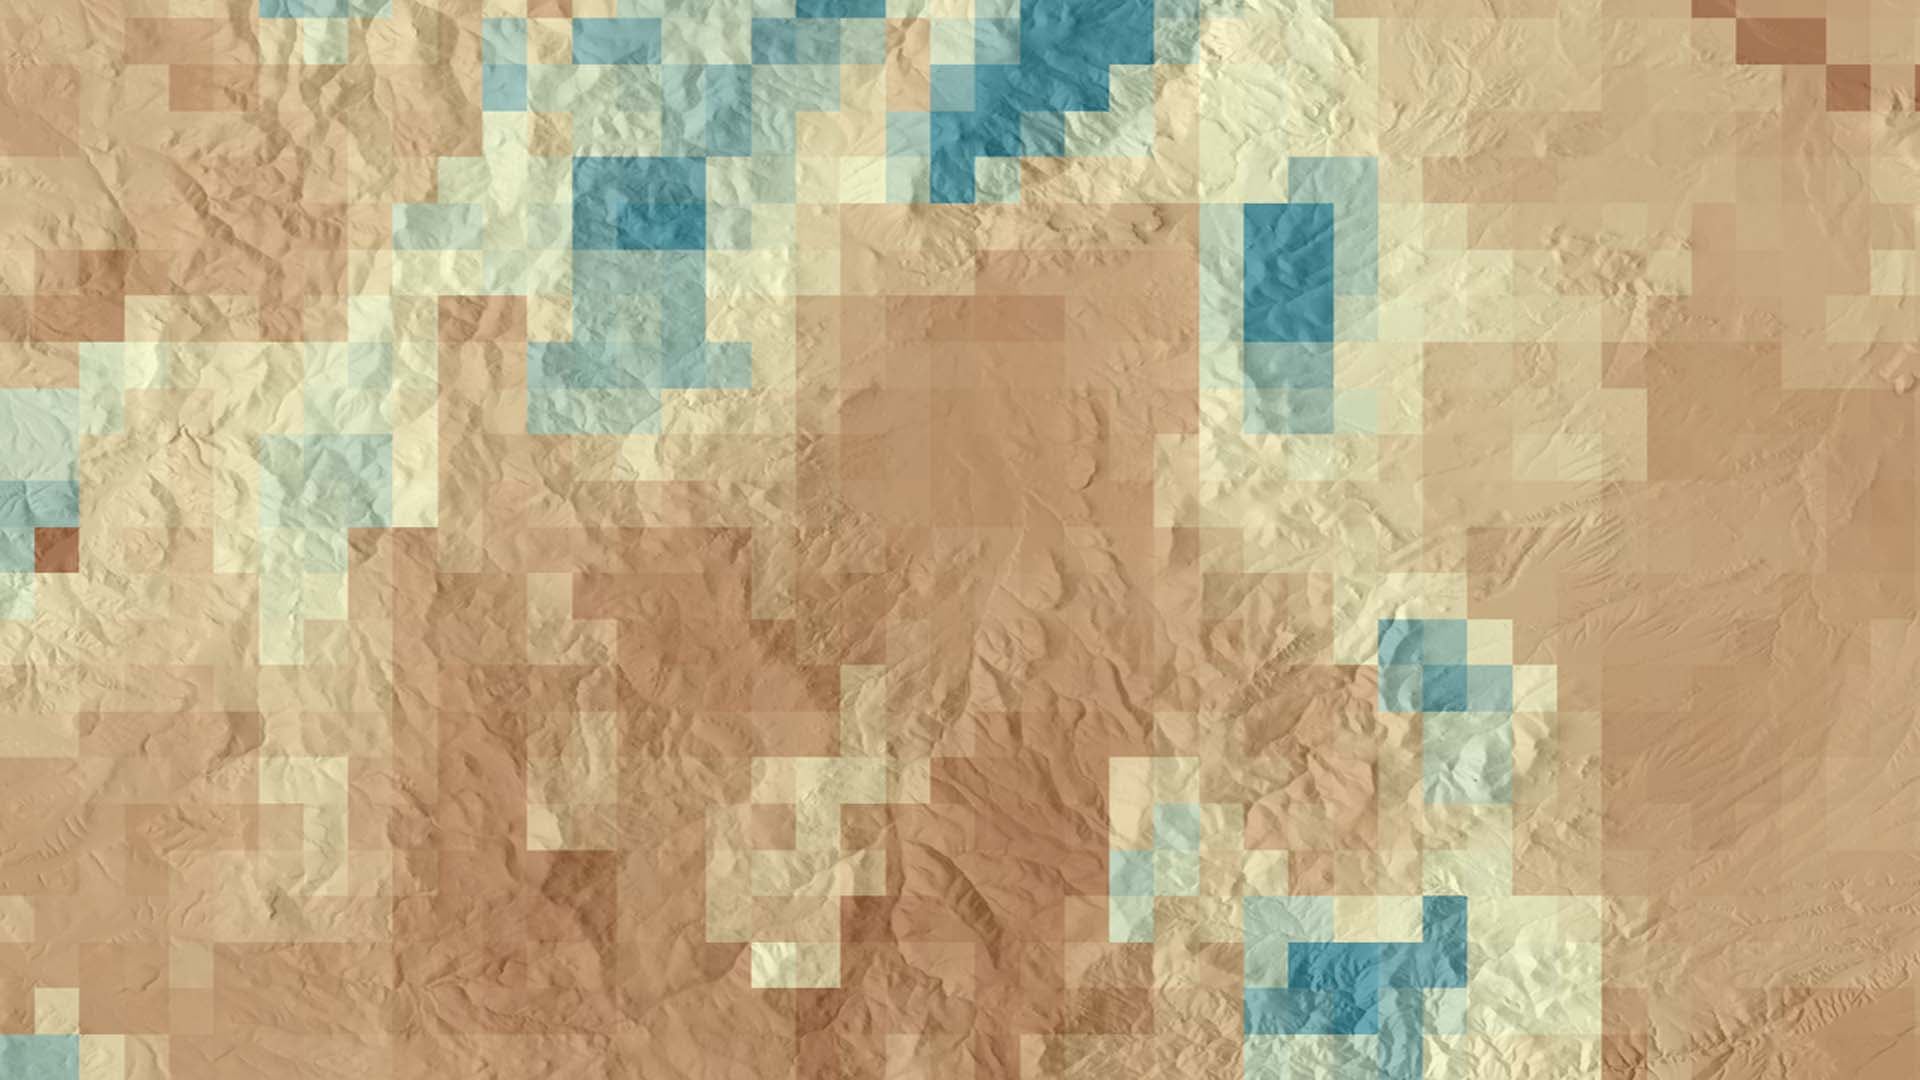
Soil moisture is a critical component of ecosystem health, particularly in semi-arid landscapes where seasonal and infrequent precipitation is one of the primary controls on vegetative health. Current land management practices of soil moisture data collection rely on costly and time-consuming field sampling or on...

Principal Investigator

Kaitlynn Hietpas

Imagen
NDVI-processed imagery using Lansdat 8 data (2020), blended with a true color band combination (4,5,6). Fairfax County located in east Virginia is displayed. The NDVI highlights vegetation and impervious surfaces which were utilized for flood susceptibility modeling.  Keywords: NDVI, Urban Tree Canopy, Impervious Surface, Susceptibility

Between 2000 and 2020, Fairfax County, Virginia experienced extreme weather events that caused severe flooding and degradation of roads, businesses, and other public property. A single flood event on July 8th, 2019 resulted in $14.8 million in damages. These flood...

Principal Investigator

Dean Berkowitz

Imagen
CALIPSO CALIOP aerosol point data rendered in 3D at nighttime from a transect intersecting a smoke plume in northern Idaho on August 19, 2018. Aerosols are symbolized by altitude, with cooler colors representing lower elevations and warmer colors representing higher elevations. Using LiDAR to reveal the vertical structure of wildfire smoke plumes, CALIOP enables the National Weather Service to evaluate the accuracy of mixing height forecasts.  Keywords: CALIPSO, LiDAR, air pollution, wildfire smoke, mixing height

Wildfires in the western United States have caused immense infrastructure damage and loss of human life in recent years. Wildfire smoke, which travels far from its original source, is also harmful to human health. Mixing height, which acts as a...

Principal Investigator

Justine Spore

Imagen
NASA DEVELOP

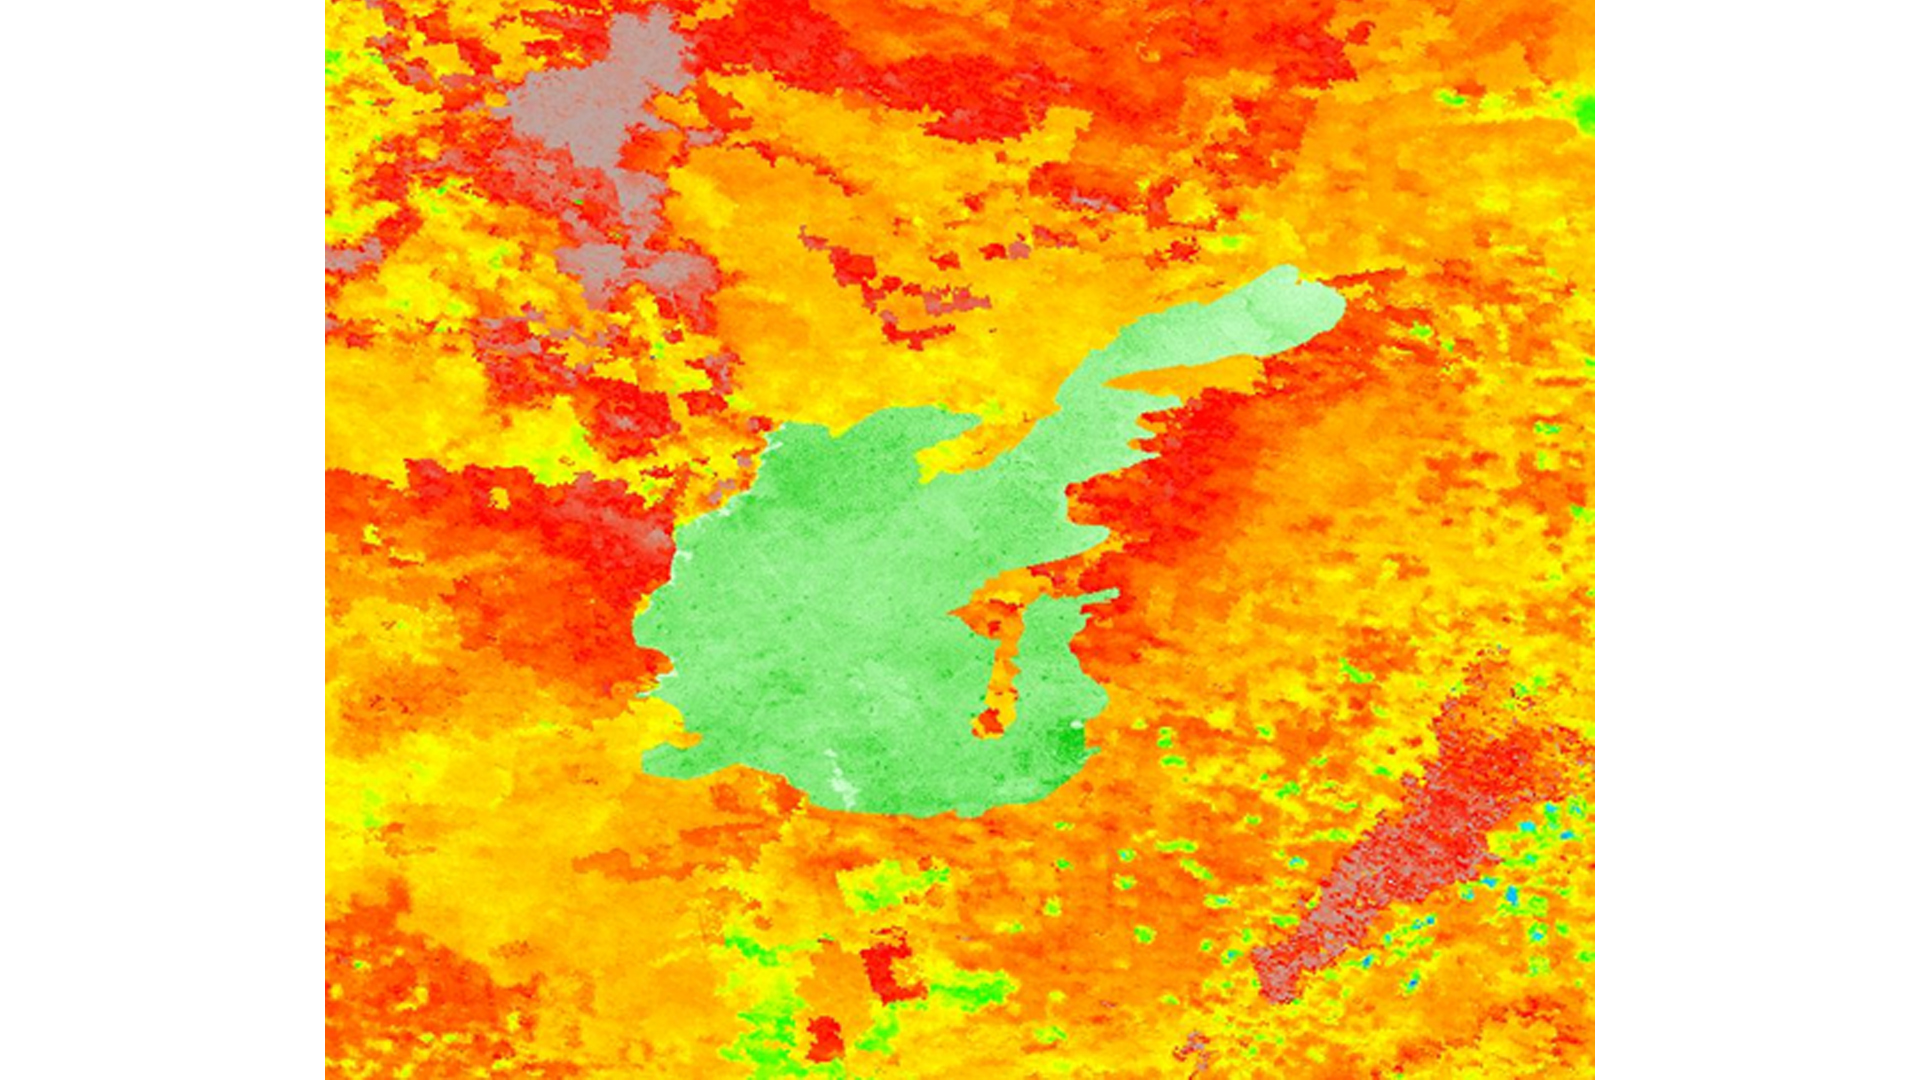
The Tonlé Sap Lake and river basin in central Cambodia provide critical ecosystem services to the region, including fisheries, agricultural irrigation, hydropower, and biodiverse habitats. Deforestation, increased pumping for farming, and effects of climate change such as droughts and forest...

Principal Investigator

Nicole Ramberg-Pihl

Imagen
Coastal turbidity map of Central Java, Indonesia, using Landsat 8 OLI data from June 25th, 2019. The atmospheric correction and Dogliotti turbidity algorithm were processed in ACOLITE and data visualization was completed in SeaDAS. Darker red areas indicate higher turbidity and lighter blue areas represent lower turbidity.  As a trend, turbidity increases close to the shore and near the mouth of notable rivers.  Keywords: Turbidity, Inundation, Indonesia

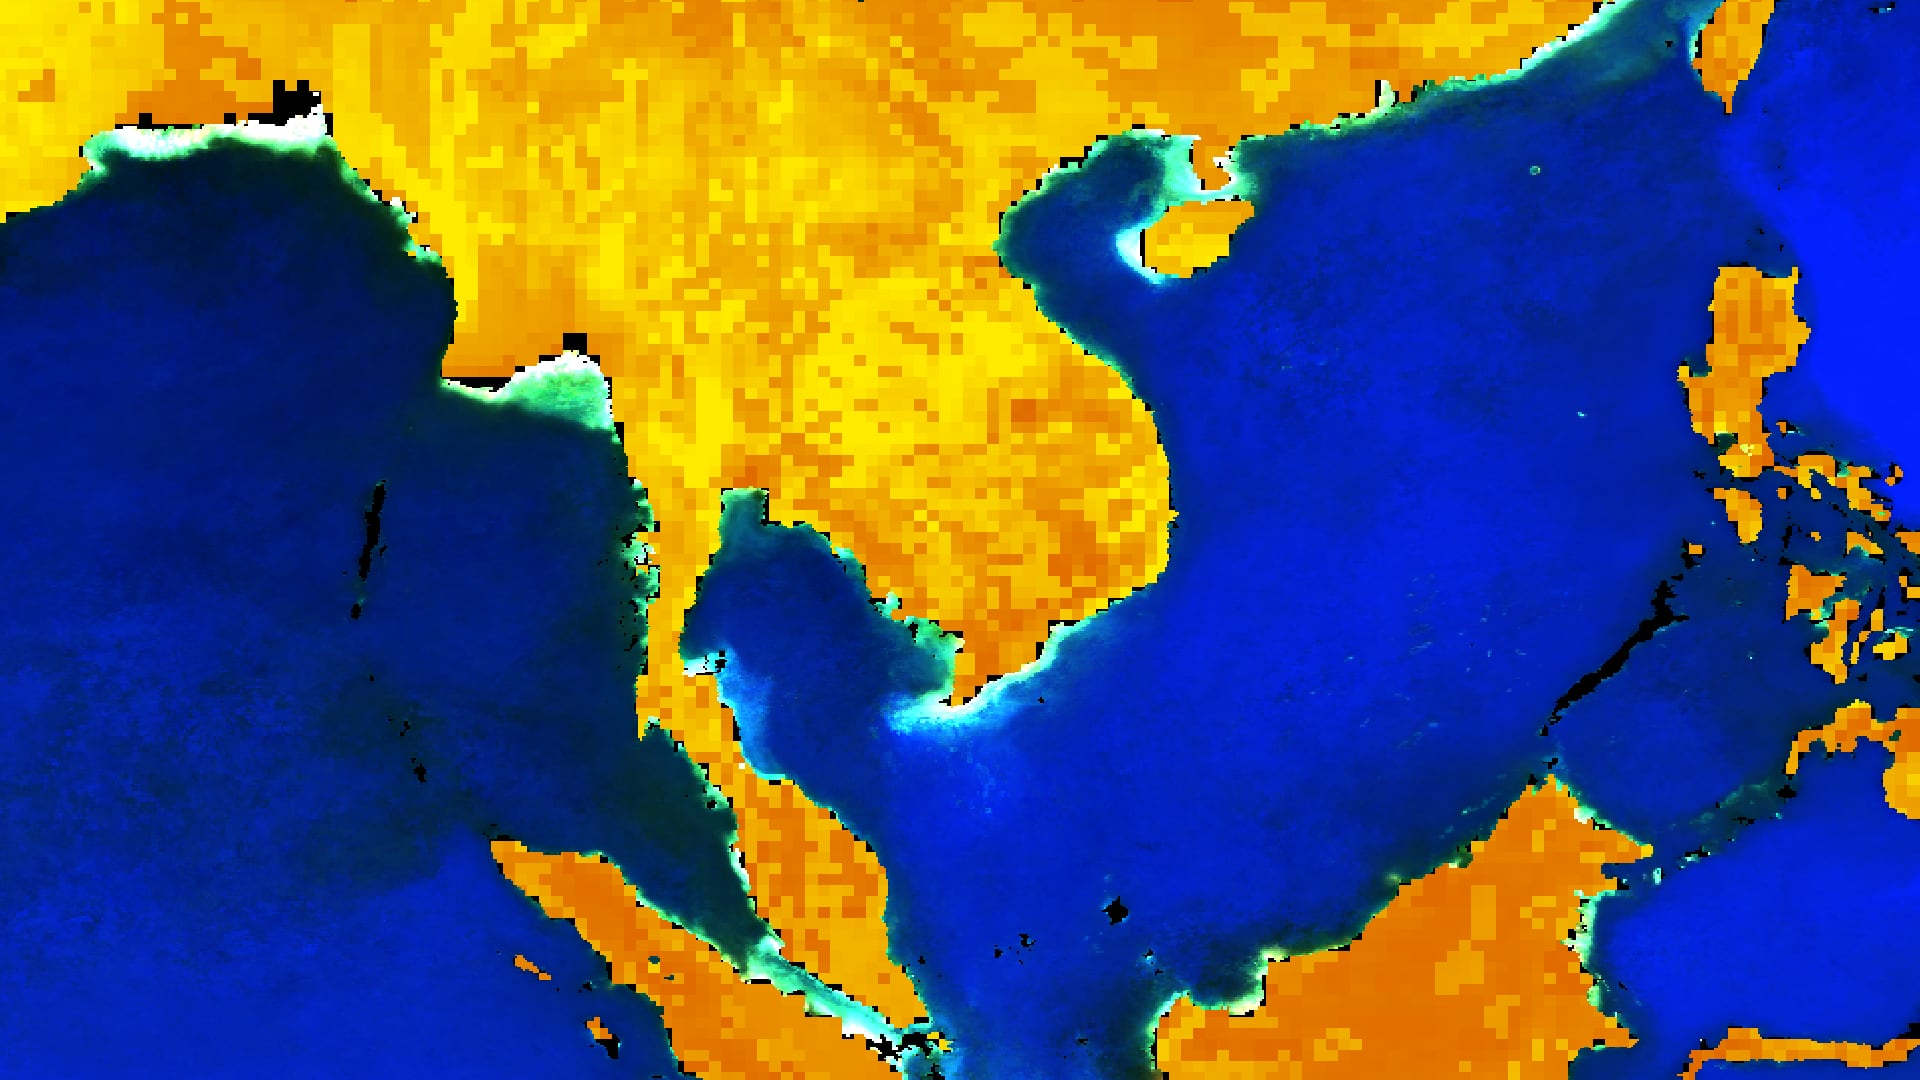
Extreme tidal inundation events resulted in wide-ranging damage to the densely populated coastline of Central Java, Indonesia. Central Java Province is vulnerable to extreme tidal inundation and severe fluxes in marine turbidity due to a combination of factors, including storm...