Principal Investigator

Emily Kinkle

Imagen
Evaluating Methods for Identifying and Monitoring Factors in the Puget Sound that Indicate Eutrophication and Hypoxia

Dissolved oxygen levels have been declining in the Puget Sound since 2000 due to eutrophication, resulting in harmful algal bloom (HAB) events, which negatively impact water quality and wildlife in the area. Therefore, analyzing and identifying eutrophication and hypoxic events is important for water quality...

Principal Investigator

Hikari Murayama

Imagen
Evaluating Potential Sites for Coral Reef Restoration in the Golfo Dulce, Costa Rica Based on Turbidity and Sea Surface Temperature

The Osa Peninsula, located in the southern region of Costa Rica’s Pacific coast, is one of the most biologically diverse places on Earth. NASA DEVELOP partnered with Osa Conservation to analyze the impact of human activity on vital water resources, with a focus on determining...

Principal Investigator

Christine Evans

Imagen
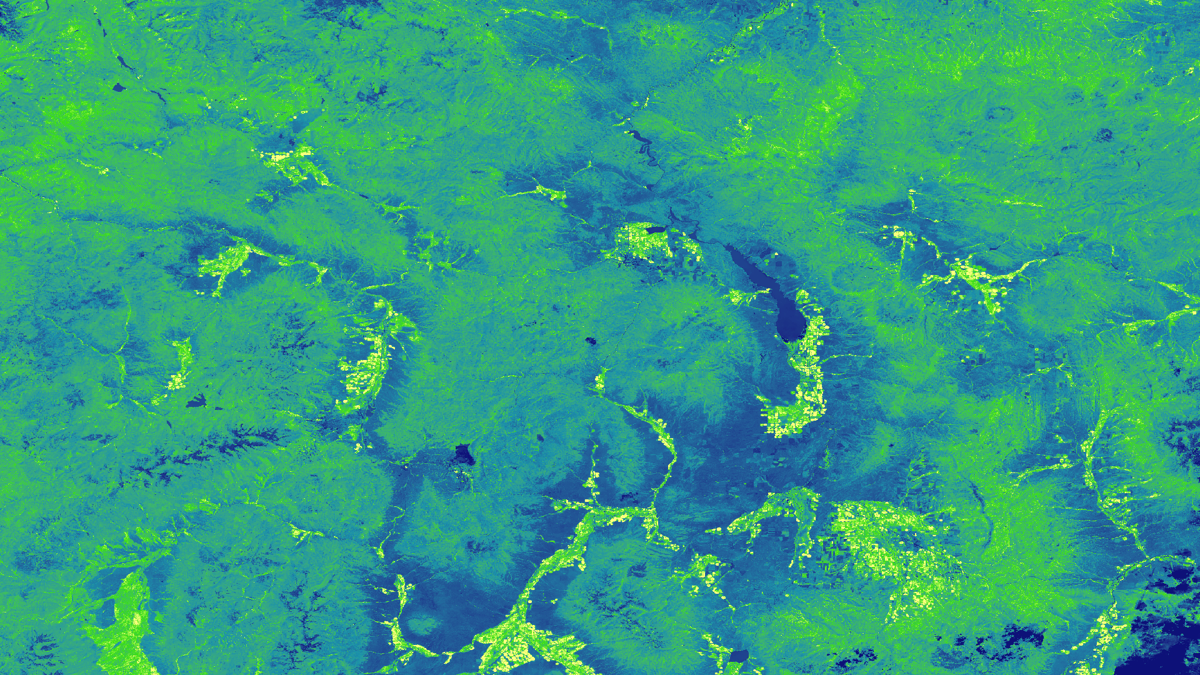
Normalized Difference Vegetation Index (NDVI) derived using Aqua MODIS imagery from 2018. Areas of barren/less vegetated land cover are represented in the darker purple while areas of healthier/more vegetation are represented in the lighter purple. Identifying these different land covers assists in determining where vegetation is thriving and where it is under water stress (higher wildfire potential). This image shows the NDVI values located just south of the Alaska Mountain Range.

Alaska’s wildfire season has progressively increased in duration and intensity over the last decade, leaving forested areas subject to devastating destruction. These increases in wildfire occurrence are due to gradual rises in land surface temperature, decreases in precipitation levels, and...

Principal Investigator

Marco Vallejos

Imagen
NDVI and NDWI-processed imagery of the Tonlé Sap Lake region within Cambodia using 2020 Landsat 8 OLI bands 3, 4, and 5. The NDVI color ramp ranges from hues of orange representing built environments to darker hues of green indicating healthy vegetation. NDWI denotes flood stage lake level extent in lighter shades of blue with deeper shades of blue indicating lake low point during the dry season.  Keywords: NDVI, NDWI, Water Mask, Vegetation, Landsat 8

Tonlé Sap Lake, the largest lake in Southeast Asia, is a critical source of fish and freshwater resources for the region. The health of this freshwater system is under pressure from accelerating dam construction, intensifying agriculture, deforestation, and changing climate patterns...

Principal Investigator

Marshall Worsham

Imagen
This is a composite of five 2018 Landsat 8 OLI/TIRS images taken over Tutuila, American Samoa, mosaicked in Google Earth Engine to minimize visible cloud cover. A land-water band combination (5,3,1) is applied to emphasize coastal boundaries in turquoise, vegetation in orange, development in yellow-white, and persistent clouds in black. Annual composites optimize portrayal of the rainy island’s visible land cover in a given year, giving local conservation managers a route to quantify change over time.

For at least the past two decades, the coral reefs and coastal ecosystems of the American Samoan island of Tutuila have experienced deteriorating water quality. Increased levels of sedimentation, nutrients, and other land-based sources of pollution (LBSP) have negatively impacted...

Principal Investigator

Shelby Ingram

Imagen
Evaluating the Potential of CYGNSS Wind Data to Assess Tropical Storm Impacts on Energy Infrastructure in the Gulf of México

In recent years, the Gulf of México (GoM) has gained national attention for its significant contributions to the country’s overall oil supply – the area today accounts for 17% of all US oil production. The production and availability of such oil resources is threatened when...

Principal Investigator

Lydia Stanley

Imagen
Focused on of the southern half of Mobile County, Alabama, this is an NDVI-processed image overlaid by a land surface temperature (LST) layer obtained from 2019 Landsat 8 OLI/TIRS data. The darker red in the overlay indicate higher LST and lighter yellow shades indicate lower LST. The lighter green tones in the base image represent less healthy vegetation and darker tones represent healthier vegetation. Maps like this help partners identify and mitigate the effects of urban heat islands.

This project utilized satellite Earth observations to assess locations in Mobile County, Alabama, that are vulnerable to the urban heat island effect (UHI) and flood impacts. Our partner, Groundwork Mobile County (GWMC), and other local entities need information on UHIs...

Principal Investigator

Celeste Gambino

Imagen
Above is a supervised land cover classification image using a mosaic of July 12, 19, and 28, 2018 Landsat 8 OLI data of Cumberland County, Maine. The shores of Yarmouth, Harpswell, and Chebeague Island are displayed. Scaled urbanization is shown with lighter blues indicating the most vegetated areas and darker blues indicating the most impervious urban areas. Navy blue represents water. Identifying the land cover type allows for better understanding of tick encounter risk.

Tick-borne diseases are a public health issue in southern Maine, and recent estimates completed by the State of Maine suggest that as little as 1 in 10 cases of Lyme disease are actually reported. There are three tick-borne diseases known...

Principal Investigator

John Dialesandro

Imagen
Split-season composite from May (leaf-on) and November (leaf-off) 2018 in the Allegheny Mountains of West Virginia. This Landsat 8 OLI imagery displays a color combination of SWIR_1 (leaf-on), SWIR_1 (leaf-off), and NIR (leaf-on). Urban areas are shown in pink, impervious surfaces in periwinkle, conifer forests in dark green, and exposed soil in orange. This stack, and others like it, are used for determining land cover classifications and collecting training data for forest restoration efforts.

the Monongahela National Forest (MNF), situated in the Allegheny Highlands of West Virginia, extensive logging and mining practices have significantly altered the structure and composition of flora and fauna over the past two centuries. Of particular concern to MNF land...

Principal Investigator

Maximilian Ioffe

Imagen
Generating Hemispherical Visualizations of Artificial Sky Brightness Using Updated Sky Glow Estimation Tools on Suomi NPP-VIIRS Data

The expansion of the global population in conjunction with rapid industrialization has caused an increase in artificial light pollution, also known as artificial sky glow. Anthropogenic light pollution disturbs the world's ecosystems by interfering with the interconnected life of flora and fauna, degrading night sky...