Displaying 1 - 10 of 13
![Waterfall in lush forest](/sites/default/files/styles/lis/public/2022-01/Hansen.jpeg.webp?itok=eAvgXVwg)
Topic
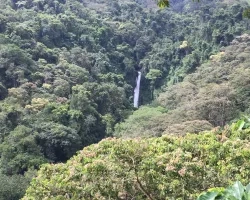
Columbia, Ecuador, and Peru are the most biodiverse countries in the world, and they are part of the Amazon Basin, a major conservation site. The...
![People doing research in ocean](/sites/default/files/styles/lis/public/2022-01/Griffin%20field%20work.jpeg.webp?itok=nCvtt3o9)
Topic
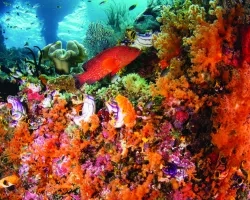
The Belize Barrier Reef System is a fragile environment where water health is highly important, and it is threatened by upstream human activities. The project...
![NDVI image displaying diverse land uses around Puerto Maldonado, Peru. Derived from Landsat 8 OLI, the image is a cloud-removed, composite mean from all available images over the 2020-2021 Peruvian wet season (October – April). Light pinks indicate low photosynthetic activity, and dark pinks and purples indicate high photosynthetic activity. These NDVI data inform land use analyses, which can assist public health and environmental officials in understanding the relationship between land cover and zoonotic d](/sites/default/files/styles/lis/public/2022-03/2021Fall_GA_PeruHealthAQII_WebsiteImage.png.webp?itok=K5sKlDb6)
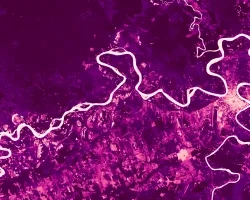
Peru Health & Air Quality II (Fall 2021) Team: Jennifer Rogers (Project Lead), Melanie Cabrera, Gayatri Girirajan, and Julianne Liu Summary: Peru's Madre de Dios...
![2022 Spring JPL Chili Disasters Website Image](/sites/default/files/styles/lis/public/2022-06/2022Spring_JPL_ChileDisasters_WebsiteImage_v4.png.webp?itok=SUHWg_vy)
Chile Disasters (Spring 2022) Team: Maria De Los Santos (Project Lead), Cooper Campbell, Karen Alvarez, Hannah Ferriby Summary: Wildfires in Chile in the last decade...
![Median daily evapotranspiration (ET) from September 2021 to May 2022 calculated from ISS ECOSTRESS data. The image covers the agricultural fields adjacent to the Maipo River, Chile and depicts water stress. The color scale ranges from red (low ET) to blue (high ET), with higher ET observed over irrigated agricultural fields. ET is used for estimating crop irrigation requirements. This data will inform irrigation management practices and help alleviate water scarcity within the area. ](/sites/default/files/styles/lis/public/2022-11/2022Sum_PUP_MaipoRiverValleyAg_WebsiteImage.jpg.webp?itok=DiGPgMrj)
Maipo River Valley Agriculture (Summer 2022) Team: Benjamin Goffin (Project Lead), Duncan Srsic, Rishudh, Sarah Carlos Summary: Agriculture is the primary use of water in...
![NDMI over a wildland urban interface in central Chile generated from Landsat 8 OLI median-reduced data from March 1, 2018 through February 28, 2022. Orange areas represent vegetated shrublands and forests with low moisture content and green areas representing vegetated agricultural areas with high moisture content. The NDMI was used as a proxy for wildfire fuel moisture in a wildfire risk assessment.](/sites/default/files/styles/lis/public/2022-12/2022Sum_LaRC_ChileWildfires_WebsiteImage_V2.jpg.webp?itok=YJDde00a)
Chile Wildfires (Summer 2022) Team: Chris Matechik (Project Lead), Reuben Alter, Jennifer Ruiz, Stephen Sene Summary: In recent years, Central Chile has experienced wildfires of...
![NDVI over Mato Grosso, Brazil processed from March 2021 Landsat-8 OLI data. Calculated NDVI values correspond with colors shown to indicate plant health. High NDVI values (green to blue) indicate dense vegetation found in tropical and temperate forests or crops at their peak growth. Low values (yellow to red) depict barren land, water, and moisture-stressed vegetation. These data can support timely and efficient agricultural responses to ensure productive yields and food security.](/sites/default/files/styles/lis/public/2022-12/2022Sum_NC_MatoGrosso_WebsiteImage_FD.png.webp?itok=JJA3kKJi)
Mato Grosso Agriculture (Summer 2022) Team: Max Rock (Project Lead), Elijah Dalton, Aidan Harvey, Kate Reynolds Summary: Ranked as the fourth largest food producer in...
![Forest/non-forest classification from 2022 Landsat 9 OLI-2 -derived imagery provided by NASA SERVIR. This image is of Volcan Baru in Panama. Green represents forest and blue represents agriculture and bare land. Yellow represents shrub, urban, wetland, plateaus, savanna, pastures, and pine. This forest/non-forest classification covers the entirety of the Mesoamerican Biological Corridor which provides valuable regional information to our partners.](/sites/default/files/styles/lis/public/2023-02/2022Fall_MSFC_MesoamericaEcoForecasting_WebsiteImage.jpg.webp?itok=hpxlOp_J)
Mesoamerica Ecological Forecasting (Fall 2022) Team: Hanna Jung (Deliverables Lead), Ross Kalter (Technical Lead), Ameilia Untiedt, Cristina Villalobos-Heredia Summary: In 1992, Central America and Mexico...