Displaying 641 - 650 of 728
![Eastern region of the Baa Atoll in the Republic of Maldives. The red indicates areas that would likely be flooded by 2100 according to the most extreme IPCC AR6 Shared Socioeconomic Pathway scenario, as identified through the NASA Sea Level Projection Tool. CoastalDEM, derived from NASA's SRTM sensor, provided elevation data. The base map image was taken in January 2023 by Planet Labs. Shades of yellow and green indicate shallow water and land surfaces. Includes copyrighted material of Planet Labs PBC. All](/sites/default/files/styles/lis/public/2023-04/2023Spring_ARC_MaldivesClimateII_WebsiteImage.jpg.webp?itok=U9qoVeWo)
Topic
Maldives Climate II (Spring 2023) Team: Ben Dahan (Project Lead), Evan Barrett, Tiffany Hsu, Gabriel Halaweh Summary: The Republic of the Maldives is a low-lying...
Ecological Conservation
![Image of fires in California as seen from space](/sites/default/files/styles/lis/public/2023-05/Website_Header_v2.jpg.webp?itok=8BC8IA29)
Training Type
Level
Advanced
Date
July 06, 2023 - July 13, 2023
![Evaporative Stress Index (ESI) processed imagery from ECOSTRESS data, captured on October 4, 2021, for Marin County in the San Francisco Bay Area. Darker regions have a higher ESI value, signifying moister conditions, while lighter regions are drier. Vegetative moisture has a significant impact on fire severity and understanding localized moisture conditions can inform the county’s fire suppression efforts. Land outside of Marin County shows NDVI processed imagery derived from Sentinal-2A data.](/sites/default/files/styles/lis/public/2023-05/2023Spring_ARC_MarinCountyWildfires_WebsiteImage.png.webp?itok=FQS2THAF)
Topic
Marin County Wildland Fires (2023 Spring) Team: Suhani Dalal (Project Lead), Katera Lee, Chandler Ross, Gabriel Rosenstein Summary: Heightened occurrence of severe wildfires in the...
![Canopy cover in the greater Ben Delatour Scout Ranch region from a 2013 NAIP Image with a slope and aspect layer derived from a 10-meter digital elevation model (DEM). This image illustrates how elevation-derived variables are used to inform classification models to map canopy cover. Canopy is displayed as red, and the map illustrates that there are higher concentrations of canopy on northern aspects- illustrating the nature of tree density in our study region. ](/sites/default/files/styles/lis/public/2023-05/2023Spring_CO_FrontRangeWildlandFires_WebsiteImage.png.webp?itok=MHr1Zy9O)
Topic
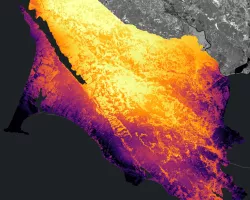
Front Range Wildland Fires (2023 Spring) Team: Nora Carmody (Project Lead), Lillian Gordon, Nathan Teich, Josh Virene Summary: Over the last several decades, wildfire frequency...
![Snow persistence data were processed into snow zones from Terra MODIS 500m resolution data from 2001-2020. 2021 30m resolution rangeland biomass data from the RPMS website. RPMS data (brown and black) are derived from Landsat 5 TM, 7 ETM+, 8 OLI, and 9 OLI-2. The image displays snow persistence zones, with intermittent, transitional, and persistent snow zones in orange, light blue, and dark blue respectively. The image includes parts of the Sawatch and Elk Mountains.](/sites/default/files/styles/lis/public/2023-05/2023Spring_CO_WesternSlopeAg_Website_image.jpg.webp?itok=A7yts3_b)
Topic
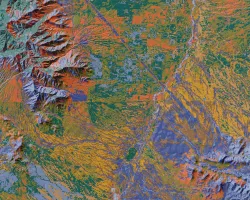
Southern Rockies Western Slope Agriculture (2023 Spring) Team: Adelaide Gonzalez (Project Lead), Rachel Buchler, Max VanArnam, Stephanie Willsey Summary: Over the last decade, the southern...
![Land cover classification of the Arizona – Mexico border region from April 26, 2022 Landsat 8 OLI imagery. Colors represent land cover types determined by a machine learning clustering algorithm. Classifications help natural resource specialists assess vegetation cover and invasive spread, informing land management practices. The landscape impact of the border is visible as the horizontal break roughly mid-image––Coronado National Memorial and other conserved lands abut the border and experience landscape i](/sites/default/files/styles/lis/public/2023-05/2023Spring_GA_CoronadoEco_WebsiteImage.jpg.webp?itok=-sRGC428)
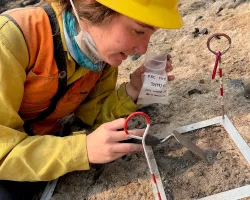
Coronado Ecological Conservation (2023 Spring) Team: Carson Schuetze (Project Lead), Tyler Guigneaux, Charles Robinette, Josie Bourne Summary: Species monitoring is essential for mitigating the impacts...
![The image was collected by Landsat 9 on January 26 of 2023 showing Skidaway Island and waterways on the Georgia coast. The data shows areas of healthy vegetation and urban areas using a Normalized Difference Vegetation Index (NDVI). The darker orange represents grass and urban areas. Yellow and purple represents forested and densely vegetated areas. The black represents open water.](/sites/default/files/styles/lis/public/2023-05/2023Spring_GA_GeorgiaDisastersII_WebsiteImage.jpg.webp?itok=zhMhpiSz)
Georgia Disasters II (2023 Spring) Team: Shakirah Rogers (Project Lead), Nathan Tesfayi, Matthew Murray, Clarence Jackson Summary: Heirs property owners are especially vulnerable to natural...