Displaying 1 - 10 of 20
![Median day time Land Surface Temperature (LST) calculated using June – September 2016 – 2021 thermal imagery from Landsat 8 TIRS. Displayed is the city of Yonkers, located in Westchester County, directly north of the Bronx in New York City and right of the Hudson River. Shades of yellow–red indicate high LST. Green–teal shades indicate cooler LST. Solid purple represents water bodies. Focusing on yellow-red areas allows the city of Yonkers to prioritize heat mitigation strategies.](/sites/default/files/styles/lis/public/2022-03/2021Fall_AZ_YonkersUrbanII_WebsiteImage_1440.png.webp?itok=l-QdbVsl)
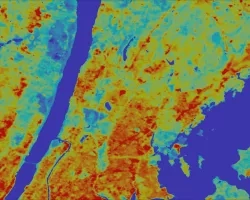
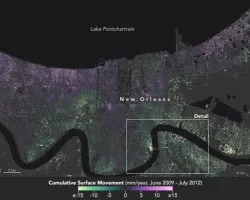
Yonkers Urban Development II (Fall 2021) Team: Tamara Barbakova (Project Lead), Akshay Agrawal, Amanda Trakas, Kyle Pecsok, and Lauren Mahoney Summary: The City of Yonkers...
![2022 Spring PUP UHEAT Urban Development Website Image](/sites/default/files/styles/lis/public/2022-06/2022Spring_PUP_UHEATUrban_WebsiteImage_v2.png.webp?itok=aEsXqOPp)
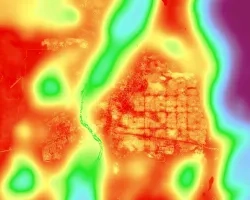
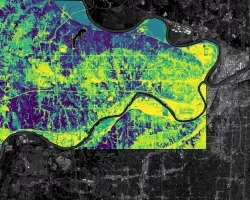
UHEAT Urban Development (Spring 2022) Team: Akshay Agrawal (Project Lead), Myung Sik Cho, Zainab Farid, Vanessa Machuca Summary: Extreme heat is a leading weather-related cause...
![NDWI-processed image derived from Landsat 7 ETM+ data captures the aftermath of a 3-inch rainstorm in Milwaukee, Wisconsin. The composite image shows inundated areas in blue and dried areas in orange a few days after an April 2015 storm. Satellite imagery used in conjunction with hydrological models allow the city to identify areas in need of flood mitigation strategies.](/sites/default/files/styles/lis/public/2022-11/2022Sum_VEJ_MilwaukeeUrban_WebsiteImage_v2_final.jpg.webp?itok=Gyny1SDX)
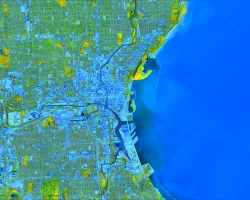
Milwaukee Urban Development (Summer 2022) Team: Madeleine Tango (Project Lead), Jack Acomb, Lisa Son, Annika Harrington Summary: Milwaukee County has experienced an increase in flooding...
![Summer 2022 Albuquerque Urban Development](/sites/default/files/styles/lis/public/2022-11/2022Sum_AZ_ABQUrban_WebsiteImage.jpeg.webp?itok=LRwbaWtz)
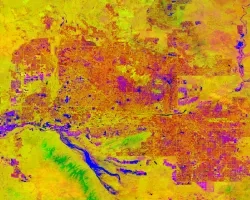
Albuquerque Urban Development (Summer 2022) Team: Max Stewart, Christina Dennis, Ritisha Ghosh, Richard Kirschner, Steven Nystrom Summary: The City of Albuquerque, New Mexico, is experiencing...
![NDVI imagery derived from Landsat 8 OLI data. This imagery showing the California’s Carmel and Salinas Valleys within the surrounding Santa Lucia Mountain range was collected in the Spring of 2019 . Light green areas show the more developed, agriculturally intensive areas of the valley while the dark blue areas show the less developed hills. NDVI calculations were used in models of forest cover changes in the area over time.](/sites/default/files/styles/lis/public/2023-02/2022Fall_CO_CarmelValleyEcoForecasting_WebsiteImage.jpg.webp?itok=AwlUPU2s)
Carmel Valley Urban Development (Fall 2022) Team: Cooper Campbell (Project Lead), Julia Portmann, Devina Garcia, Audrey Wilson Summary: Urban expansion in diverse ecosystems has numerous...
![Urban extent derived from Landsat 8 OLI data. This image shows urban extent in Guatemala City in 2020 as calculated using the Landtrendr algorithm in Google Earth Engine. The lighter colors of yellow and orange depict urban area, and the darker shades of pink and purple indicate the natural environment. Guatemala City has experienced rapid growth in recent decades, and local decision makers are interested in its impacts on various social and environmental factors.](/sites/default/files/styles/lis/public/2023-02/2022Fall_MSFC_Guatemala%26PanamaUrban_WebsiteImage.jpg.webp?itok=BNkWD8K5)
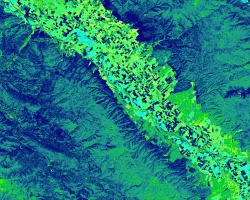
Guatemala & Panama Urban Development (Fall 2022) Team: Jennifer Ruiz (Project Lead), Coral Del Mar Valle Rodríguez; Viviana Lademan; Aaron Whittemore Summary: Central America is...
![This image of Land Surface Temperature (LST) illustrates the urban heat island (UHI) effect that Milwaukee County experiences. Light orange areas represent hotter temperatures, which are concentrated in the high impervious areas of the city. Darker pinks represent cooler rural areas and underscore the temperature contrast across the landscape. The hotter areas of the city are historically redlined communities of color that disproportionately feel the effects of the UHI, including higher energy bills heat re](/sites/default/files/styles/lis/public/2023-02/2022Fall_VEJ_MilwaukeeUrbanII_WebsiteImage.png.webp?itok=fmSKISME)
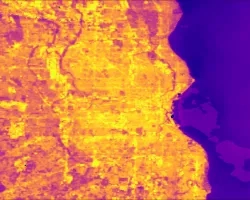
Milwaukee Urban Development II (Fall 2022) Team: Nash Keyes (Project Lead), caleigh McLaren, Nati Phan, Dalia Vazques Summary: Milwaukee’s neighborhoods experience increased social, health, and...
![Median land surface temperature (LST) image over Los Angeles from June to August 2022, as derived from Landsat 8 TIRS data. Higher temperatures are shown in red, while cooler temperatures are displayed in blue. LST data can help investigate the impacts of urban cooling initiatives and inform urban planning decisions to mitigate the impacts of heat within the city.](/sites/default/files/styles/lis/public/2023-05/2023Spring_JPL_LosAngelesUrban_WebsiteImage.png.webp?itok=1olFjNJd)
Topic
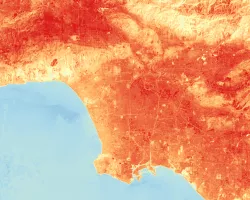
Los Angeles Urban Development (2023 Spring) Team: Leyla Namazie (Project Lead), Julie Gevorgian, Theodore Ross, Stephanie Hernandez Summary: Over the last several decades the city...
![The InVEST urban flood model produces various outputs, like the runoff retention seen here. The model output was derived from GPM IMERG, land cover, soil type, and curve number data. This image is from the extreme rainfall storm event on August 22, 2017. This image shows where the runoff is being retained in Kansas City, KA. The dark purple represents extremely high runoff retention while the yellow represents low retention with the green and blue representing increasing amounts of retention. The background](/sites/default/files/styles/lis/public/2023-05/2023Spring_PUP_InVESTUrban_WebsiteImage.jpg.webp?itok=RnmwUCoD)
Topic
InVEST Urban Development (2023 Spring) Team: Son Do & Jessica Besnier Summary: Urban flooding poses as one of the biggest issues for cities today as...