Displaying 501 - 510 of 568
![The green areas show stable forest in NW Alabama classified by both National Land Cover Dataset (2016-2019) and Landscape Change Monitoring System(2016-2021), and the pink areas are areas where forest cover loss was sensed by NLCD, LCMS, LandTrendr (2016-2021), and Global Forest Watch (2016-2021). These datasets and the basemap were made with Landsat 5 Thematic Mapper, Landsat 7 Enhanced Thematic Mapper Plus, and Landsat 8 Operational Land Imager.](/sites/default/files/styles/lis/public/2023-05/2023Spring_MSFC_SoutheastUSClimateII_WebsiteImage.jpg.webp?itok=3mAADCnc)
Southeast US Climate II (2023 Spring) Team: Cassie Ferrante (Project Lead), Katherine Scott, James Karroum, Cate Lull Summary: The balancing of atmospheric CO2 sources and...
![The data for this image comes from NASA satellite Landsat 8 Operational Land Imager. Normalized Difference Vegetation Index and Cropland Data Layers were used to create the image. The black, brown, and bright green specks represent the different crops growing near Wheeler Lake Watershed in North Alabama. NDVI and cropland data can be used to predict and evaluate the effects of flash drought on agricultural crops.](/sites/default/files/styles/lis/public/2023-05/2023Spring_MSFC_SoutheastUSAg_WebsiteImage.jpg.webp?itok=zZsHeQGk)
Topic
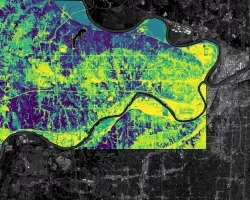
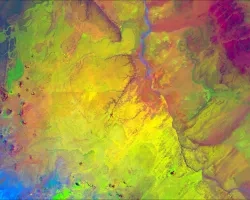
Southeast US Agriculture (2023 Spring) Team: Kindrea Gibbons (Project Lead), Michaela Gooch, Quinton Deppert, Casey Mills Summary: A flash drought refers to the rapid onset...
![Normalized Difference Snow Index (NDSI) Image calculated from a May 2021 Landsat 8 top-of-atmosphere (TOA) reflectance image. The purple area depicts areas without snow and the yellow area represents areas with snow cover. This information can be used by refuge managers to monitor snow conditions and prepare for the ecological, cultural, and landscape impacts caused by snow.](/sites/default/files/styles/lis/public/2023-05/2023Spring_NCEI_NortheastAlaskaClimate_Websiteimage.jpg.webp?itok=vgp5Y_zU)
Northeast Alaska Climate (2023 Spring) Team: Kristin Anderson (Project Lead), Omeed Arooji, Isabella Chittumuri, Tom Germann Summary: Alaska is experiencing climate change at an unprecedented...
![The InVEST urban flood model produces various outputs, like the runoff retention seen here. The model output was derived from GPM IMERG, land cover, soil type, and curve number data. This image is from the extreme rainfall storm event on August 22, 2017. This image shows where the runoff is being retained in Kansas City, KA. The dark purple represents extremely high runoff retention while the yellow represents low retention with the green and blue representing increasing amounts of retention. The background](/sites/default/files/styles/lis/public/2023-05/2023Spring_PUP_InVESTUrban_WebsiteImage.jpg.webp?itok=RnmwUCoD)
Topic
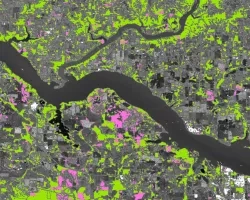
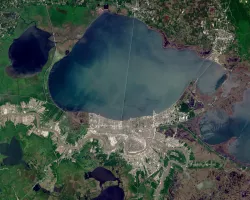
InVEST Urban Development (2023 Spring) Team: Son Do & Jessica Besnier Summary: Urban flooding poses as one of the biggest issues for cities today as...
![Normalized Difference Snow Index (NDSI) processed image using Landsat 8 OLI data from January 2022 and SUOMI-NPP VIIRS snow cover data from January 2019, overlaid on a Landsat 8 RGB image, colorized purple. NSDI is shown in yellow-orange-red and SUOMI-NPP VIIRS is depicted in shades of blue. Snow cover data was used to identify melt events causing high turbidity in Wyoming’s Shoshone River basin. PlanetScope-derived turbidity (May 2019) also highlights the river in green.](/sites/default/files/styles/lis/public/2023-05/2023Spring_PUP_ShoshoneWaterII_WebsiteImage.jpg.webp?itok=YMzk_JP6)
Topic
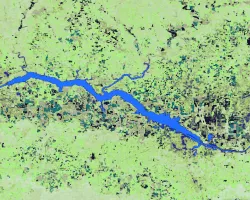
Shoshone River Water Resources II (2023 Spring) Team: Robyn Holmes (Project Lead), Christian Bitzas, Jillian Greene, Isabella St. John Summary: The Willwood Dam, an irrigation...
![Color composite image portraying Wupatki Basin in northwestern Arizona, derived from 2021 LANDSAT 8 OLI/TIRS imagery. This image depicts Pinyon-Juniper Woodlands (PJW), among other vegetation, between the river and mountains in a light green color. Thermal Infrared (TIR) occupies the red band, while the green and blue bands represent the Modified Normalized Difference Water Index (MNDWI) and the Modified Soil-Adjusted Vegetation Index (MSAVI), respectively. The reduced correlation between bands in this comp](/sites/default/files/styles/lis/public/2023-05/2022Fall_GSFC_ArizonaWaterII_WebImage.jpg.webp?itok=yVrQqur8)
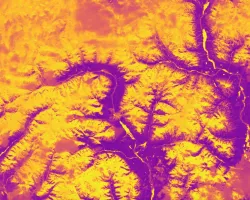
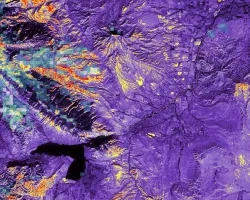
Arizona Water Resources II (Fall 2022) Team: Arina Morozova (Project Lead), Jamal Jeffer, Jessica Birk, Greg Peargin Summary: Pinyon-juniper woodlands (PJW) provide critical and resilient...
![Landsat scene showing New Orleans from April 26, 2000](/sites/default/files/styles/lis/public/2023-07/landsat_new_orleans_nfl_lrg.jpg.webp?itok=OiD8CBfs)
WORKING TOGETHER: A Landscape Analysis to Inform Practical, Innovative, and Beneficial Use of NASA Earth Science Data to Advance Equity and Environmental Justice in the...
Ecological Conservation
![A Landsat 8 Operational Land Imager image of North Carolina on July 14, 2017 that shows agricultural fields](/sites/default/files/styles/lis/public/2023-08/trenton_oli_2017195_lrg.jpg.webp?itok=9VRRxCaE)
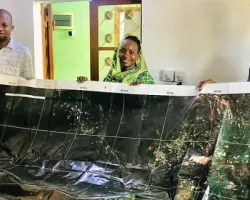
Landscape Analysis of African American farmers in North Carolina and approaches for applying NASA’s data to help prevent their extinction Team: Kibri Everett, PhD (RTI...