Displaying 41 - 50 of 53
![NDBI-processed imagery from a June 2022 Landsat 9 OLI-2 image. This composite image shows the cities of Warren (top left) and Youngstown (bottom right). The areas in white and brown represent the built environment. While areas in green represent land that is not as built-up, such as forest. Built-up areas can indicate where surface run off could occur, resulting in pluvial flooding.](/sites/default/files/styles/lis/public/2023-02/2022Fall_LaRC_YoungstownWarrenDisasters_WebsiteImage.jpg.webp?itok=EkdUM8uk)
Youngstown & Warren Disasters (Fall 2022) Team: Lauren Mahoney (Project Lead), David Henriques, Nada Haddad, Thomas Ferrell Summary: Both pluvial and fluvial flooding events pose...
![Stormwater retention across Wyandotte County, Kansas. NASA GPM IMERG data for September 2020 – August 2021 and NLCD 2019 Land Cover data were used as model inputs for the InVEST Stormwater Retention Model. One model output included a stormwater retention ratio layer where darker purple values indicate poor stormwater retention and increased flood risk. Areas of poor stormwater retention can then be identified as priority regions for Green Infrastructure initiatives in Wyandotte County.](/sites/default/files/styles/lis/public/2023-02/2022Fall_MA_KansasCityDisastersII_WebsiteImage.png.webp?itok=sqRBpysQ)
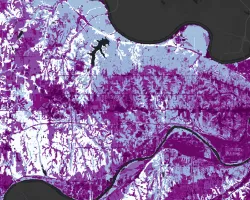
Kansas City Disasters II (Fall 2022) Team: Nora Carmody (Project Lead), Dain Kim, Kameron Lloyd, Ruby Nagelberg Summary: In pluvial flood events, stormwater runoff can...
![Landsat 8 OLI data processed into the median NDVI for 2016-2021 with an overlay showing deforestation that occurred during this time period in the Talladega National Forest. The deforestation layer is derived from Global Forest Watch's forest cover data, which uses the Landsat series, and was calculated as the difference between forested areas in 2016 and forested areas in 2021. Shades of green indicate the density of forest, while red areas indicate areas deforested in 2021.](/sites/default/files/styles/lis/public/2023-02/2022Fall_PUP_SoutheastUSClimate_WebsiteImage.jpeg.webp?itok=9thA-LxI)
Topic
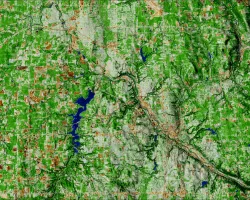
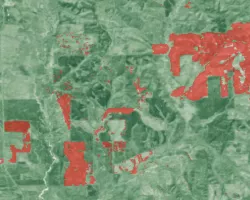
Southeast US Climate (Fall 2022) Team: Heidi Rogers (Project Lead), Mistaya Smith, Maggie Mason, Anish Holla Summary: Deforestation, a significant contributor to carbon emissions, is...
![Daytime land surface temperature for Wichita, Kansas summer 2017-2022, retrieved through Landsat 8 TIRS and Landsat 9 TIRS-2 surface temperature. Located in the northwest corner of the city, this image depicts higher temperatures through dark orange hues in developed areas, and lighter orange hues to blue colors where the temperature is lower. The land surface temperature was utilized to construct a heat vulnerability index for the city, looking into disproportionate impacts on underserved communities.](/sites/default/files/styles/lis/public/2023-02/2022Fall_VEJ_WichitaClimateII_WebsiteImage.png.webp?itok=oO4F6bs4)
Topic
Wichita Climate II (Fall 2022) Team: Ritisha Ghosh (Project Lead), Richard Kirschner, Ria Mukherjee, Raina Monaghan Summary: Wichita, Kansas is experiencing a host of climate...
![Eastern region of the Baa Atoll in the Republic of Maldives. The red indicates areas that would likely be flooded by 2100 according to the most extreme IPCC AR6 Shared Socioeconomic Pathway scenario, as identified through the NASA Sea Level Projection Tool. CoastalDEM, derived from NASA's SRTM sensor, provided elevation data. The base map image was taken in January 2023 by Planet Labs. Shades of yellow and green indicate shallow water and land surfaces. Includes copyrighted material of Planet Labs PBC. All](/sites/default/files/styles/lis/public/2023-04/2023Spring_ARC_MaldivesClimateII_WebsiteImage.jpg.webp?itok=U9qoVeWo)
Topic
Maldives Climate II (Spring 2023) Team: Ben Dahan (Project Lead), Evan Barrett, Tiffany Hsu, Gabriel Halaweh Summary: The Republic of the Maldives is a low-lying...
![Aerial imagery in four tiles to show environmental conditions around prisons.](/sites/default/files/styles/lis/public/2023-09/Mothes%20Project%20Page%20Image.jpg.webp?itok=vHiSACCn)
Topic
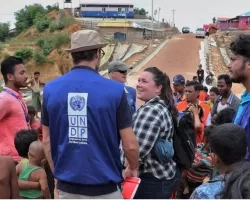
Leveraging Earth science data to heighten awareness of environmental injustices within the U.S. prison system Team: Dr. Carrie Chennault (Colorado State University; Prison Agriculture...
![Map displaying Oklahoma City Heat Vulnerability Index in 2020.](/sites/default/files/styles/lis/public/2023-09/Cheng_2020.png.webp?itok=cV1JbpSh)
Topic
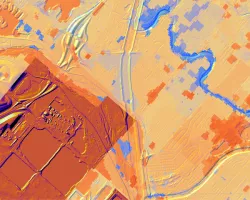
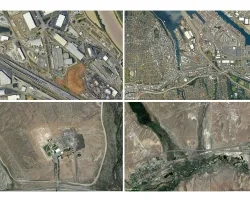
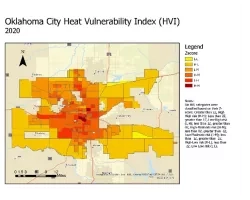
A spatial decision support system for identifying heat vulnerability based on a comprehensive energy budget model and multi-criteria decision analysis in Oklahoma City, OK Team...
DEVELOP
Wildland Fires
Climate
Capacity Building
Ecological Conservation
Health & Air Quality
Water Resources
Applied Sciences
Capacity Building
Disasters
Agriculture