Displaying 291 - 300 of 314
![The image was collected by Landsat 9 on January 26 of 2023 showing Skidaway Island and waterways on the Georgia coast. The data shows areas of healthy vegetation and urban areas using a Normalized Difference Vegetation Index (NDVI). The darker orange represents grass and urban areas. Yellow and purple represents forested and densely vegetated areas. The black represents open water.](/sites/default/files/styles/lis/public/2023-05/2023Spring_GA_GeorgiaDisastersII_WebsiteImage.jpg.webp?itok=zhMhpiSz)
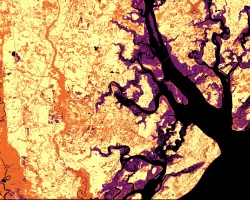
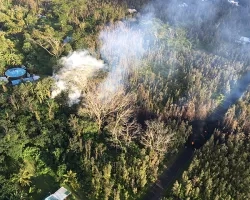
Georgia Disasters II (2023 Spring) Team: Shakirah Rogers (Project Lead), Nathan Tesfayi, Matthew Murray, Clarence Jackson Summary: Heirs property owners are especially vulnerable to natural...
![Soil organic carbon (SOC) is measured here for a depth of 0-5cm from Soil Moisture Active Passive from January 1, 2021 over Peru and Bolivia. SOC is visualized against combined MODIS landcover data for the year 2000 from Aqua and Terra. Shades of lighter pink indicate lower SOC content and darker shades of pink and purple indicate higher SOC content. Conservation International is interested in mapping areas of high SOC content for their conservation efforts.](/sites/default/files/styles/lis/public/2023-05/2023Spring_GSFC_Peru%26BoliviaClimate_WebsiteImage.jpg.webp?itok=RJ-8Cuuo)
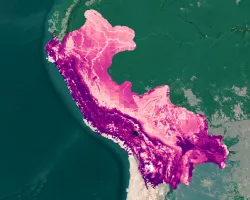
Peru & Bolivia Climate (2023 Spring) Team: Aarti Arora (Project Lead), Aaron Carr, Arina Fuqua, Haydee Portillo Summary: Irrecoverable carbon (IC) reserves contain large stores...
![The green areas show stable forest in NW Alabama classified by both National Land Cover Dataset (2016-2019) and Landscape Change Monitoring System(2016-2021), and the pink areas are areas where forest cover loss was sensed by NLCD, LCMS, LandTrendr (2016-2021), and Global Forest Watch (2016-2021). These datasets and the basemap were made with Landsat 5 Thematic Mapper, Landsat 7 Enhanced Thematic Mapper Plus, and Landsat 8 Operational Land Imager.](/sites/default/files/styles/lis/public/2023-05/2023Spring_MSFC_SoutheastUSClimateII_WebsiteImage.jpg.webp?itok=3mAADCnc)
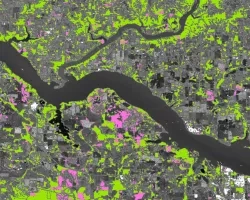
Southeast US Climate II (2023 Spring) Team: Cassie Ferrante (Project Lead), Katherine Scott, James Karroum, Cate Lull Summary: The balancing of atmospheric CO2 sources and...
![Normalized Difference Snow Index (NDSI) Image calculated from a May 2021 Landsat 8 top-of-atmosphere (TOA) reflectance image. The purple area depicts areas without snow and the yellow area represents areas with snow cover. This information can be used by refuge managers to monitor snow conditions and prepare for the ecological, cultural, and landscape impacts caused by snow.](/sites/default/files/styles/lis/public/2023-05/2023Spring_NCEI_NortheastAlaskaClimate_Websiteimage.jpg.webp?itok=vgp5Y_zU)
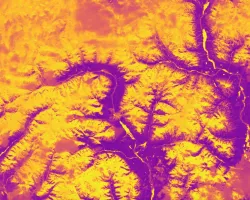
Northeast Alaska Climate (2023 Spring) Team: Kristin Anderson (Project Lead), Omeed Arooji, Isabella Chittumuri, Tom Germann Summary: Alaska is experiencing climate change at an unprecedented...
![Aerial imagery in four tiles to show environmental conditions around prisons.](/sites/default/files/styles/lis/public/2023-09/Mothes%20Project%20Page%20Image.jpg.webp?itok=vHiSACCn)
Topic
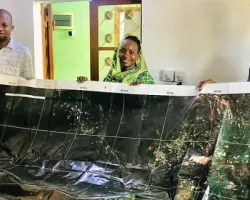
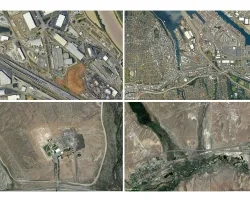
Leveraging Earth science data to heighten awareness of environmental injustices within the U.S. prison system Team: Dr. Carrie Chennault (Colorado State University; Prison Agriculture...
![Map displaying Oklahoma City Heat Vulnerability Index in 2020.](/sites/default/files/styles/lis/public/2023-09/Cheng_2020.png.webp?itok=cV1JbpSh)
Topic
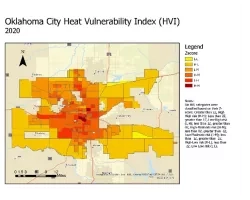
A spatial decision support system for identifying heat vulnerability based on a comprehensive energy budget model and multi-criteria decision analysis in Oklahoma City, OK Team...
DEVELOP
Wildland Fires
Climate
Capacity Building
Ecological Conservation
Health & Air Quality
Water Resources