Displaying 1 - 9 of 9
![A remote sensing scene of wildfire extent in the Black Hills in South Dakota](/sites/default/files/styles/lis/public/2022-11/2022Sum_CO_BlackHillsWildfire_WebsiteImage.jpg.webp?itok=3SvKdSkf)
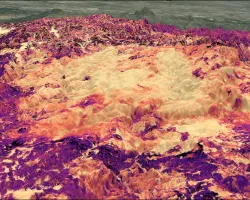
Black Hills Wildfires (Summer 2022) Team: Casey Menick (Project Lead), Haley Stuckmeyer, Heidi Rogers, Yeshey Seldon Summary: The 2000 Jasper Fire in the Black Hills...
![Median June composite of daily evapotranspiration from ECOSTRESS before the start of the Bootleg Fire on July 6th, 2021. Evapotranspiration is shown in millimeters per day across Klamath and Lake counties in Oregon, with dark blue indicating areas with higher evapotranspiration and light tan indicating lower evapotranspiration. Evapotranspiration is an indicator of vegetation moisture and can aid wildfire modeling by locating areas undergoing water-stress and susceptible to fire.](/sites/default/files/styles/lis/public/2022-12/2022Sum_JPL_WashingtonWildfires_WebsiteImage.jpg.webp?itok=X8MZrq7U)
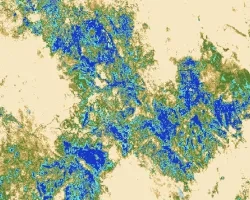
Oregon Wildfires (Summer 2022) Team: Brenna Hatch (Project Lead), Kenya Creer, Jennifer Sobolewski, Nicole Roberts Summary: Wildfire season in the western USA is starting earlier...
![Median daily evapotranspiration (ET) from September 2021 to May 2022 calculated from ISS ECOSTRESS data. The image covers the agricultural fields adjacent to the Maipo River, Chile and depicts water stress. The color scale ranges from red (low ET) to blue (high ET), with higher ET observed over irrigated agricultural fields. ET is used for estimating crop irrigation requirements. This data will inform irrigation management practices and help alleviate water scarcity within the area. ](/sites/default/files/styles/lis/public/2023-01/2022Sum_ID_IdahoWildfires_WebsiteImage.jpg.webp?itok=MgV2NTHF)
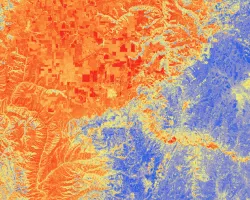
IDAHO WILDFIRES (Summer 2022) Team: Ford Freyberg (Project Lead), Carson Schuetze, Jessica Hiatt, Brenner Burkholder Summary: Escalating severity and frequency of drought and wildfire call...
Idaho Wildfires II (Fall 2022) Team: Talissa Cota (Project Lead), Dana Drinkall, Ryan Healey, Tyler Morvant Summary: The western United States has experienced twenty years...
![Normalized burn ratio calculated from Landsat 8 imagery both preceding and following the Bootleg Wildfire in the Beatty, Oregon area. The fire burned from July 6th to August 15th during the Summer of 2021 and its footprint shows varying levels of burn severity. Dark purple areas indicate highest severity, shades of red and orange indicate moderate severity, and yellow areas indicate low burn severity. Black areas depict unburned areas.](/sites/default/files/styles/lis/public/2023-02/2022Fall_NC_Gatlinburg%26BeattyWildfires_WebsiteImage.jpeg.webp?itok=_JPQMuhI)
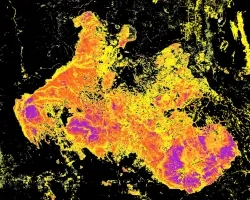
Gatlinburg & Beatty Wildfires (Fall 2022) Team: Kelli Roberts (Project Lead), William Hadley, Daniel Littleton Summary: Wildfire potential monitoring, which is increasingly vital under climate...
![Evaporative Stress Index (ESI) processed imagery from ECOSTRESS data, captured on October 4, 2021, for Marin County in the San Francisco Bay Area. Darker regions have a higher ESI value, signifying moister conditions, while lighter regions are drier. Vegetative moisture has a significant impact on fire severity and understanding localized moisture conditions can inform the county’s fire suppression efforts. Land outside of Marin County shows NDVI processed imagery derived from Sentinal-2A data.](/sites/default/files/styles/lis/public/2023-05/2023Spring_ARC_MarinCountyWildfires_WebsiteImage.png.webp?itok=FQS2THAF)
Topic
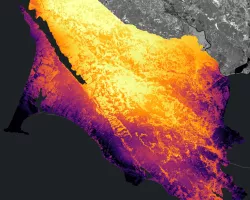
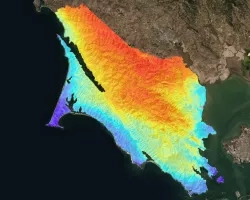
Marin County Wildland Fires (2023 Spring) Team: Suhani Dalal (Project Lead), Katera Lee, Chandler Ross, Gabriel Rosenstein Summary: Heightened occurrence of severe wildfires in the...
![Canopy cover in the greater Ben Delatour Scout Ranch region from a 2013 NAIP Image with a slope and aspect layer derived from a 10-meter digital elevation model (DEM). This image illustrates how elevation-derived variables are used to inform classification models to map canopy cover. Canopy is displayed as red, and the map illustrates that there are higher concentrations of canopy on northern aspects- illustrating the nature of tree density in our study region. ](/sites/default/files/styles/lis/public/2023-05/2023Spring_CO_FrontRangeWildlandFires_WebsiteImage.png.webp?itok=MHr1Zy9O)
Topic
Front Range Wildland Fires (2023 Spring) Team: Nora Carmody (Project Lead), Lillian Gordon, Nathan Teich, Josh Virene Summary: Over the last several decades, wildfire frequency...
DEVELOP
Wildland Fires
Climate
Capacity Building
Ecological Conservation
Health & Air Quality
Water Resources
![This is a visualization of ECOSTRESS’ Evaporative Stress Index in Marin County, CA. The data is an average of summer months from 2018 – 2022. Scores closer to 0, or red/orange areas, indicate plants are in stress, meaning they are not meeting their potential evapotranspiration, while scores closer to 1, or blue areas, indicate plants are thriving and closer to reaching potential evapotranspiration.](/sites/default/files/styles/lis/public/2023-10/2023Sum_ARC_MarinCountyWildfiresII_WebsiteImage.jpg.webp?itok=pDMrUqyL)
Topic
Marin County Wildland Fires II (2023 Summer) Team: Harrison Raine (Project Lead), Katherine Scott, Nikitha Shivakumar, Tiffany Mar, Anai Tene Summary: A future of increased...