Displaying 1 - 4 of 4
![Map displaying Oklahoma City Heat Vulnerability Index in 2020.](/sites/default/files/styles/lis/public/2023-09/Cheng_2020.png.webp?itok=cV1JbpSh)
Topic
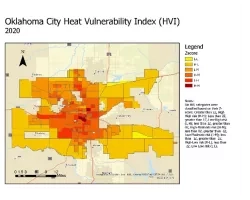
A spatial decision support system for identifying heat vulnerability based on a comprehensive energy budget model and multi-criteria decision analysis in Oklahoma City, OK Team...
![Land surface temperatures for study area (Cuyahoga County, Ohio), as derived from Landsat. Black lines show boundaries of census blocks. Blue dots show the greenspaces and census blocks where the on the ground tree surveys have been conducted, with one census block highlighted as an inset. Image Credit: Rob Moore (Cleveland State).](/sites/default/files/styles/lis/public/2024-05/Mueller%20Project%20Page%20Image_0.png.webp?itok=nYl76fWk)
Topic
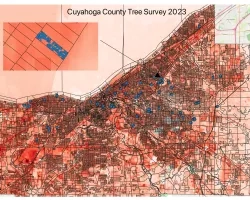
Team: Kevin Mueller (Cleveland State University), Brice Grunert (Cleveland State University), Thomas Hilde (Cleveland State University), Kaiguang Zhao (Ohio State University), Daniel Meaney (Cuyahoga County...
![Map of SEMCOG study area showing regions identified by SEMCOG as areas of persistent poverty, overlaid on a map of percent impervious surface for the seven county region.](/sites/default/files/styles/lis/public/2024-07/Miller%20Project%20Page%20Image.png.webp?itok=5Y_DbaH0)
Topic
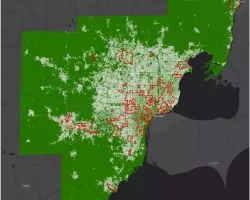
Team: Mary Miller (Michigan Technological University), Michael Battaglia (Michigan Technological University), Laura Bourgeau-Chavez (Michigan Technological University), David Watkins (Michigan Technological University), Jessica Alger (Michigan Technological...