Displaying 41 - 50 of 59
![Aerosol Optical Depth for a dust event on July 26th-27th, 2021, calculated with the MAIAC algorithm from Terra and Aqua MODIS satellite data. Great Salt Lake surface area, in blue, was derived from JRC Yearly Water Classification History and processed imagery from Landsat 5, 7, and 8. The map depicts regions that are most impacted by dust surrounding the Great Salt Lake. Red and Yellow represent high dust levels within Northern Utah.](/sites/default/files/styles/lis/public/2023-05/2023Spring_VEJ_GreatSaltLakeHAQ_WebImage.jpg.webp?itok=T6r5Pogy)
Topic
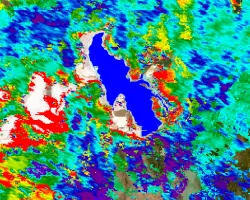
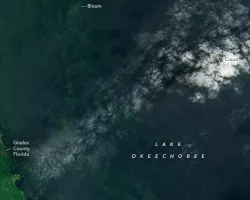
Great Salt Lake Health and Air Quality (2023 Spring) Team: Piper Christian (Project Lead), Fiona Summers, Yoana Vargas Magana, Andrea Delgado Summary: Water flow into...
![Aerosol optical depth concentration from MODIS, captured on August 16, 2020, during the fire season. Dark purples hues indicate normal atmospheric conditions, while orange and yellow hues show high concentrations of aerosols, suggesting the presence of smoke and particulate matter following a fire event. MODIS aerosol optical depth can be used as a proxy for PM2.5 pollution, increasing decision makers’ capacities to monitor and address the negative effects of wildfire smoke plumes on residential areas.](/sites/default/files/styles/lis/public/2023-05/2023Spring_LaRC_ColoradoSpringsHAQ_WebImage.png.webp?itok=rNvnSpEC)
Topic
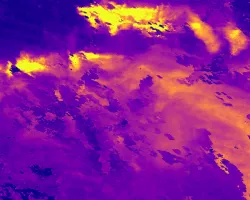
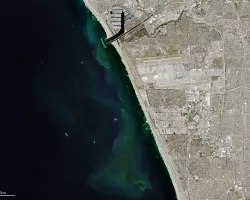
Colorado Springs Health and Air Quality (2023 Spring) Team: Olivia Etherton, Jeanette Moritz, Joshua Stokes, Ephrata Yohannes Summary: The City of Colorado Springs, situated in...
![Aerial imagery in four tiles to show environmental conditions around prisons.](/sites/default/files/styles/lis/public/2023-09/Mothes%20Project%20Page%20Image.jpg.webp?itok=vHiSACCn)
Topic
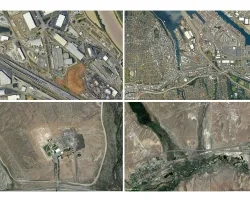
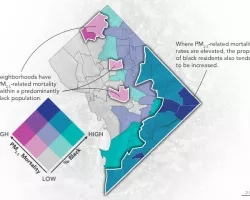
Leveraging Earth science data to heighten awareness of environmental injustices within the U.S. prison system Team: Dr. Carrie Chennault (Colorado State University; Prison Agriculture...
![Map displaying Oklahoma City Heat Vulnerability Index in 2020.](/sites/default/files/styles/lis/public/2023-09/Cheng_2020.png.webp?itok=cV1JbpSh)
Topic
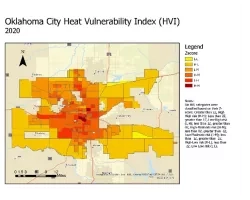
A spatial decision support system for identifying heat vulnerability based on a comprehensive energy budget model and multi-criteria decision analysis in Oklahoma City, OK Team...
DEVELOP
Wildland Fires
Climate
Capacity Building
Ecological Conservation
Health & Air Quality
Water Resources
![Kernel density distributions of census tract-level cooling degree days from May through September 2013 in Fahrenheit by race/ethnicity across the climate regions of New York State. Cooling degree days are calculated with a threshold of 65°. White = Non-Hispanic White, Hispanic = Hispanic/Latino of any race, Black = Non-Hispanic Black, Asian = Non-Hispanic Asian.](/sites/default/files/styles/lis/public/2023-10/Carrion%20Project%20Page%20Image.png.webp?itok=yyxxauFg)
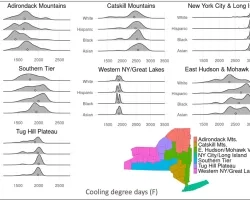
Identifying temperature disparities, energy insecurity, and social vulnerability for energy justice in New York State Team: Daniel Carrión (Yale School of Public Health), Anna Stouffer...