Image
NASA
NASA
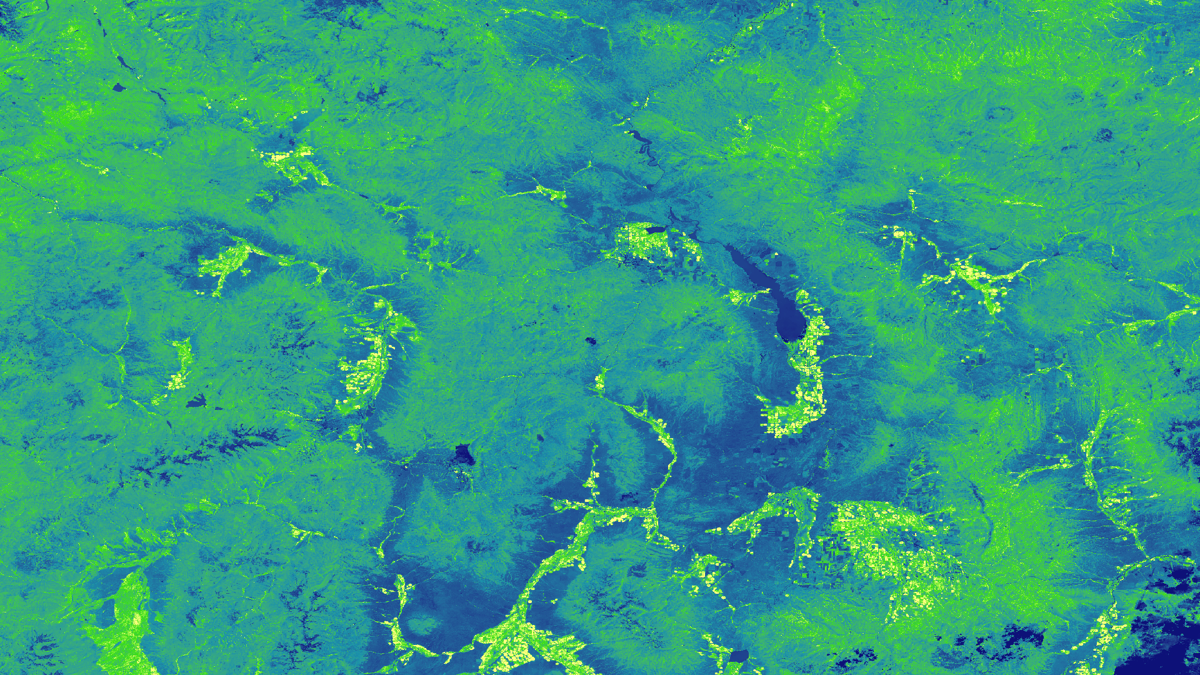
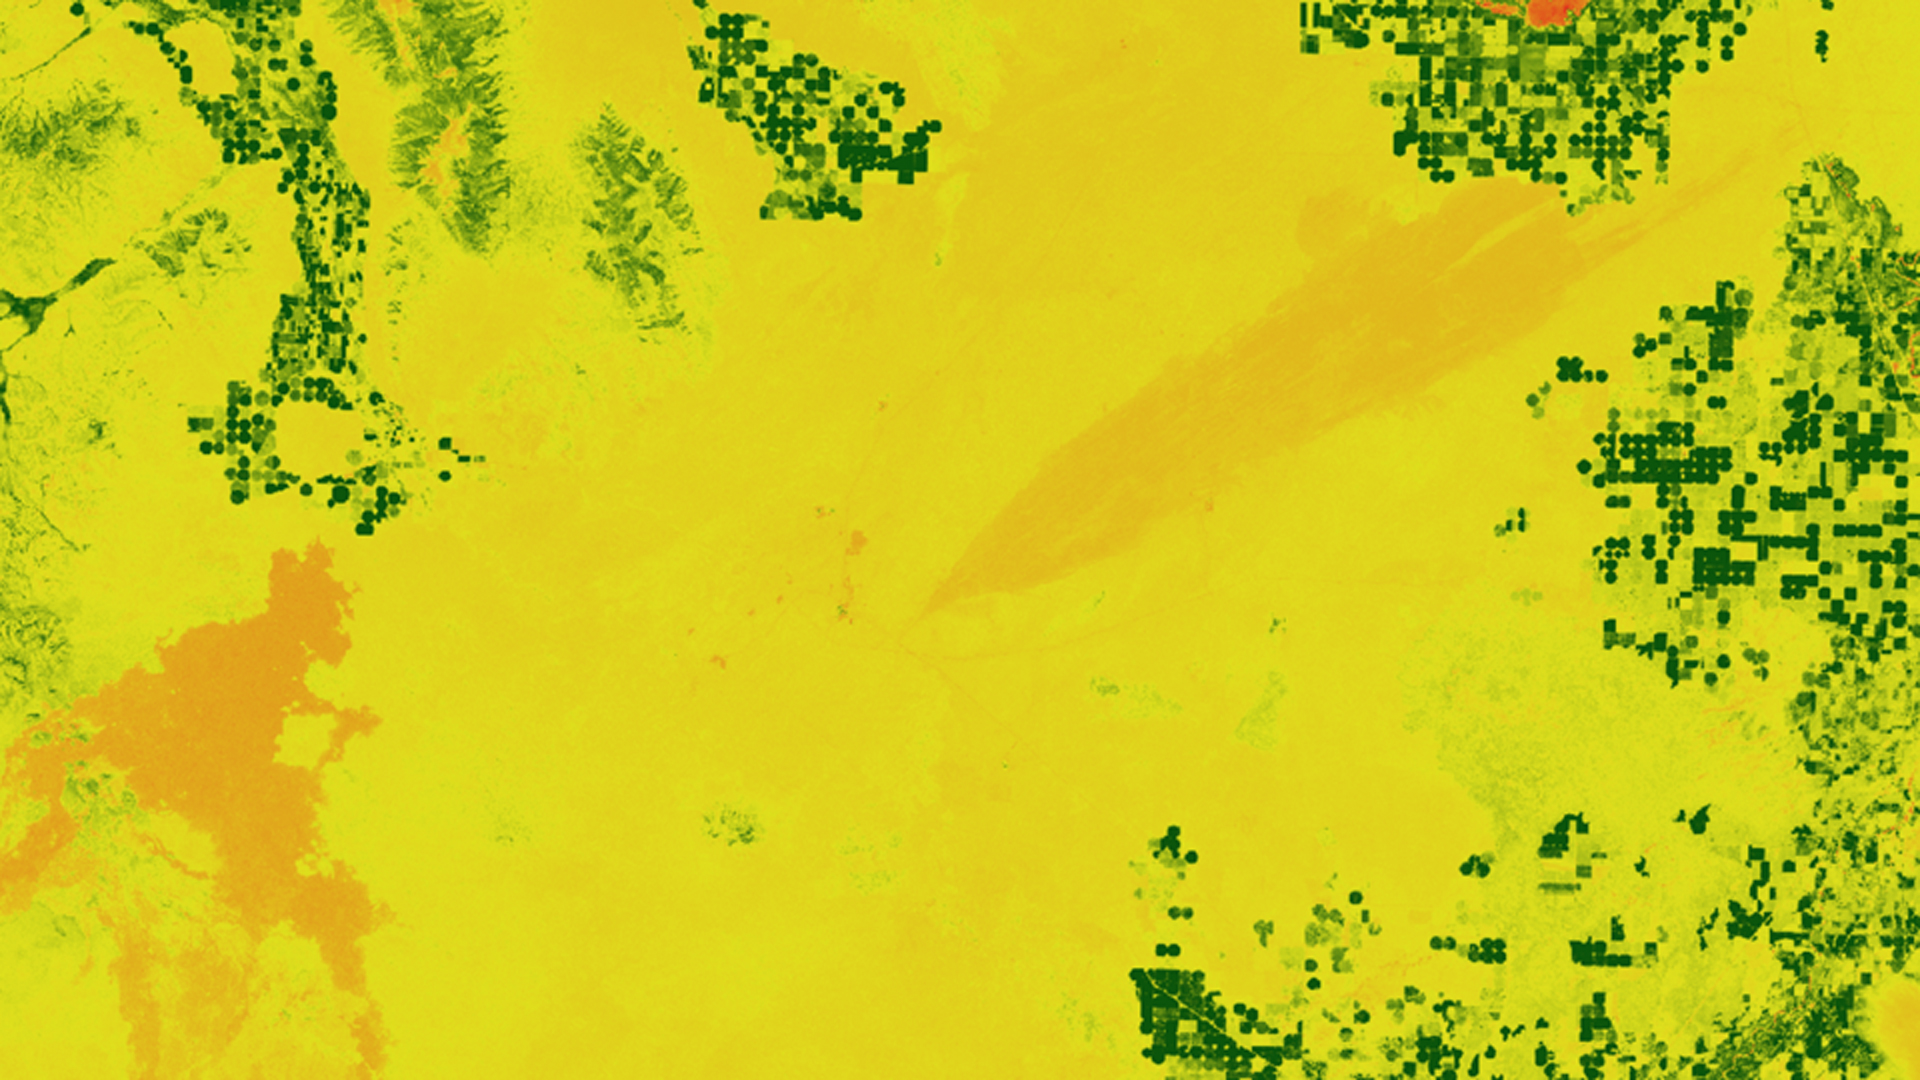
Tasseled cap greenness transformation derived from Landsat 8 imagery over lodgepole pine forest in the Intermountain West study area
Completed Projects
Annemarie Peacock
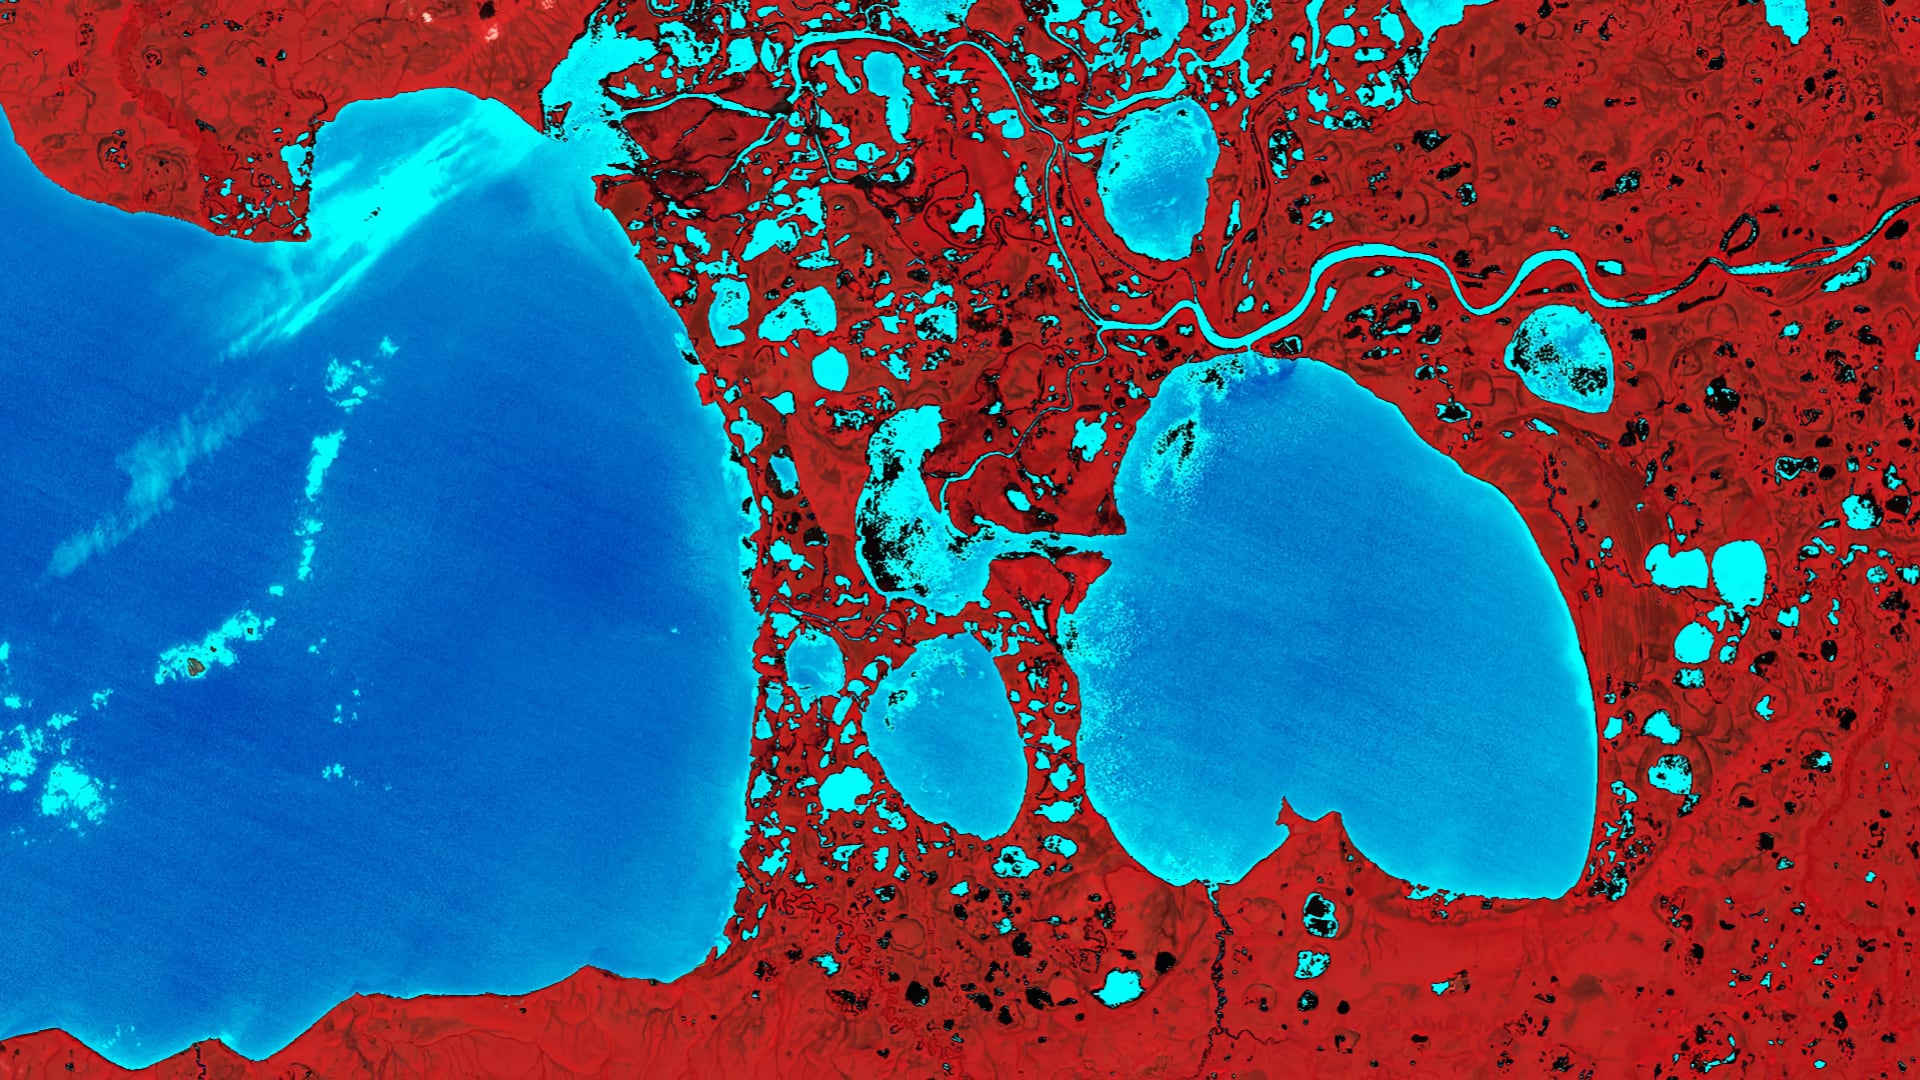
Alaska’s wetlands cover approximately one third of the state and provide a multitude of ecosystem services, including nutrient retention, water purification, and provision of habitat for fish, wildlife, and vegetation. The temporal variation in wetland inundation affects these ecosystem functions, and for effective wetland policy...
Erika Munshi
As flood events in the United States grow in frequency and intensity, the uses of applied remote sensing analyses are increasingly necessary for effective flood monitoring and warning systems. The NASA DEVELOP Ellicott City Disasters III project investigated the use...
M. Colin Marvin
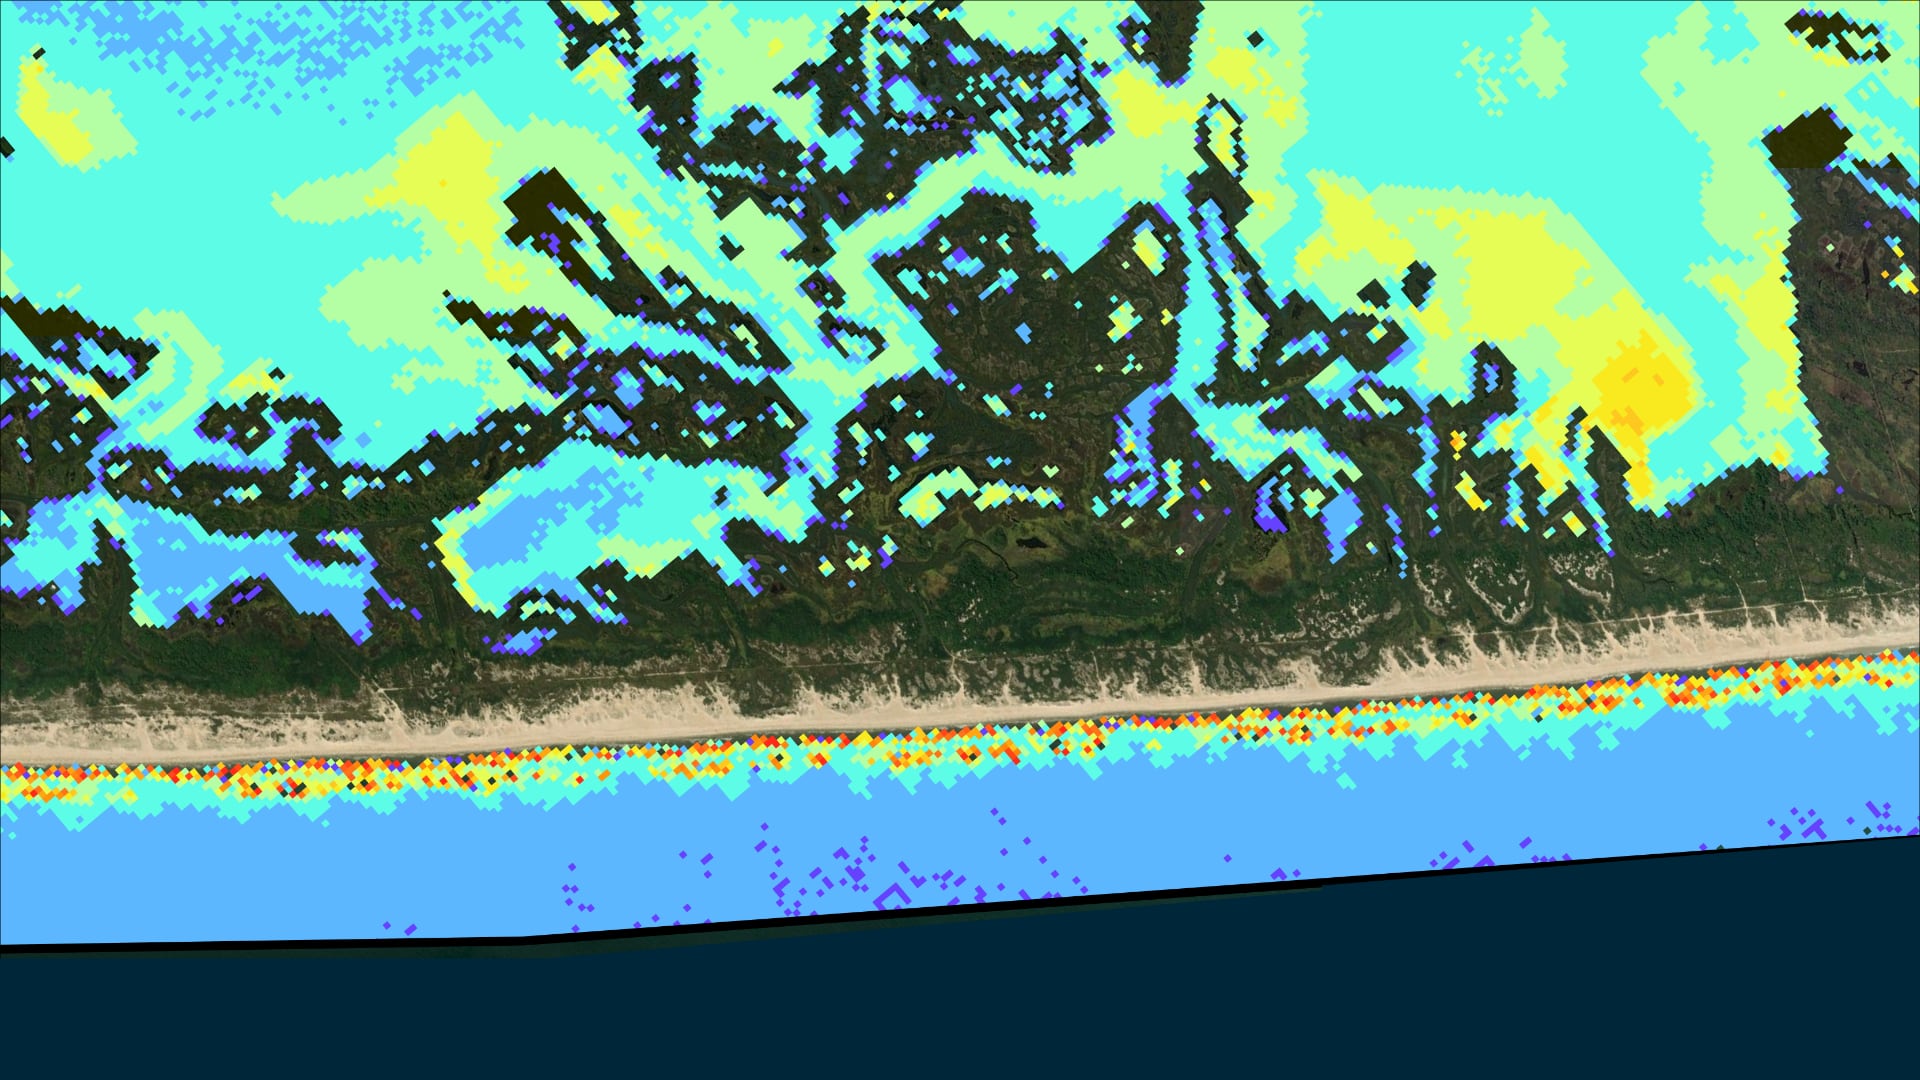
Assateague Island is located off the coast of Maryland and Virginia and serves as a home to sensitive species and habitats. However, infrastructure development disrupted the natural sediment transport processes of the barrier island, which accelerated erosion of the island’s...
Brandon Crawford
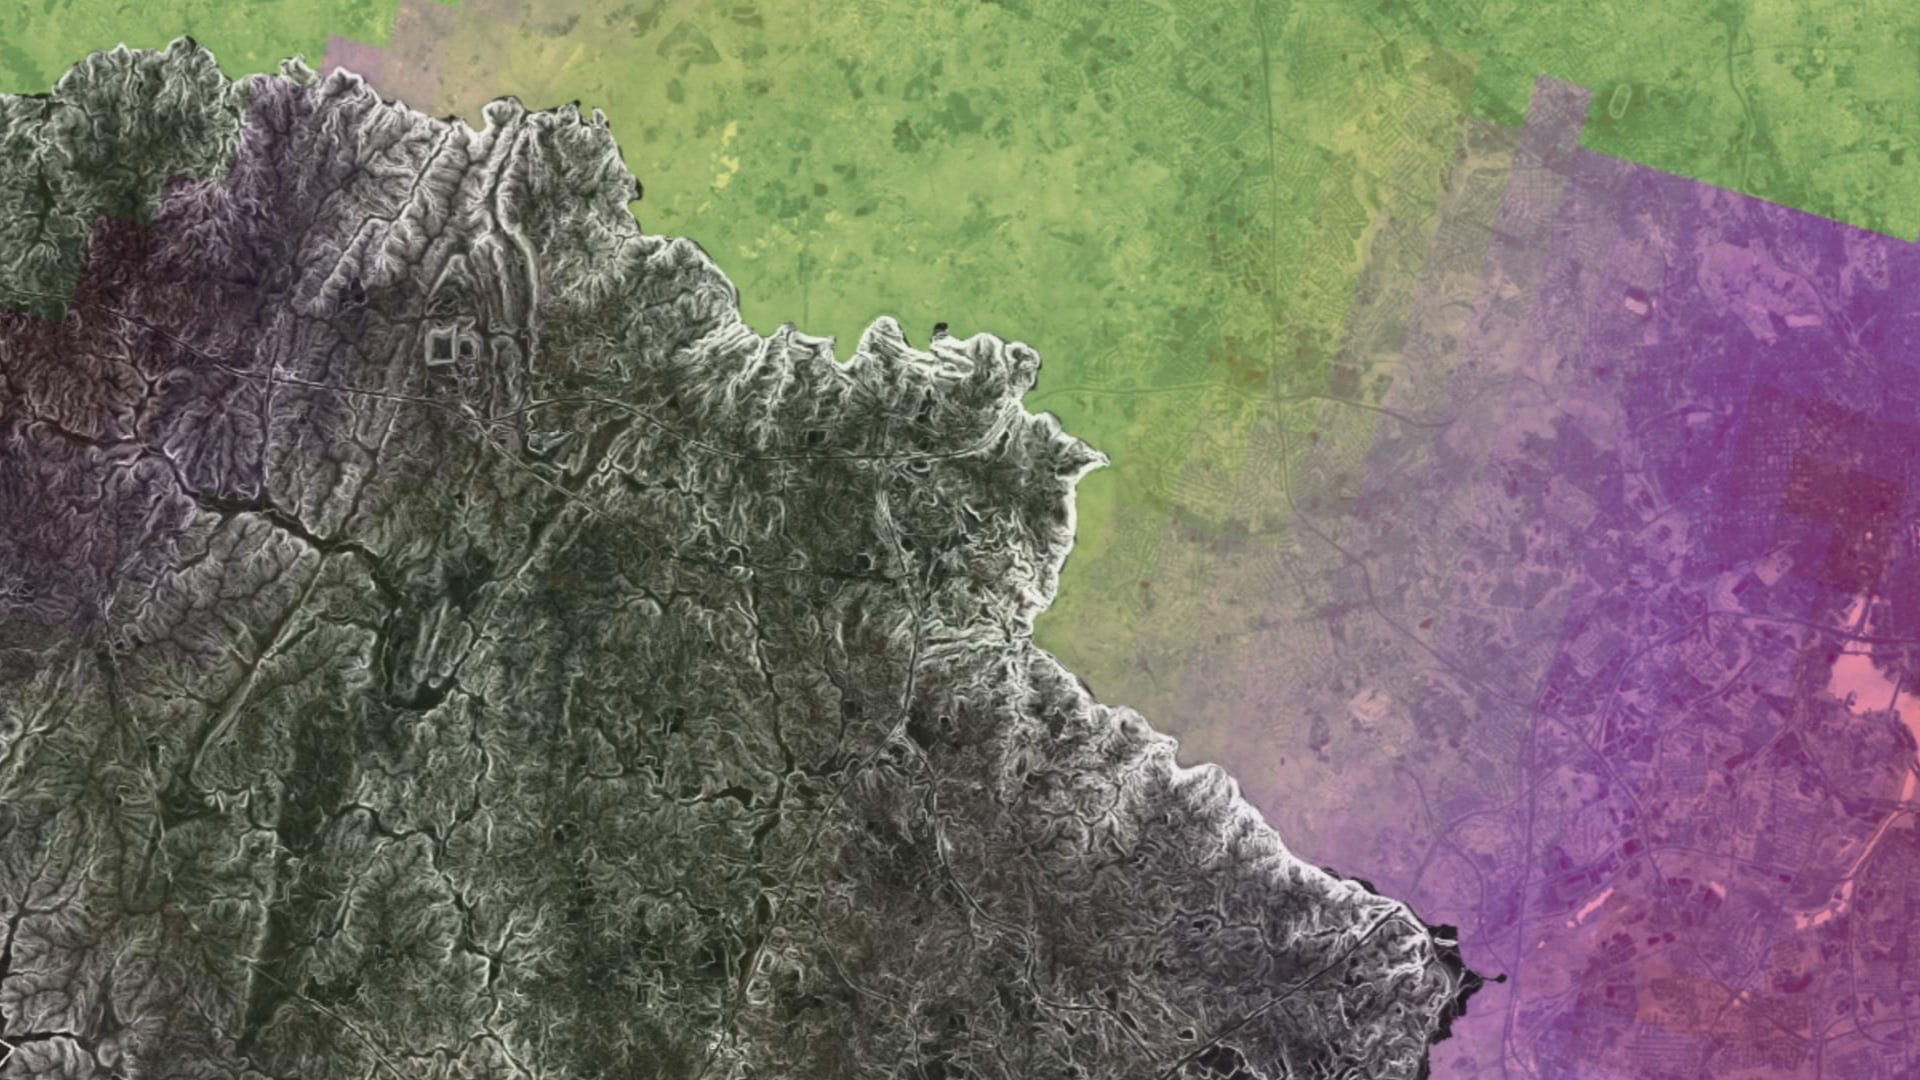
Wildfire is a key driver of ecosystem progression in the sagebrush steppe-dominated landscapes of southern Idaho. Fire-related disturbances can facilitate the propagation of invasive vegetation, threatening native wildlife and shaping a fire regime that is increasingly hazardous to adjacent urban development. Applying the methodology created...
Roger Ly
The Panama Canal Watershed (PCW) is a major socioeconomic resource. The PCW provides potable water to surrounding cities and ensures the Panama Canal remains fully operational throughout each year. Over one million residents in Panama City, Colón, and San Miguelito...
Deki Namgyal

Bhutan is vulnerable to climate fluctuations that can affect vegetation phenology patterns. Changes in the climate have raised concerns from local farmers about altered growing seasons. In response, the DEVELOP team assessed annual vegetation phenology trends across Bhutan from 1981-2014 by comparing vegetation phenology-derived...
Kinley Dorji

Himalayan countries, including Bhutan, have become vulnerable to warming trends which result in increasing temperature and variable rainfall and snowfall. By combining phenological and meteorological data, Earth observation platforms and sensors were used to assess trends in precipitation, temperature, and...
Trista Brophy
Riley County, Kansas, has observed increased levels of flooding, potentially due to changes in land use/land cover (LULC) and seasonal vegetation variation. This study contrasts two methods of generating runoff curve numbers (CN) from 2006-2020. (1) The traditional Soil Conservation...
Rya Inman

Hemlock woolly adelgid (HWA; Adelges tsugae) is an invasive species that threatens eastern hemlock (Tsuga canadensis) in US forests. Eastern hemlock has a greater capacity to store carbon, regulate stream temperatures, and provide habitat for wildlife compared to sympatric tree species. The New...
Ryan Lam

Early harvest information helps drive the national budget in Argentina, providing valuable planning information to identify potential food-insecure regions, anticipate transportation and storage demands, predict price fluctuations, and project commodity trends. However, crop yield estimates are currently subjective, based on...