Image
NASA
NASA
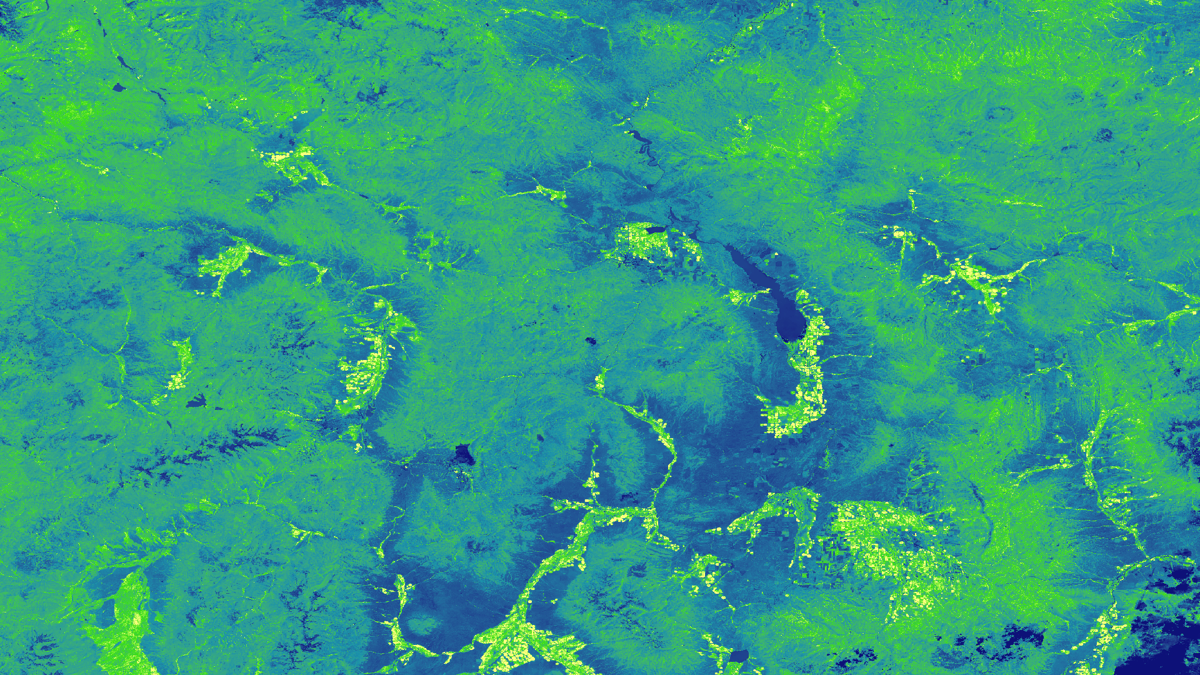
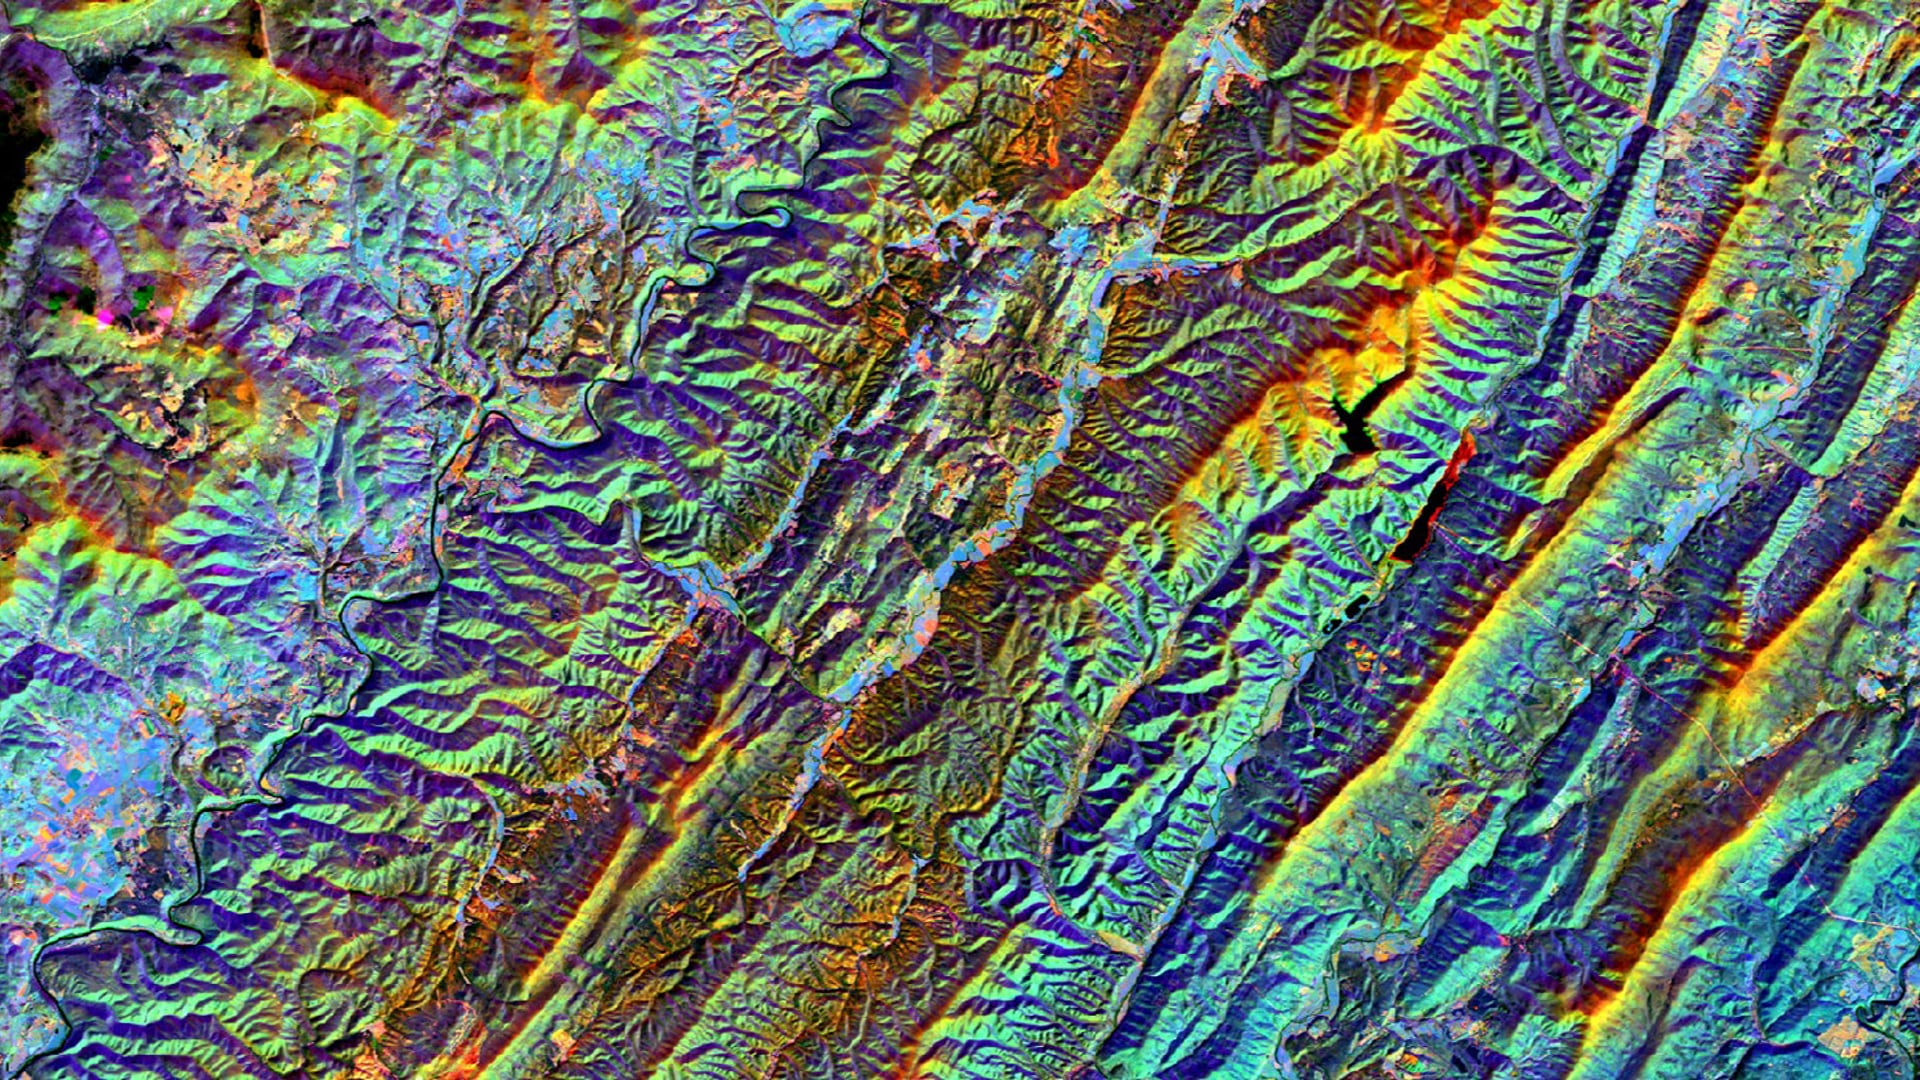
Tasseled cap greenness transformation derived from Landsat 8 imagery over lodgepole pine forest in the Intermountain West study area
Completed Projects
Emily Kinkle
Dissolved oxygen levels have been declining in the Puget Sound since 2000 due to eutrophication, resulting in harmful algal bloom (HAB) events, which negatively impact water quality and wildlife in the area. Therefore, analyzing and identifying eutrophication and hypoxic events is important for water quality...
Hikari Murayama
The Osa Peninsula, located in the southern region of Costa Rica’s Pacific coast, is one of the most biologically diverse places on Earth. NASA DEVELOP partnered with Osa Conservation to analyze the impact of human activity on vital water resources, with a focus on determining...
Christine Evans
Alaska’s wildfire season has progressively increased in duration and intensity over the last decade, leaving forested areas subject to devastating destruction. These increases in wildfire occurrence are due to gradual rises in land surface temperature, decreases in precipitation levels, and...
Marco Vallejos

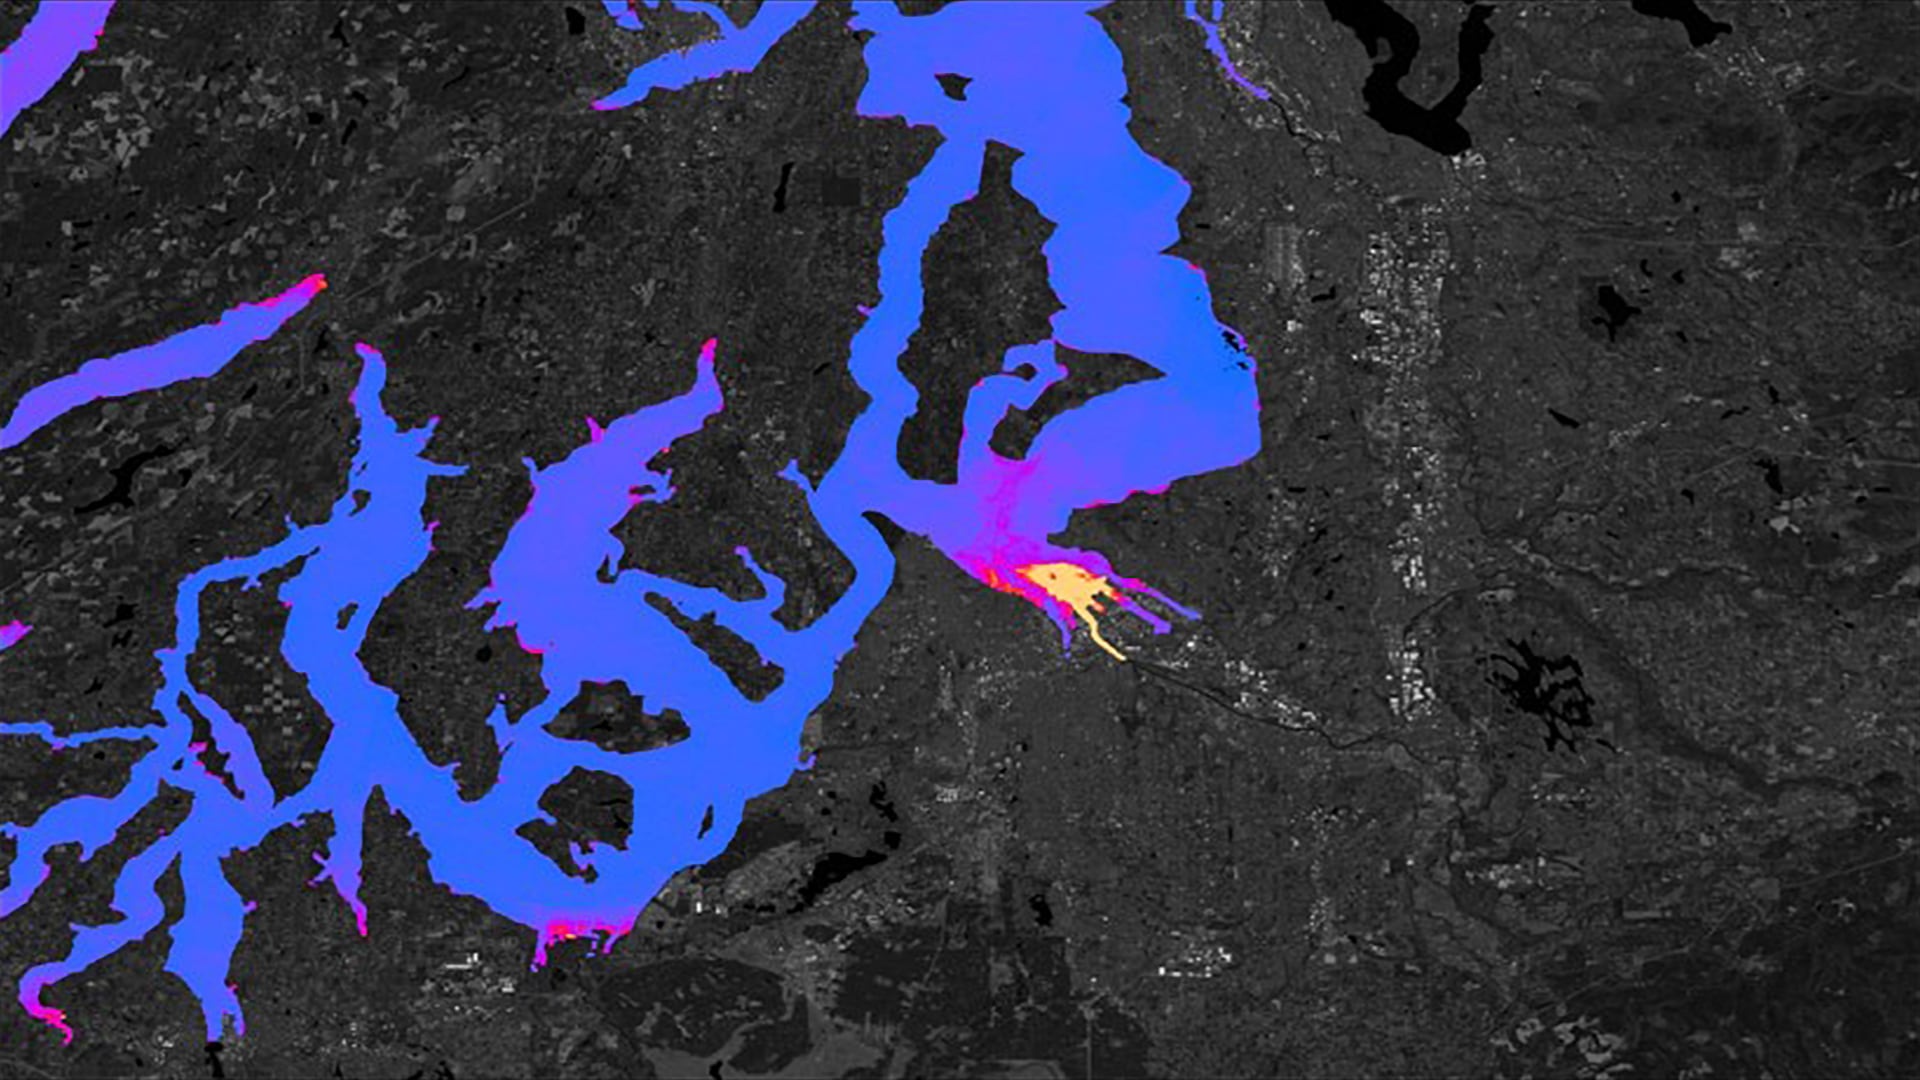
Tonlé Sap Lake, the largest lake in Southeast Asia, is a critical source of fish and freshwater resources for the region. The health of this freshwater system is under pressure from accelerating dam construction, intensifying agriculture, deforestation, and changing climate patterns...
Marshall Worsham
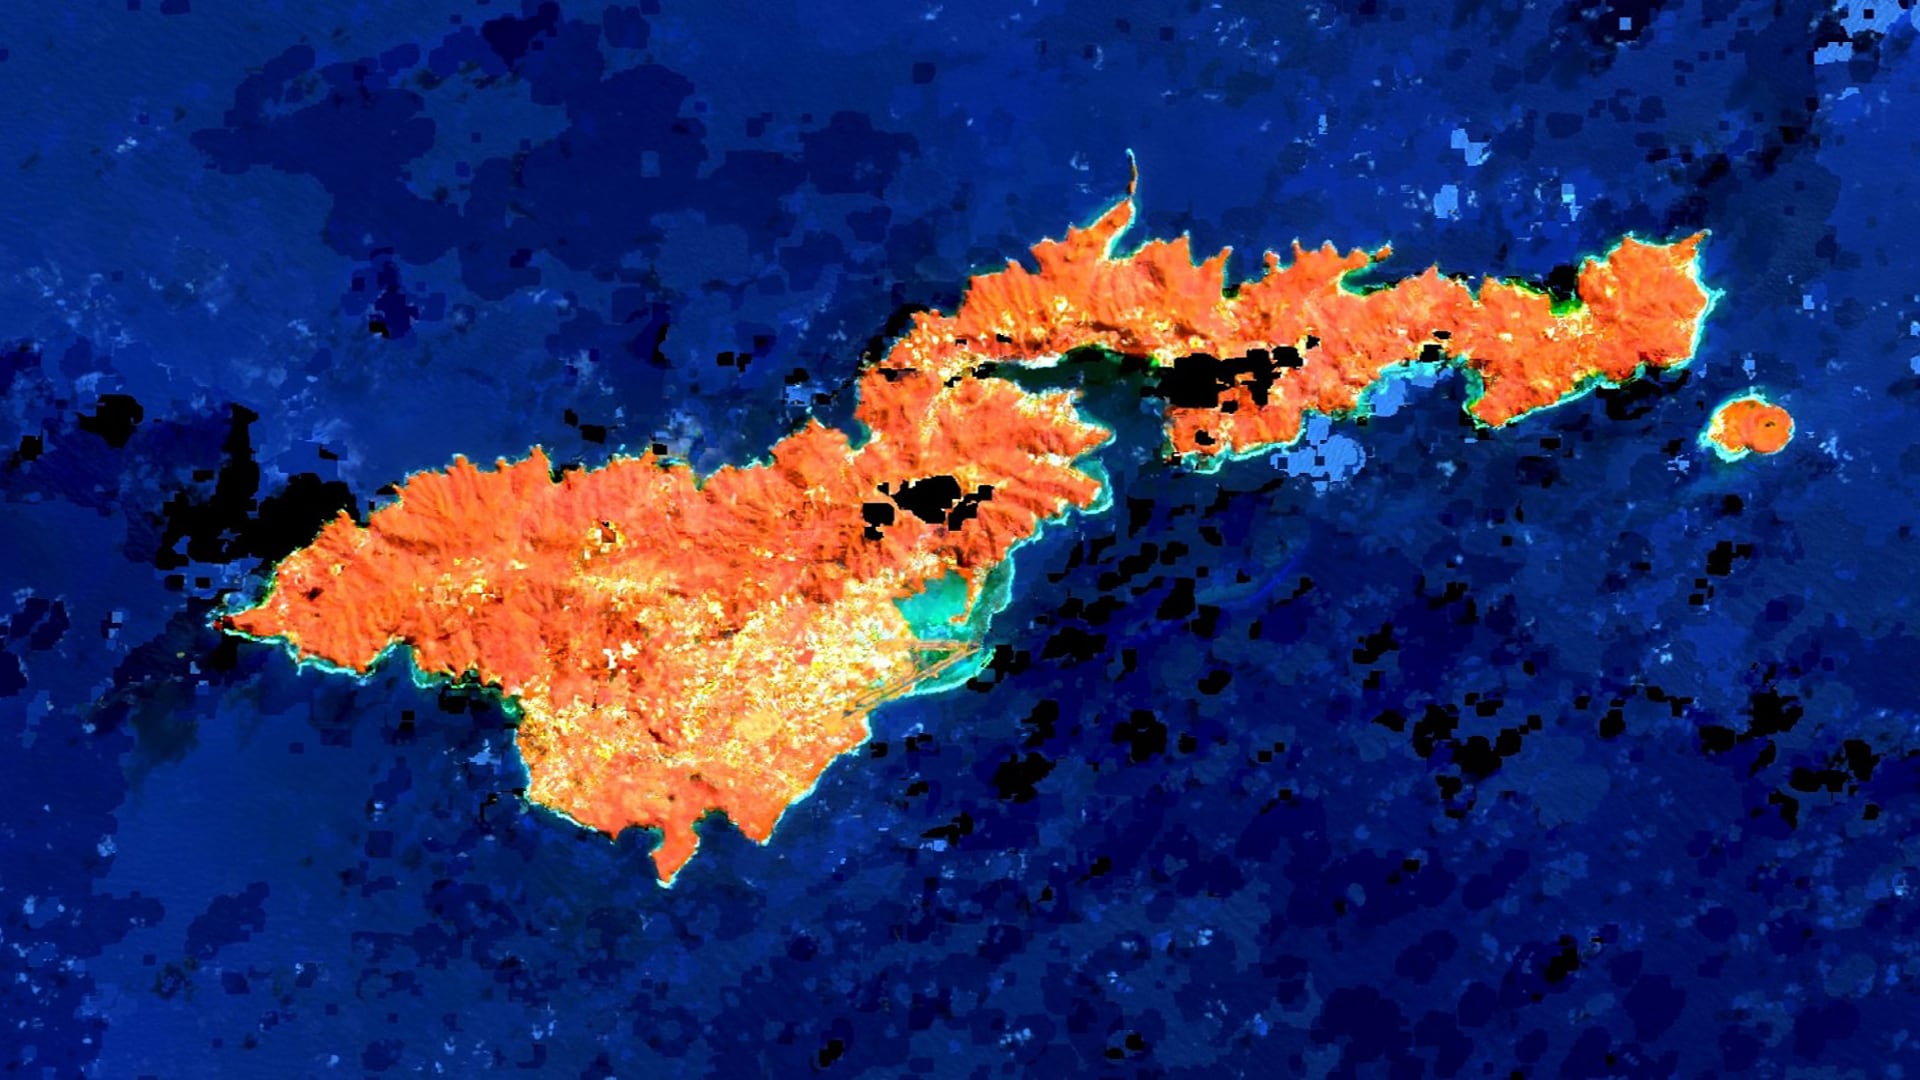
For at least the past two decades, the coral reefs and coastal ecosystems of the American Samoan island of Tutuila have experienced deteriorating water quality. Increased levels of sedimentation, nutrients, and other land-based sources of pollution (LBSP) have negatively impacted...
Shelby Ingram
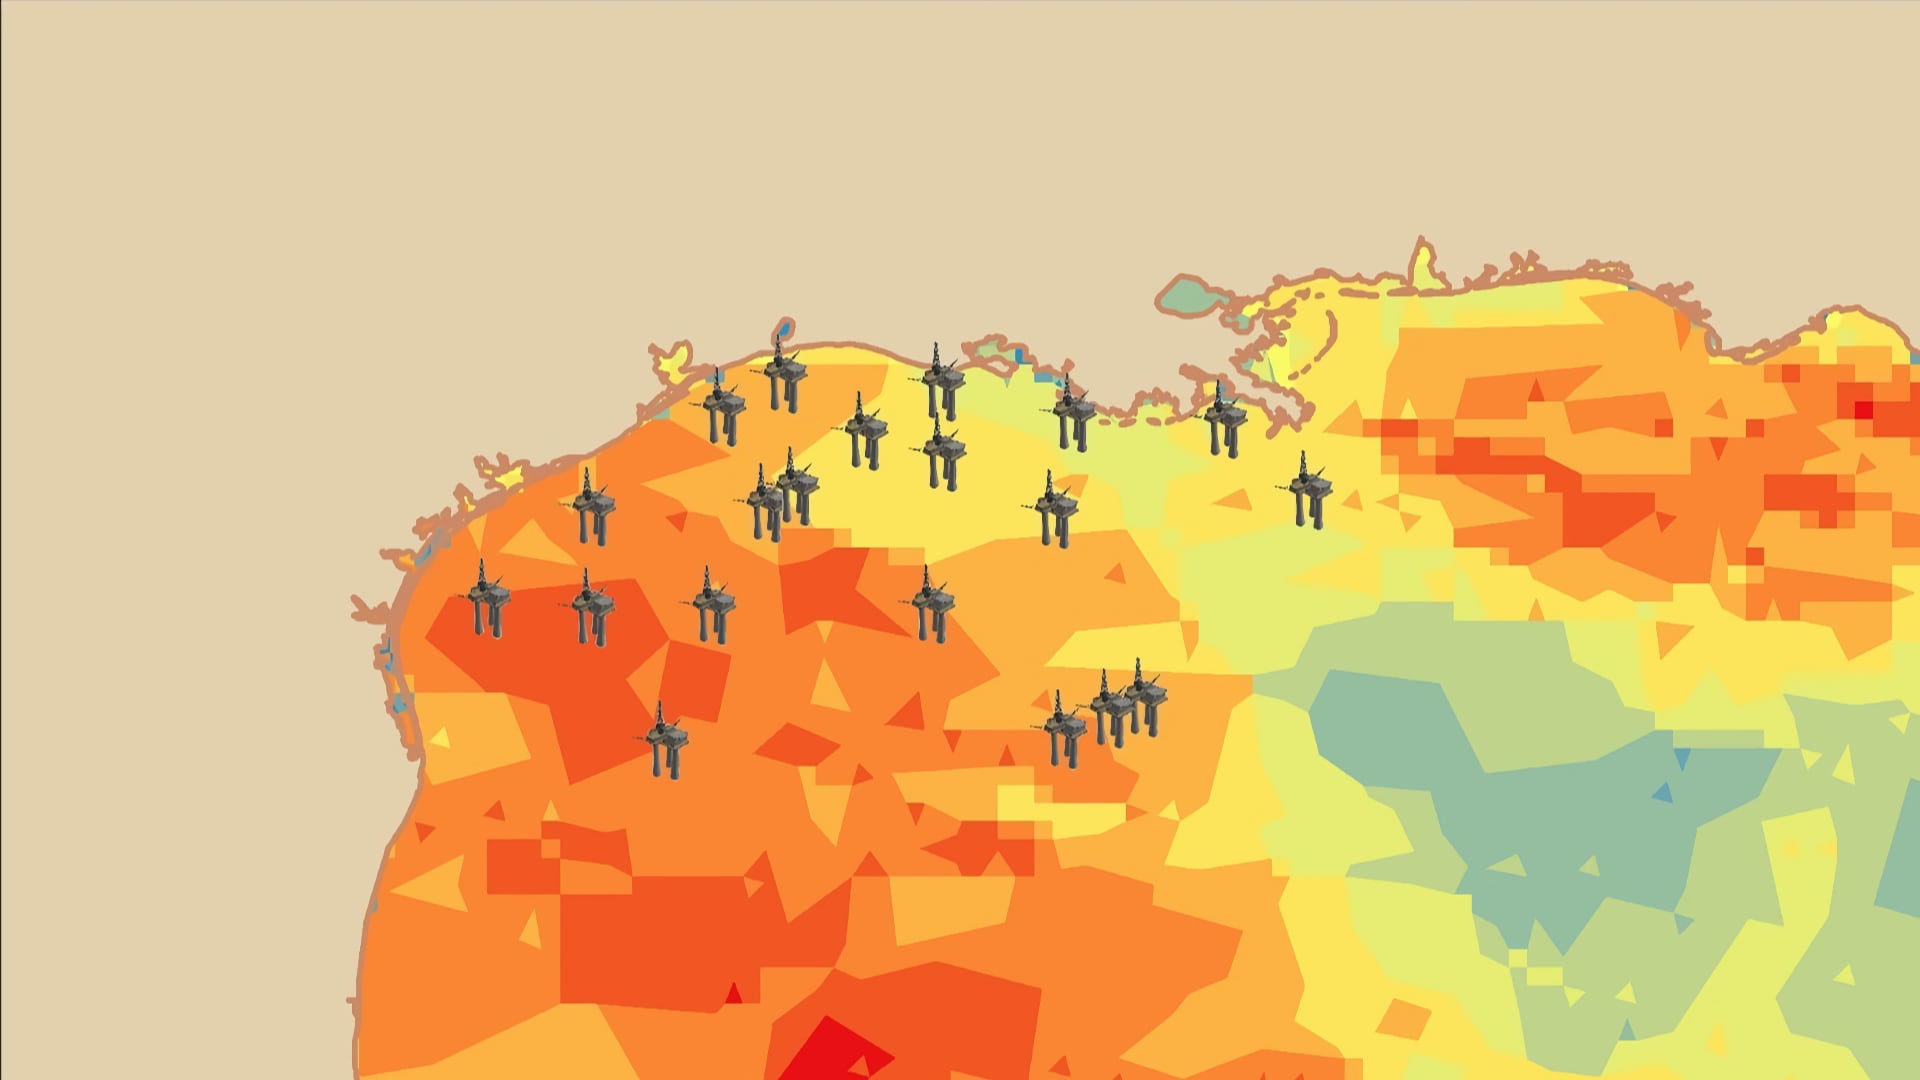
In recent years, the Gulf of México (GoM) has gained national attention for its significant contributions to the country’s overall oil supply – the area today accounts for 17% of all US oil production. The production and availability of such oil resources is threatened when...
Lydia Stanley
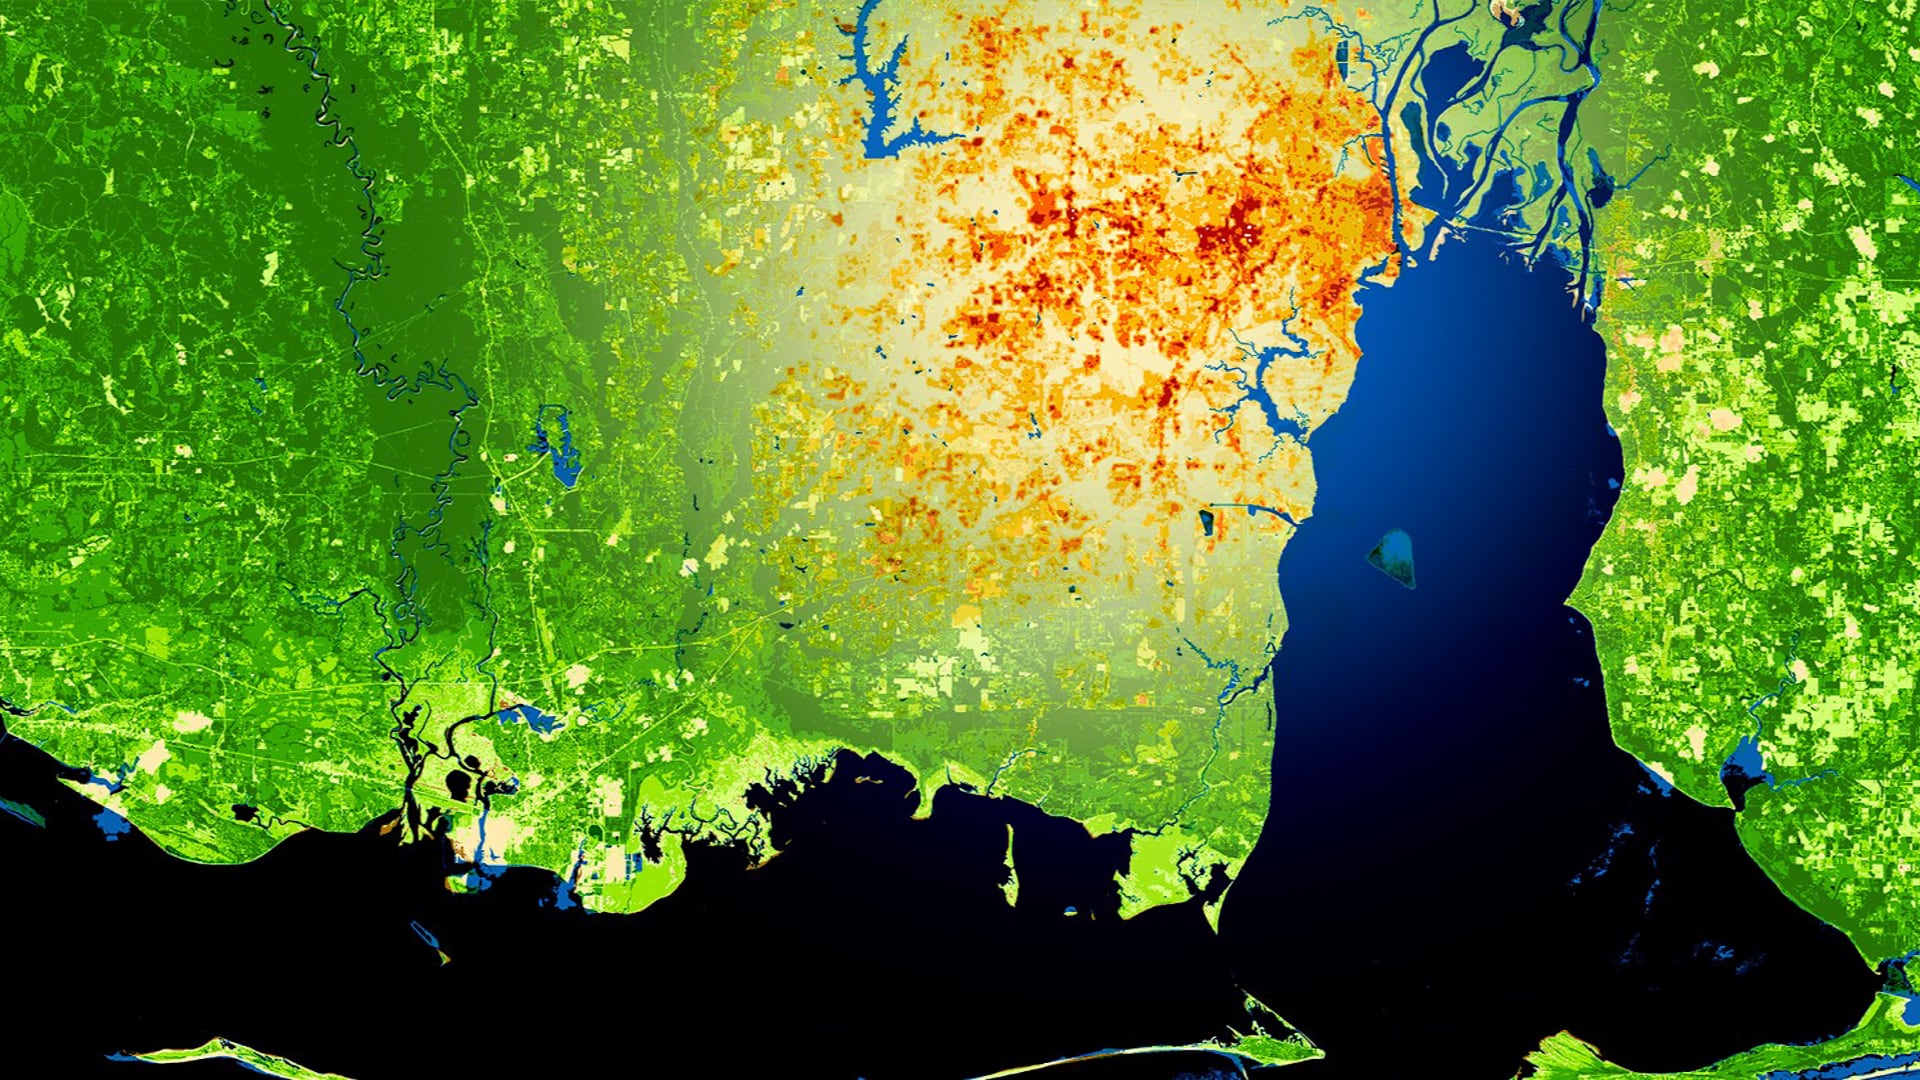
This project utilized satellite Earth observations to assess locations in Mobile County, Alabama, that are vulnerable to the urban heat island effect (UHI) and flood impacts. Our partner, Groundwork Mobile County (GWMC), and other local entities need information on UHIs...
Celeste Gambino
Tick-borne diseases are a public health issue in southern Maine, and recent estimates completed by the State of Maine suggest that as little as 1 in 10 cases of Lyme disease are actually reported. There are three tick-borne diseases known...
John Dialesandro
the Monongahela National Forest (MNF), situated in the Allegheny Highlands of West Virginia, extensive logging and mining practices have significantly altered the structure and composition of flora and fauna over the past two centuries. Of particular concern to MNF land...
Maximilian Ioffe

The expansion of the global population in conjunction with rapid industrialization has caused an increase in artificial light pollution, also known as artificial sky glow. Anthropogenic light pollution disturbs the world's ecosystems by interfering with the interconnected life of flora and fauna, degrading night sky...