Image
NASA
NASA
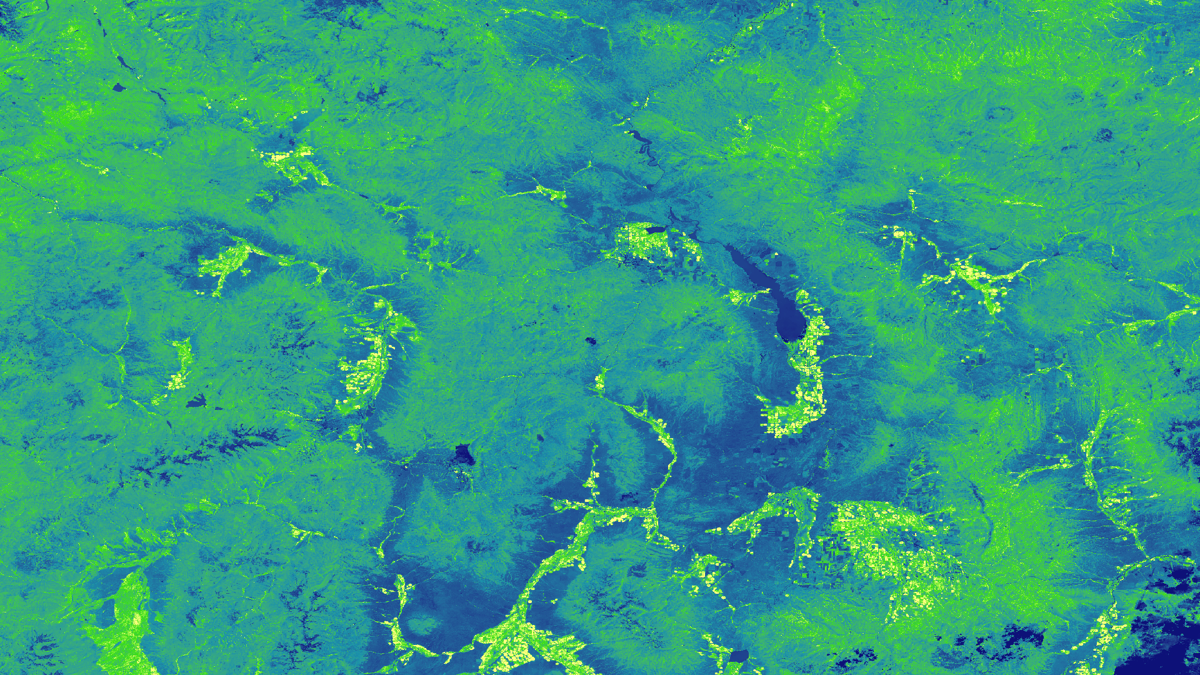
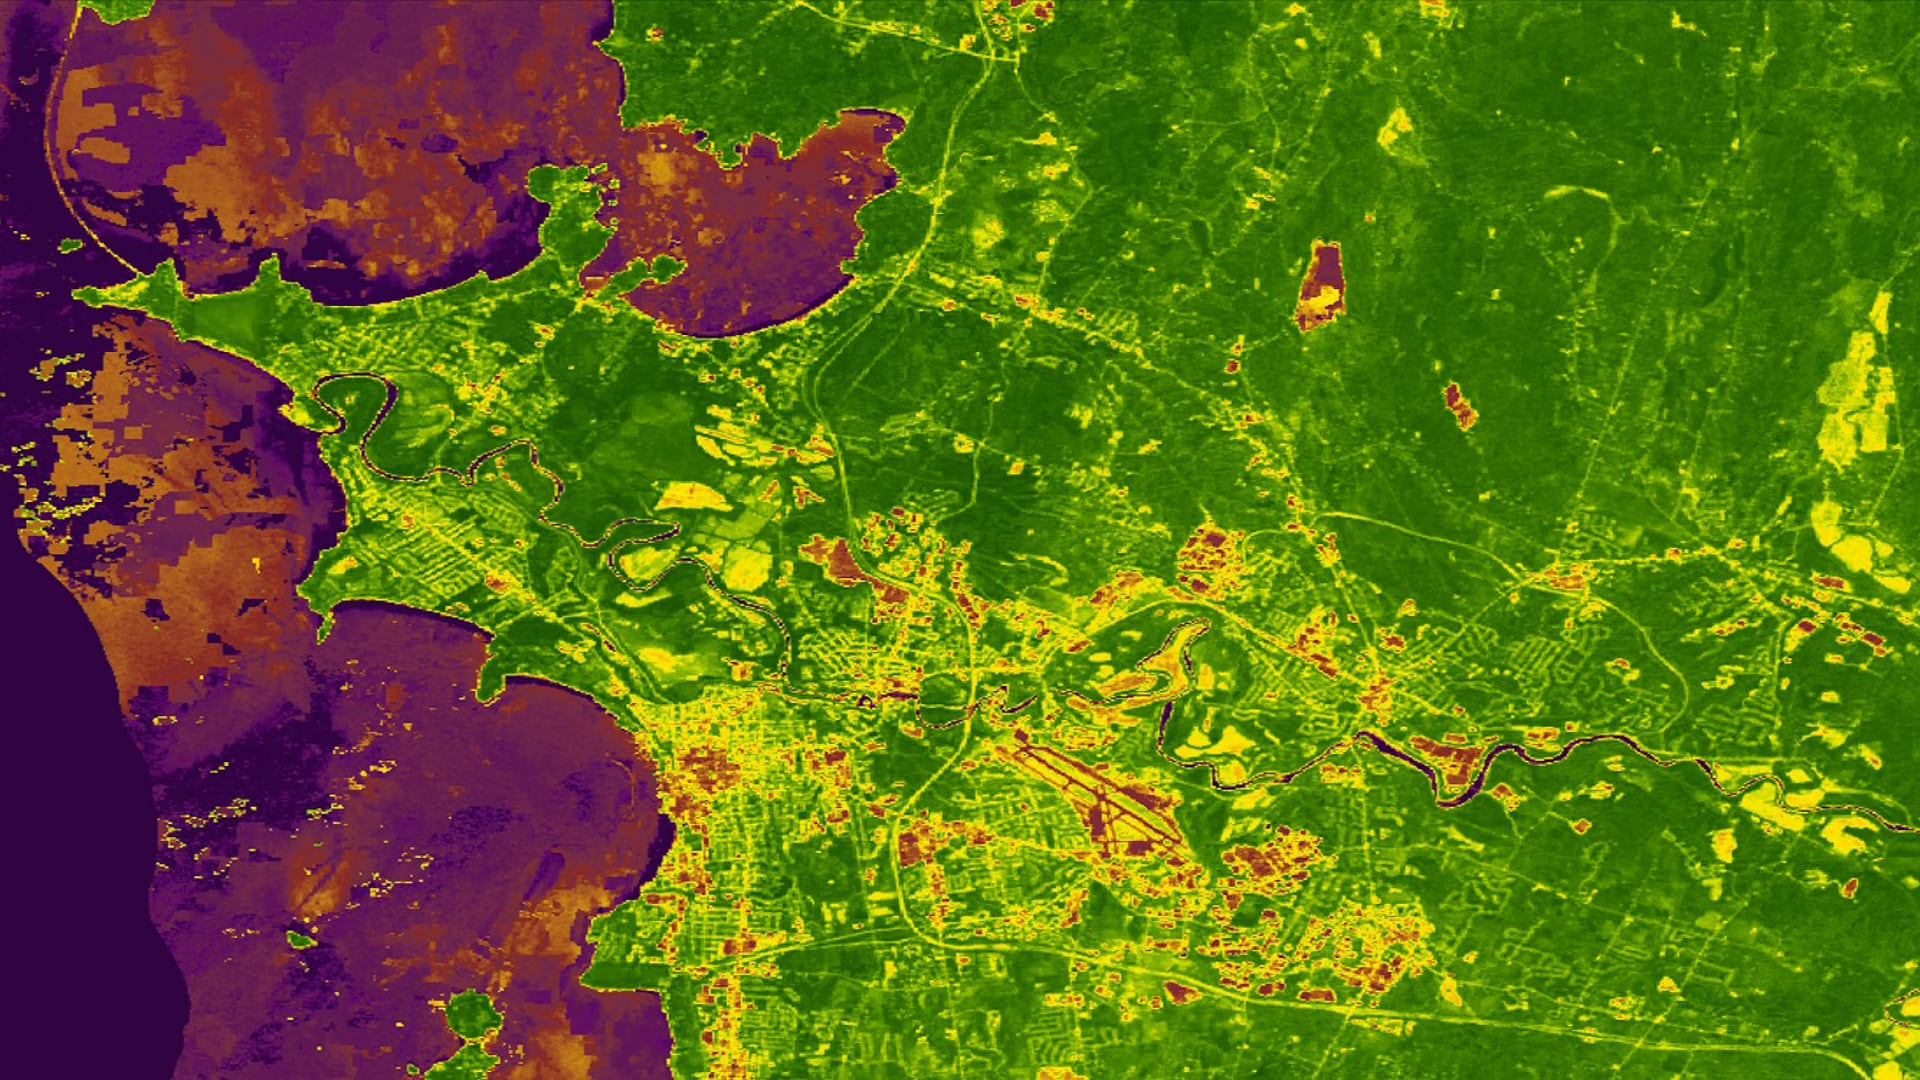
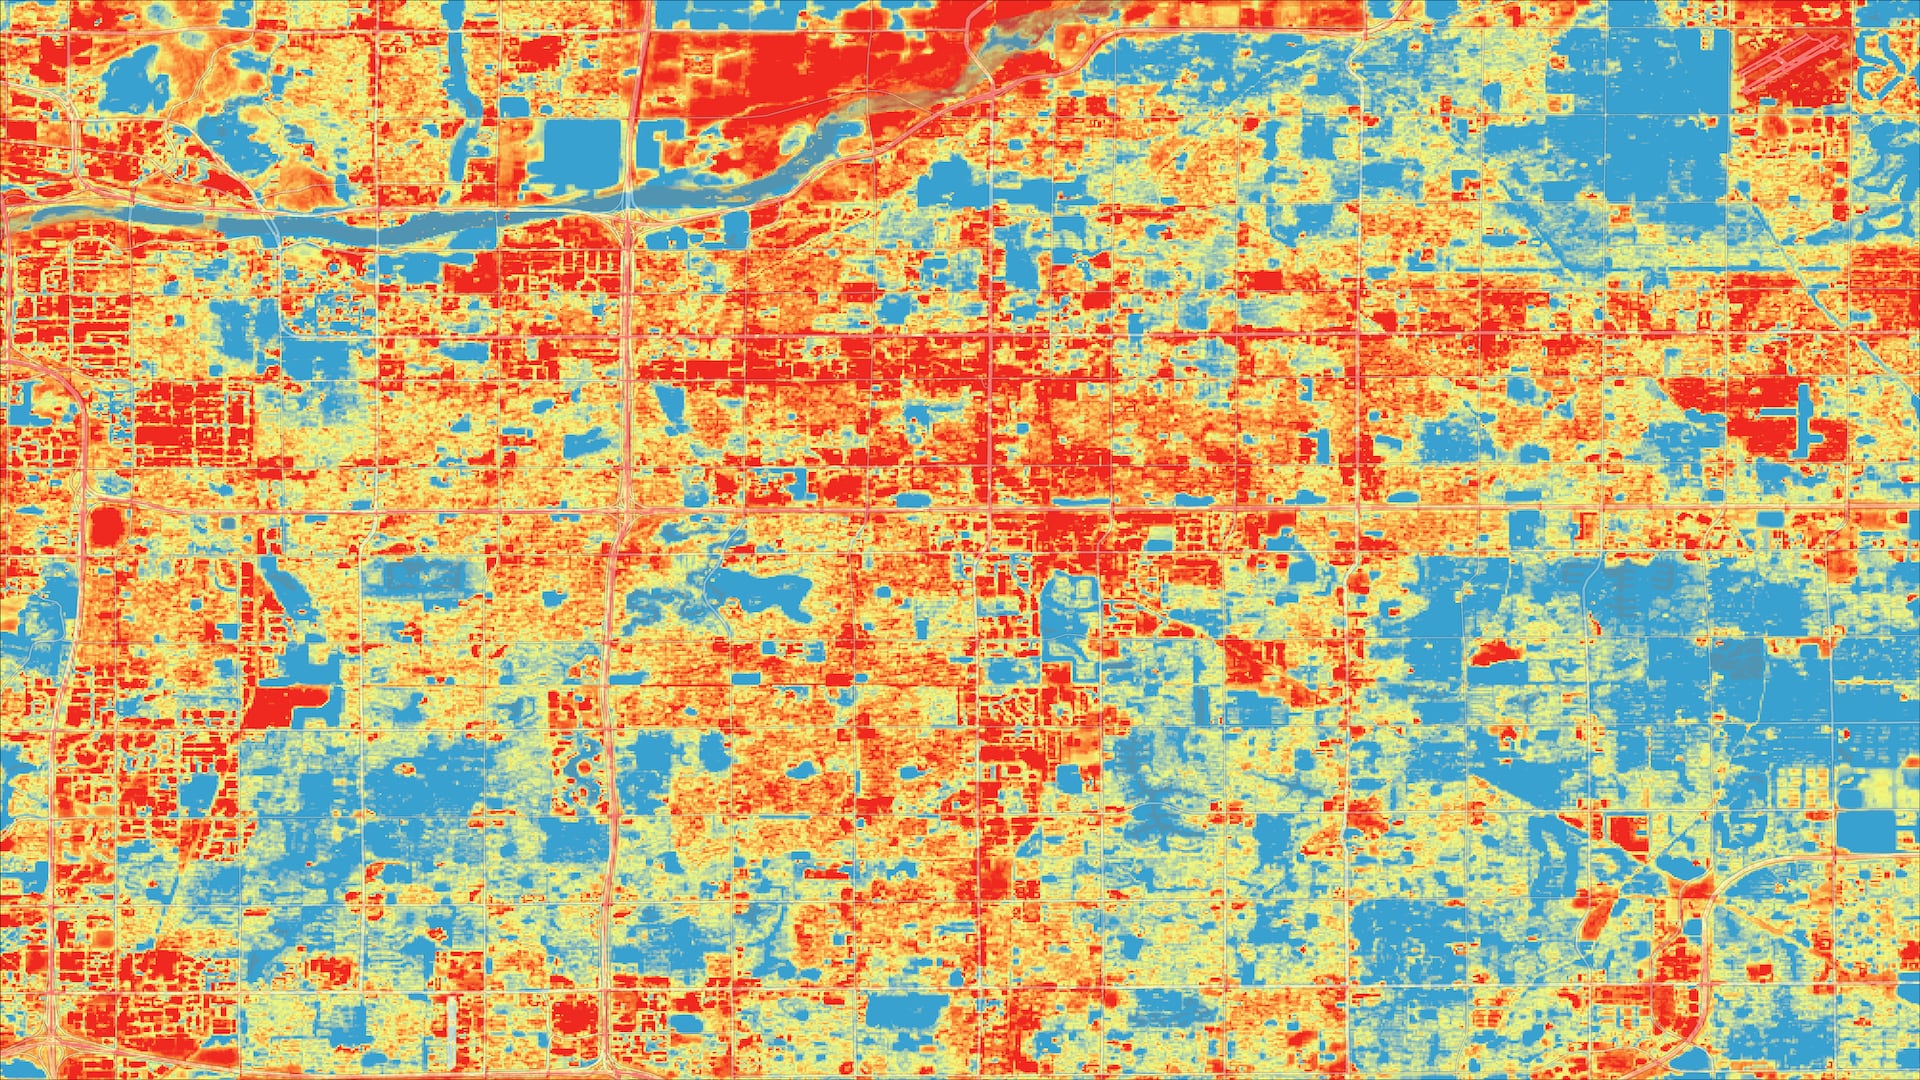
Tasseled cap greenness transformation derived from Landsat 8 imagery over lodgepole pine forest in the Intermountain West study area
Completed Projects
Henrik Westerkam
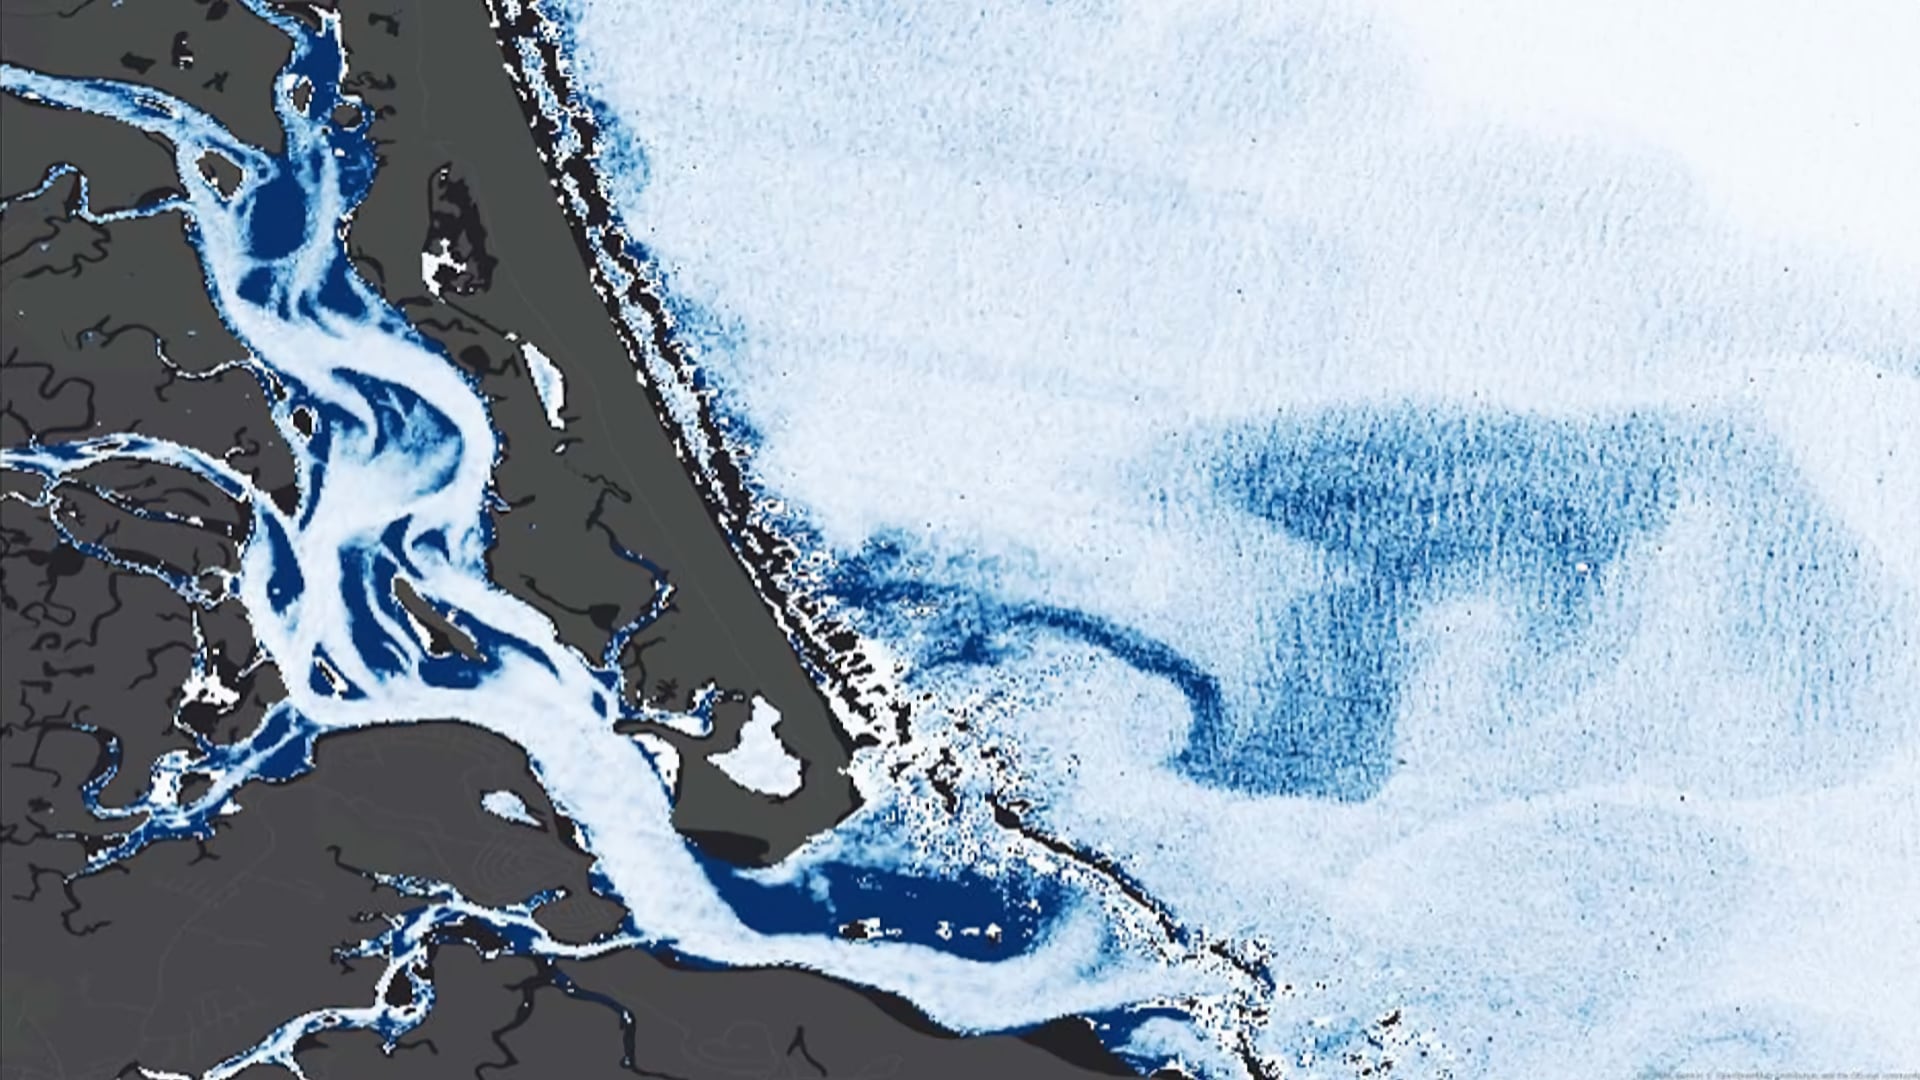
The Plum Island Estuary (PIE) in Massachusetts is New England's largest salt marsh. This dynamic ecosystem plays an important role in the surrounding communities by providing ecosystem services and acting as a center for education, research, and recreation. However, marshes around the world are threatened...
Olivia Landry
Farmers across Iowa, Minnesota, and Wisconsin have access to accurate and ample phenological data for large-grain crops like corn and soybeans. These data are useful metrics that describe changes during different stages of crop growth which help farmers evaluate crop...
Collin Pampalone
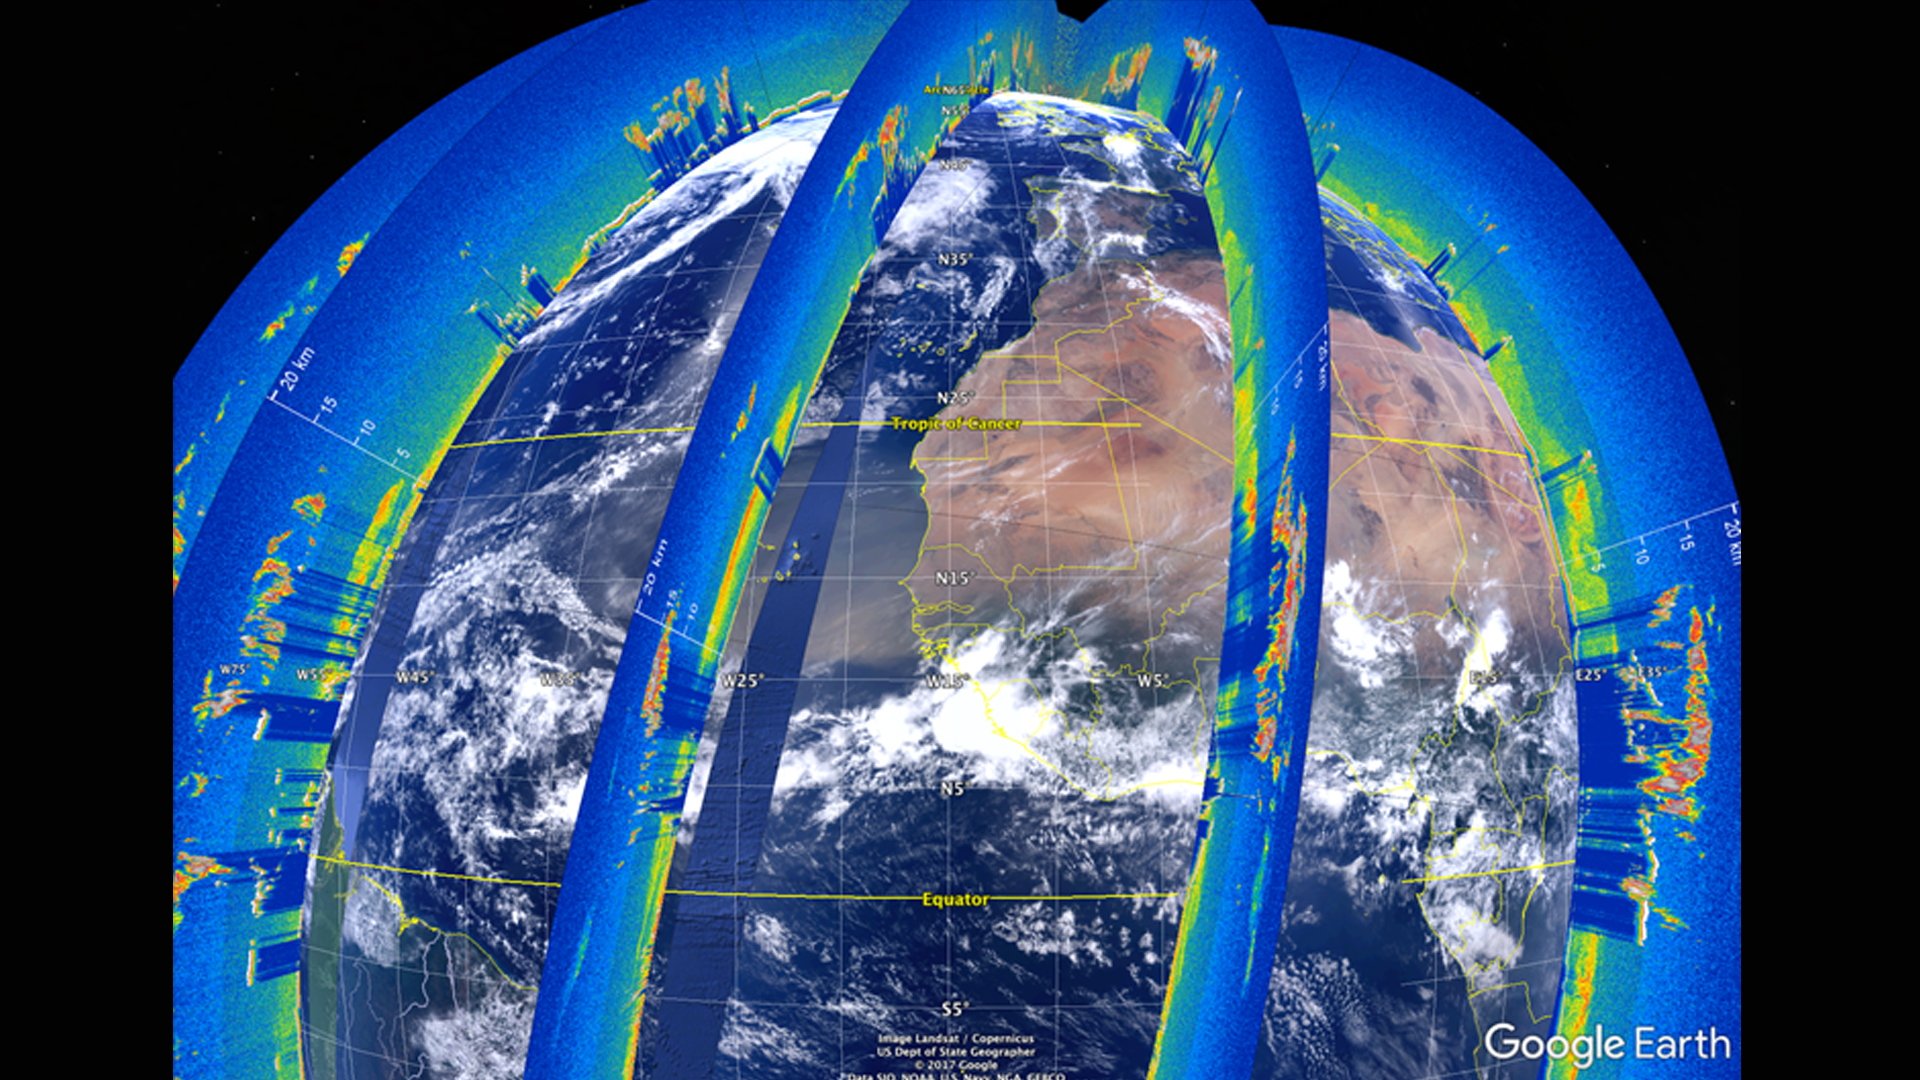
The Cloud-Aerosol LiDAR and Infrared Pathfinder Satellite Observation (CALIPSO) satellite's CALIOP sensor generates vertical LiDAR profiles of the atmosphere at a global scale. Currently, the standard visualization tool for these data is written in Interactive Data Language (IDL), a proprietary language that does not support...
Alina Schulz
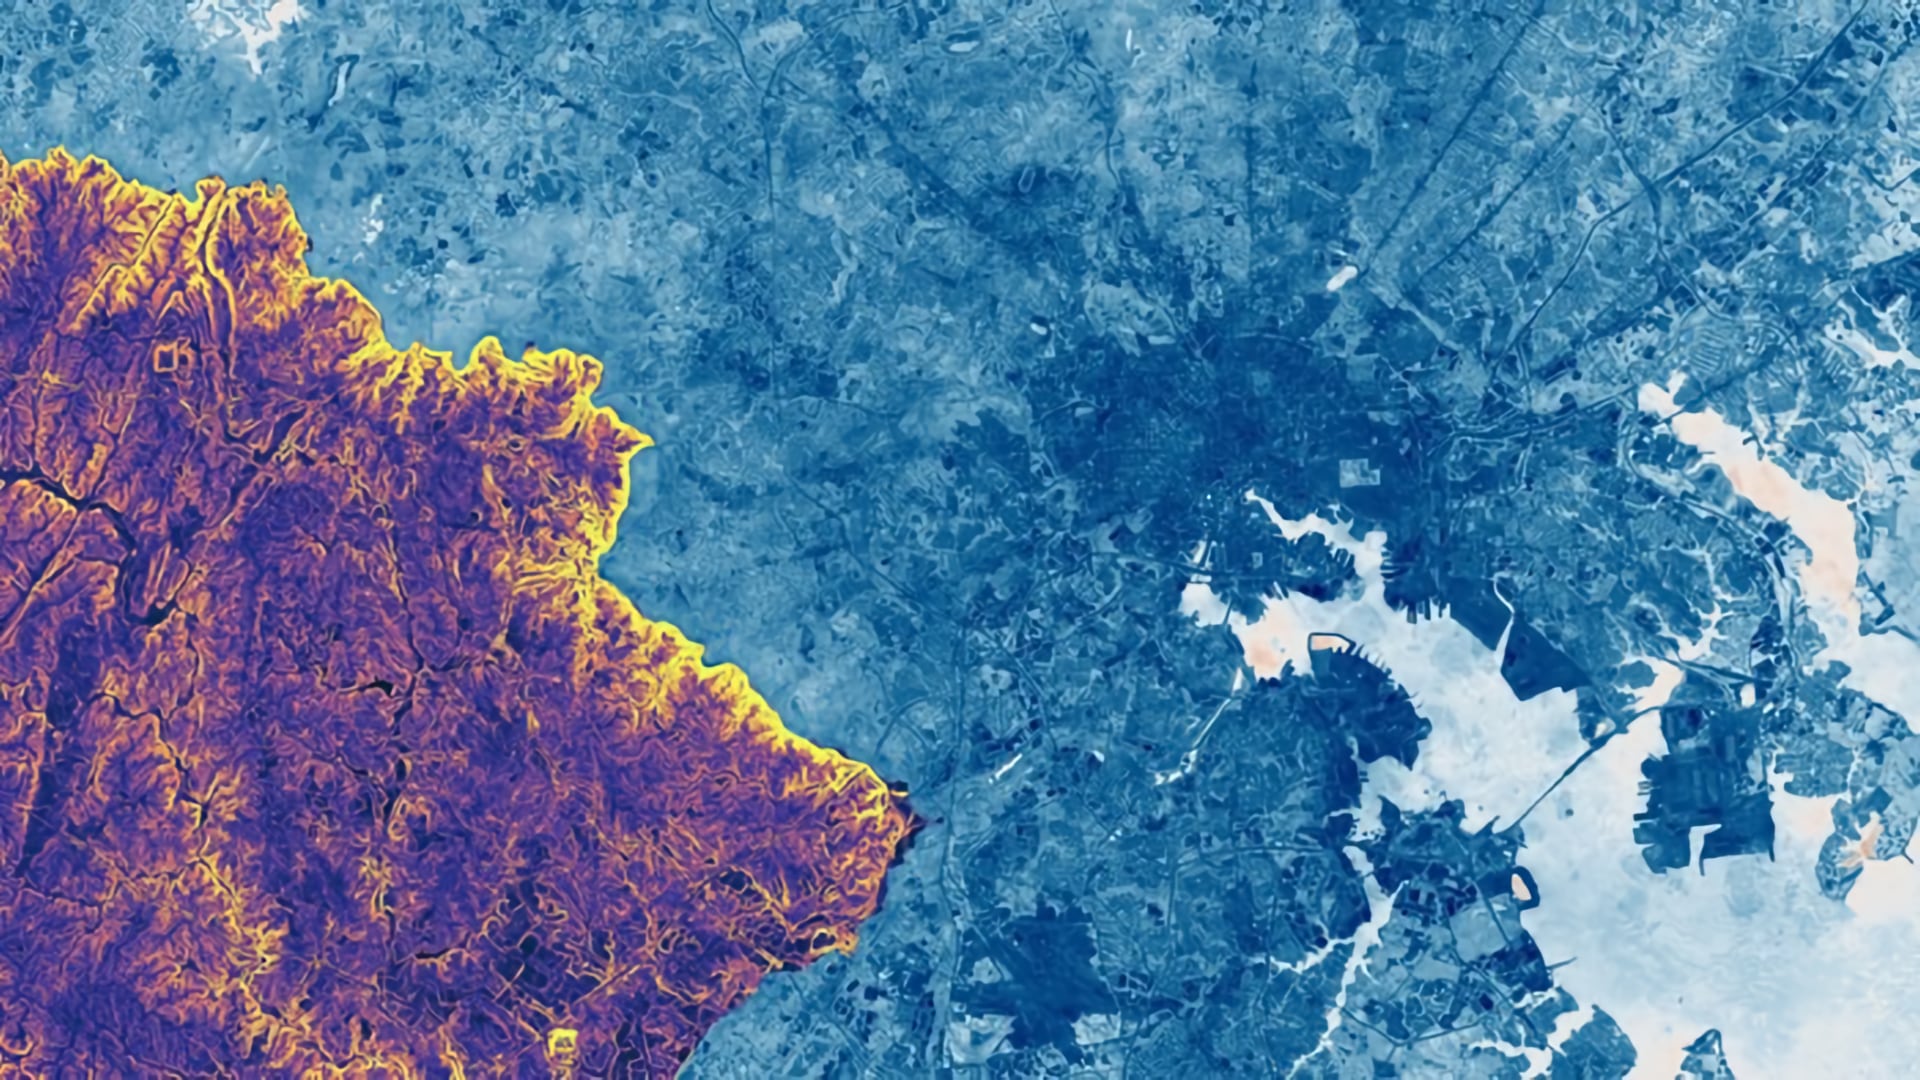
As flooding events in the United States grow in frequency and intensity, the use of technological advancements and applied science are increasingly necessary for effective flood monitoring and warning systems. The NASA DEVELOP Ellicott City Disasters II project investigated the...
Danielle Ruffe

Situated at the mouth of the Chesapeake Bay, Hampton, Virginia is one of the most vulnerable areas in the United States for environmental stressors such as flooding, sea level rise, and storm surge. The city is engaged in several initiatives and partnerships to aggregate geospatial...
Austin Counts
Increasing wildfire frequency has emphasized the importance of post-wildfire recovery efforts in southern Idaho's sagebrush-steppe ecosystem. The changing fire regime favors annual invasive grass species while hindering native grasses and sagebrush habitat regeneration, causing a positive feedback cycle of invasive plants. Due, in part, to...
Chloe Schneider
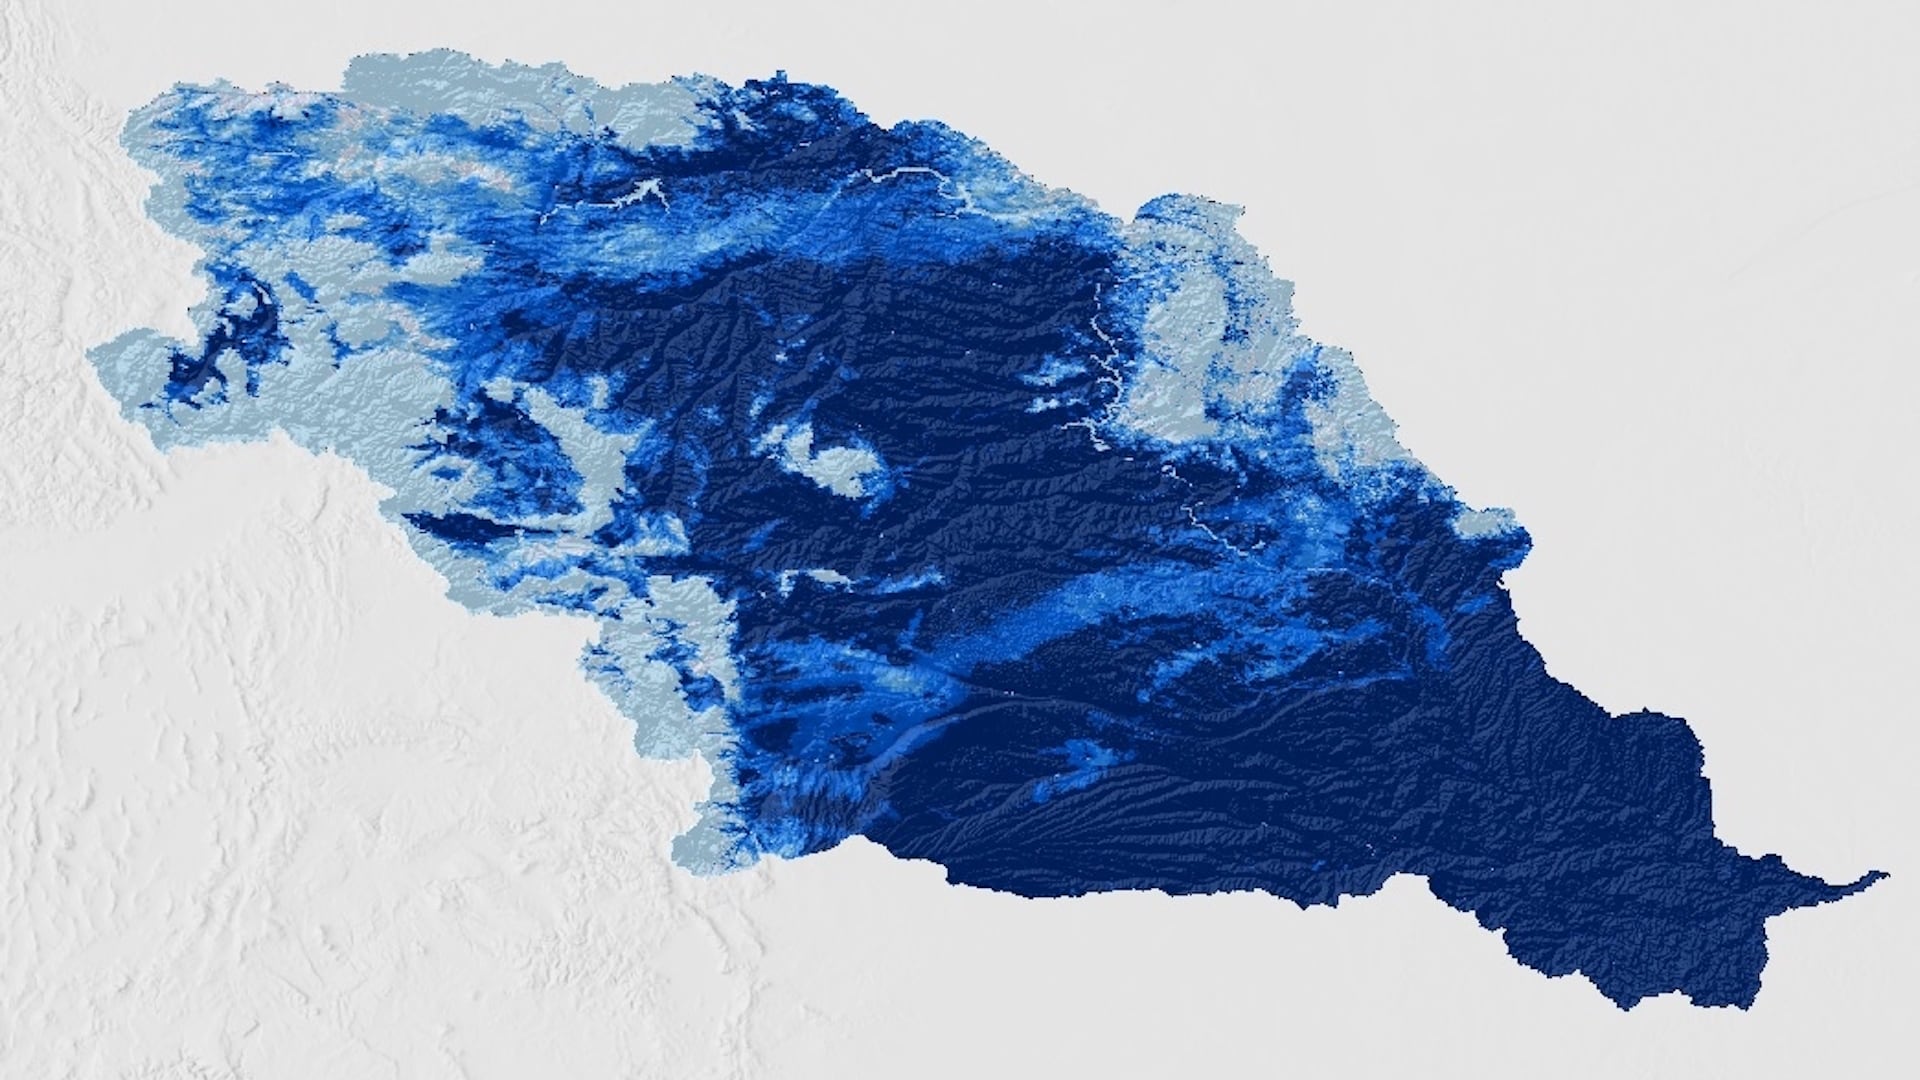
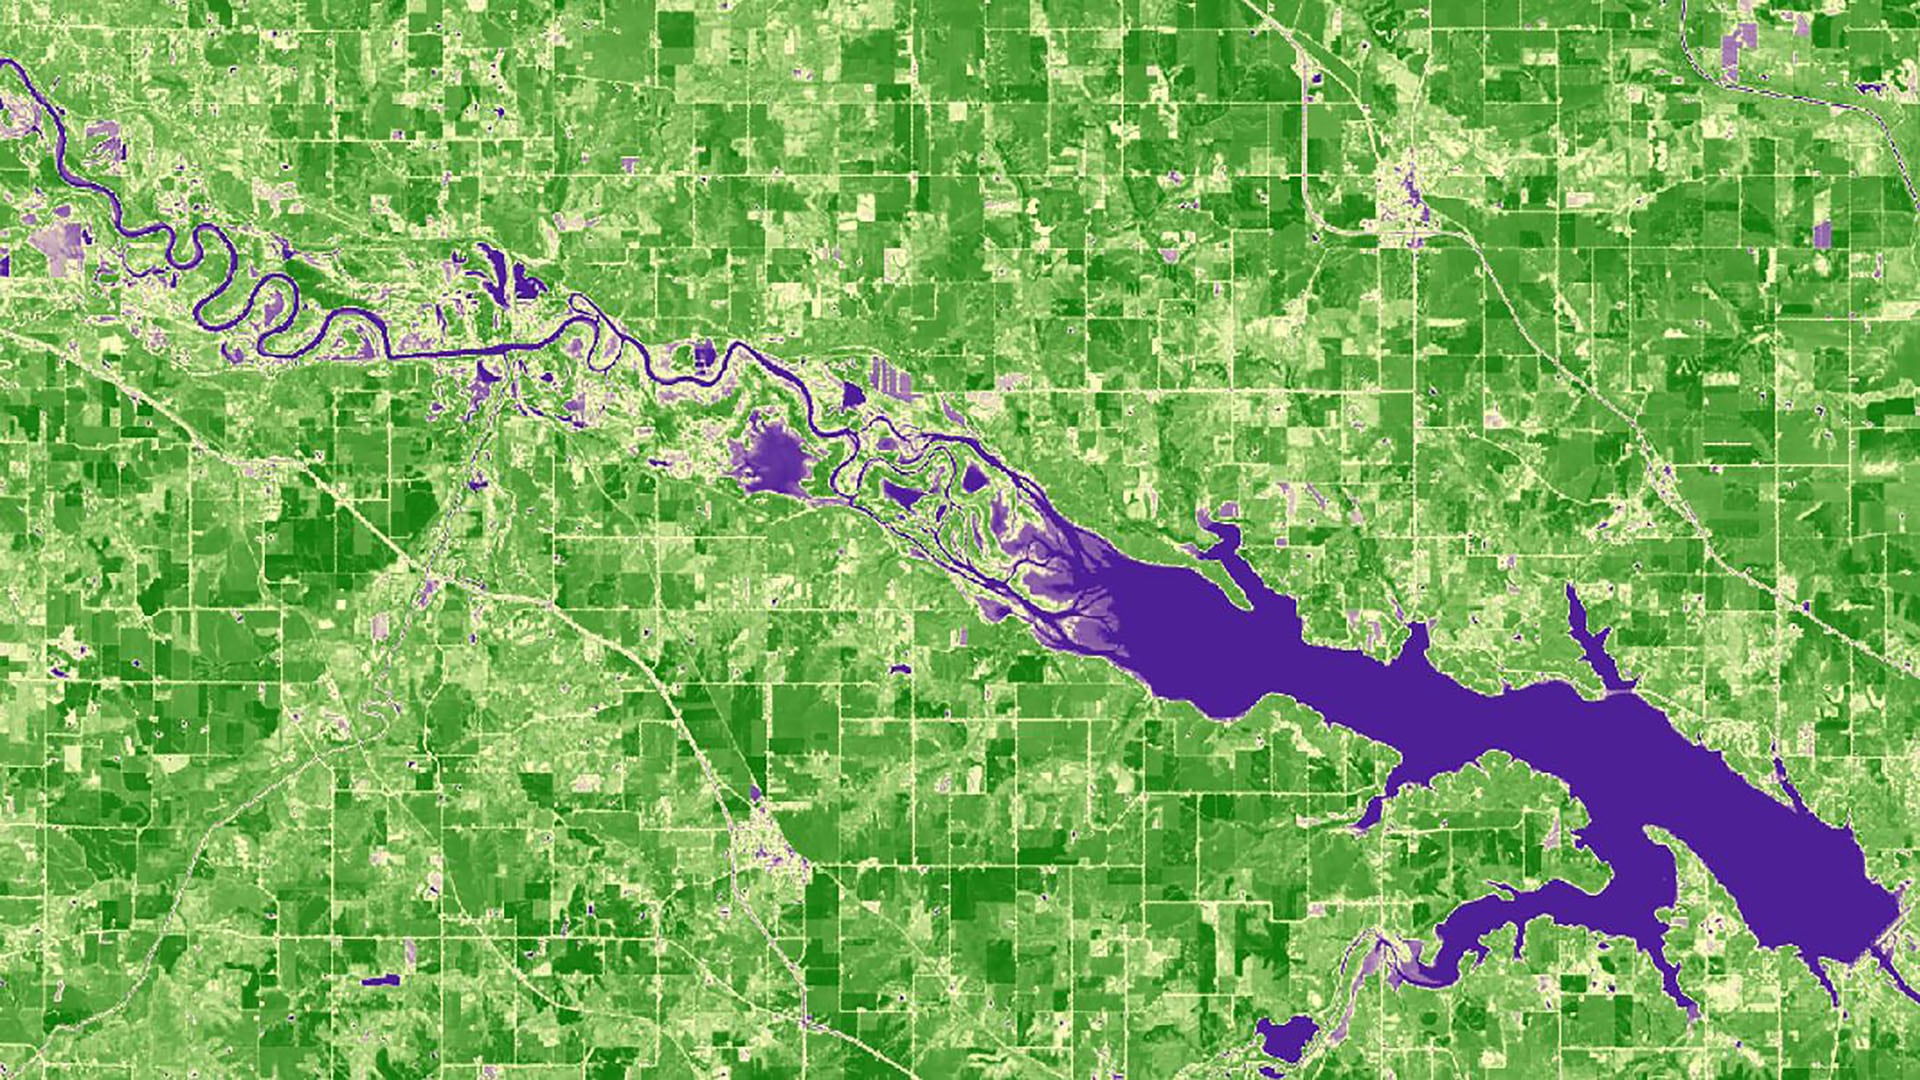
The Missouri River Basin is a major global breadbasket, containing large amounts of agricultural land. Recent devastating weather events have motivated regional organizations to dedicate efforts to drought and flood monitoring and early warning systems. The DEVELOP team partnered with...
Brooke Bartlett
syrup production has historically been at the heart of Vermont’s cultural and economic identity. In 2018, the state was the leading producer in the US, generating 46.6 percent of the country’s maple syrup. However, temperature fluctuations, drought, and variable defoliation...
Sydney Boogaard
Located in the northern Sonoran Desert, Tempe, Arizona, features a semi-arid climate with summer daily maximum temperatures regularly exceeding 37.8° C (100.0° F). The area has experienced an increase in surface and air temperatures due to a steep expansion of...
Ian Lauer
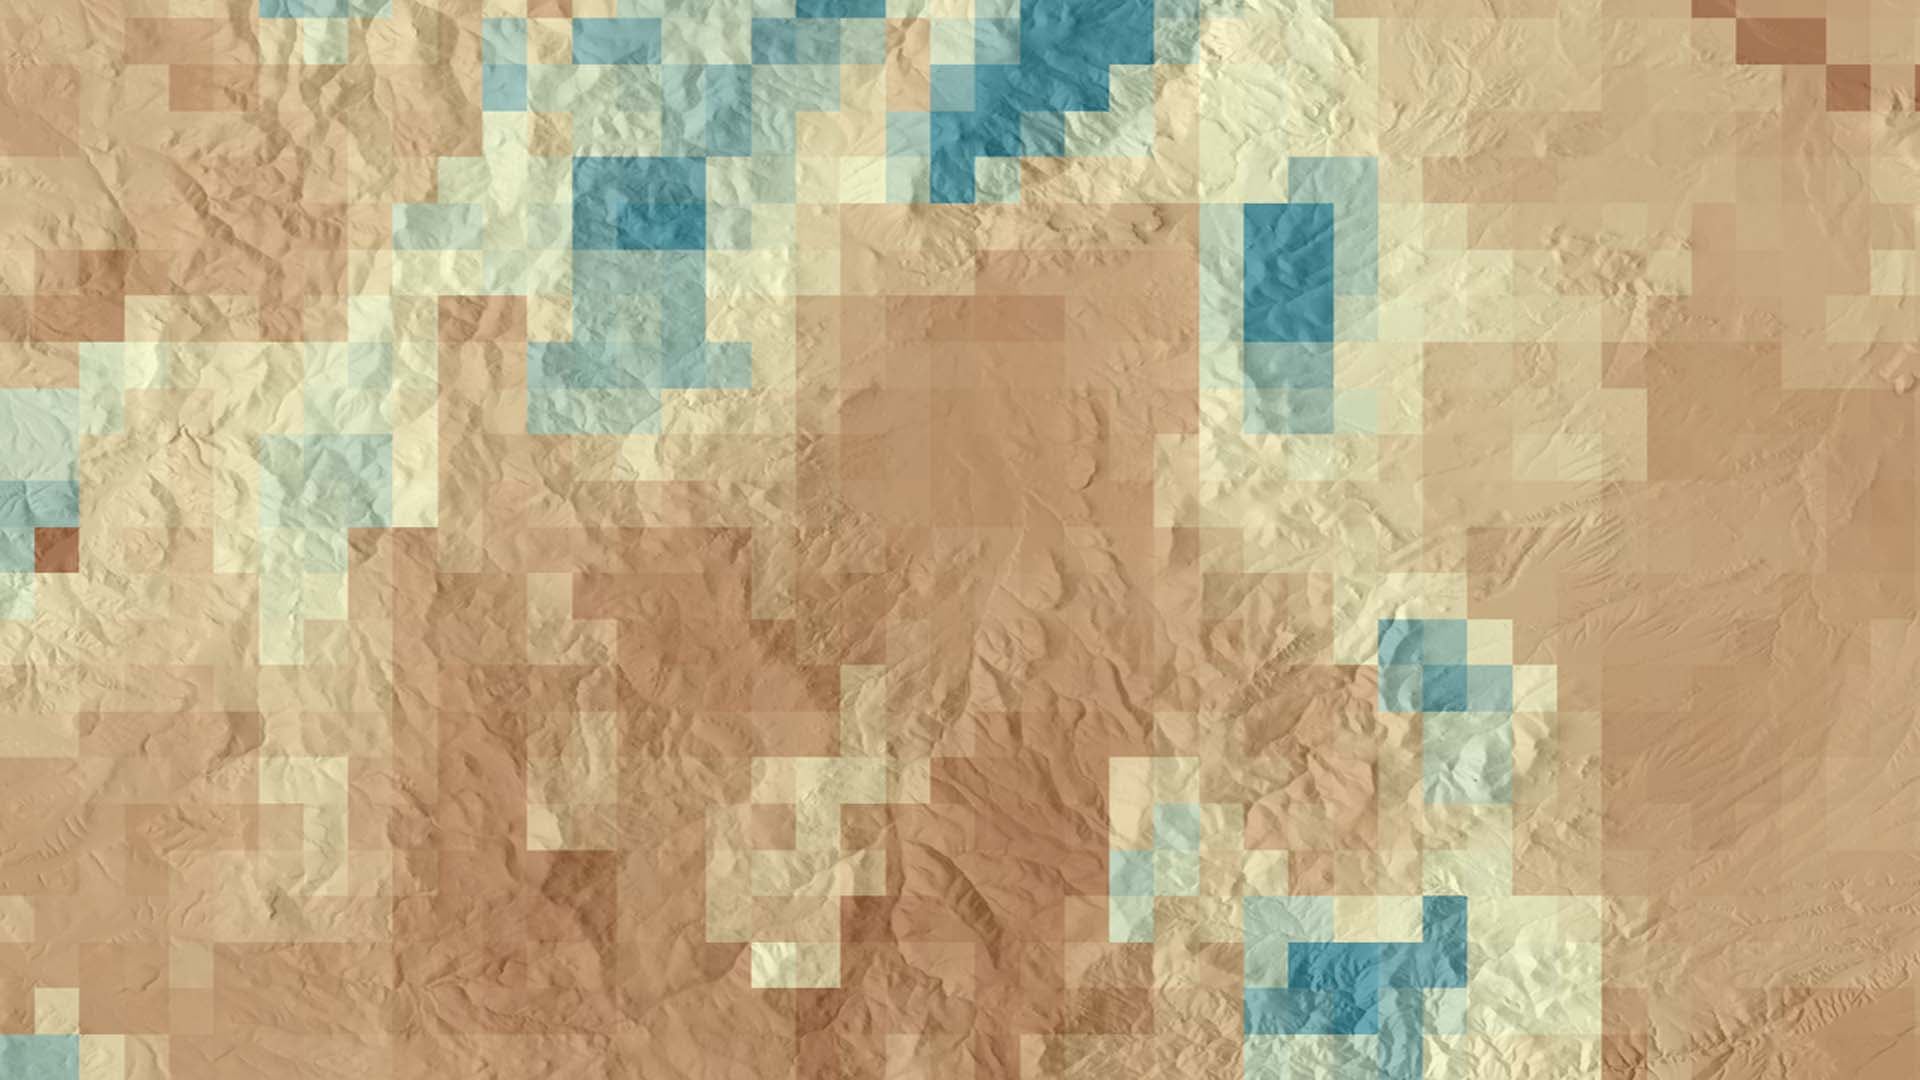
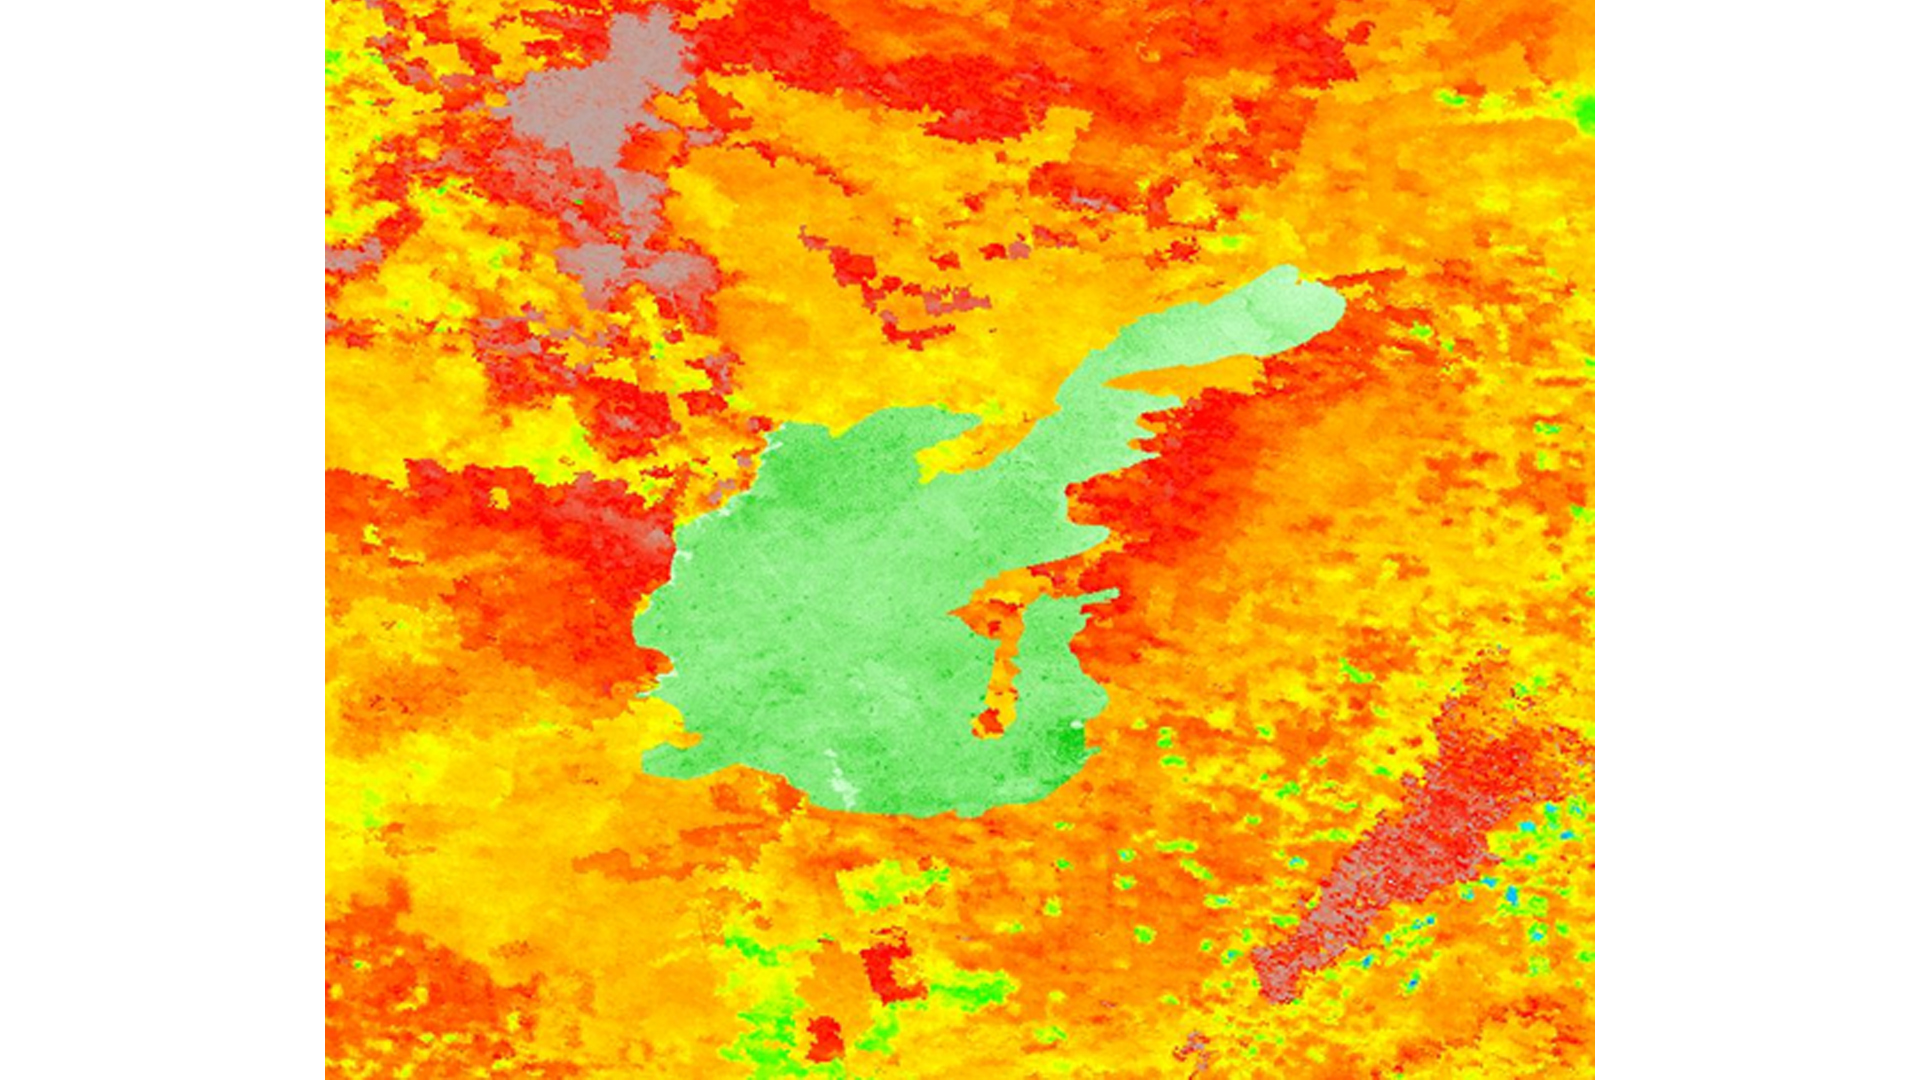
Soil moisture is a critical component of ecosystem health, particularly in semi-arid landscapes where seasonal and infrequent precipitation is one of the primary controls on vegetative health. Current land management practices of soil moisture data collection rely on costly and time-consuming field sampling or on...