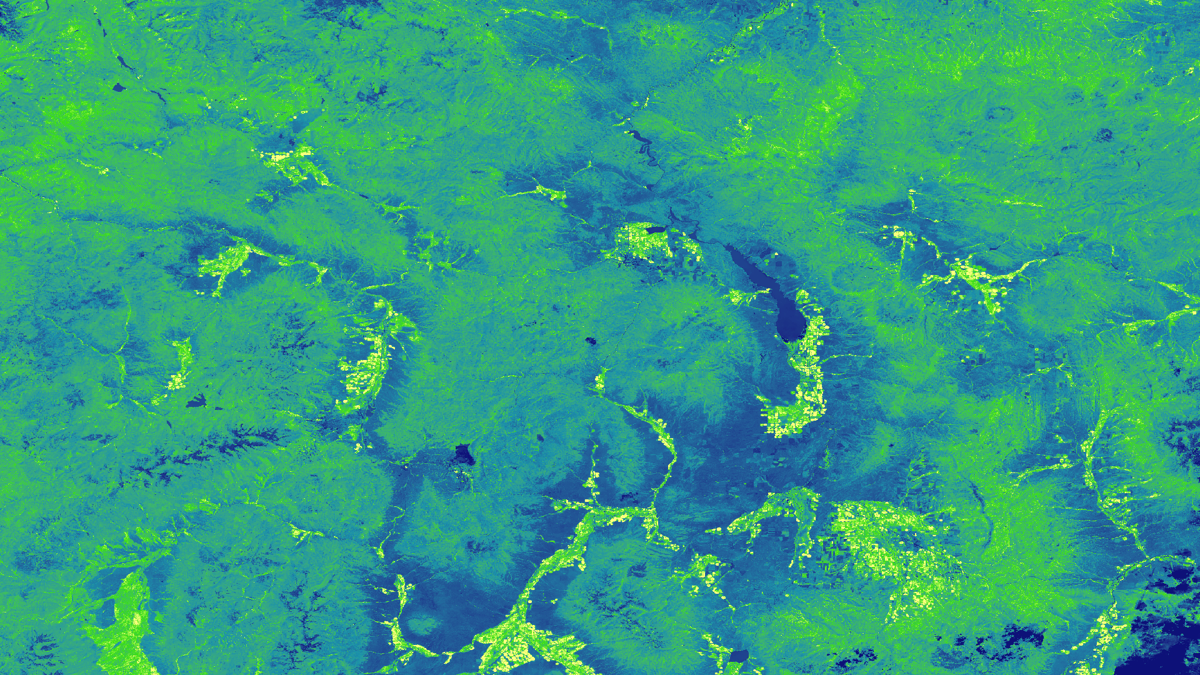
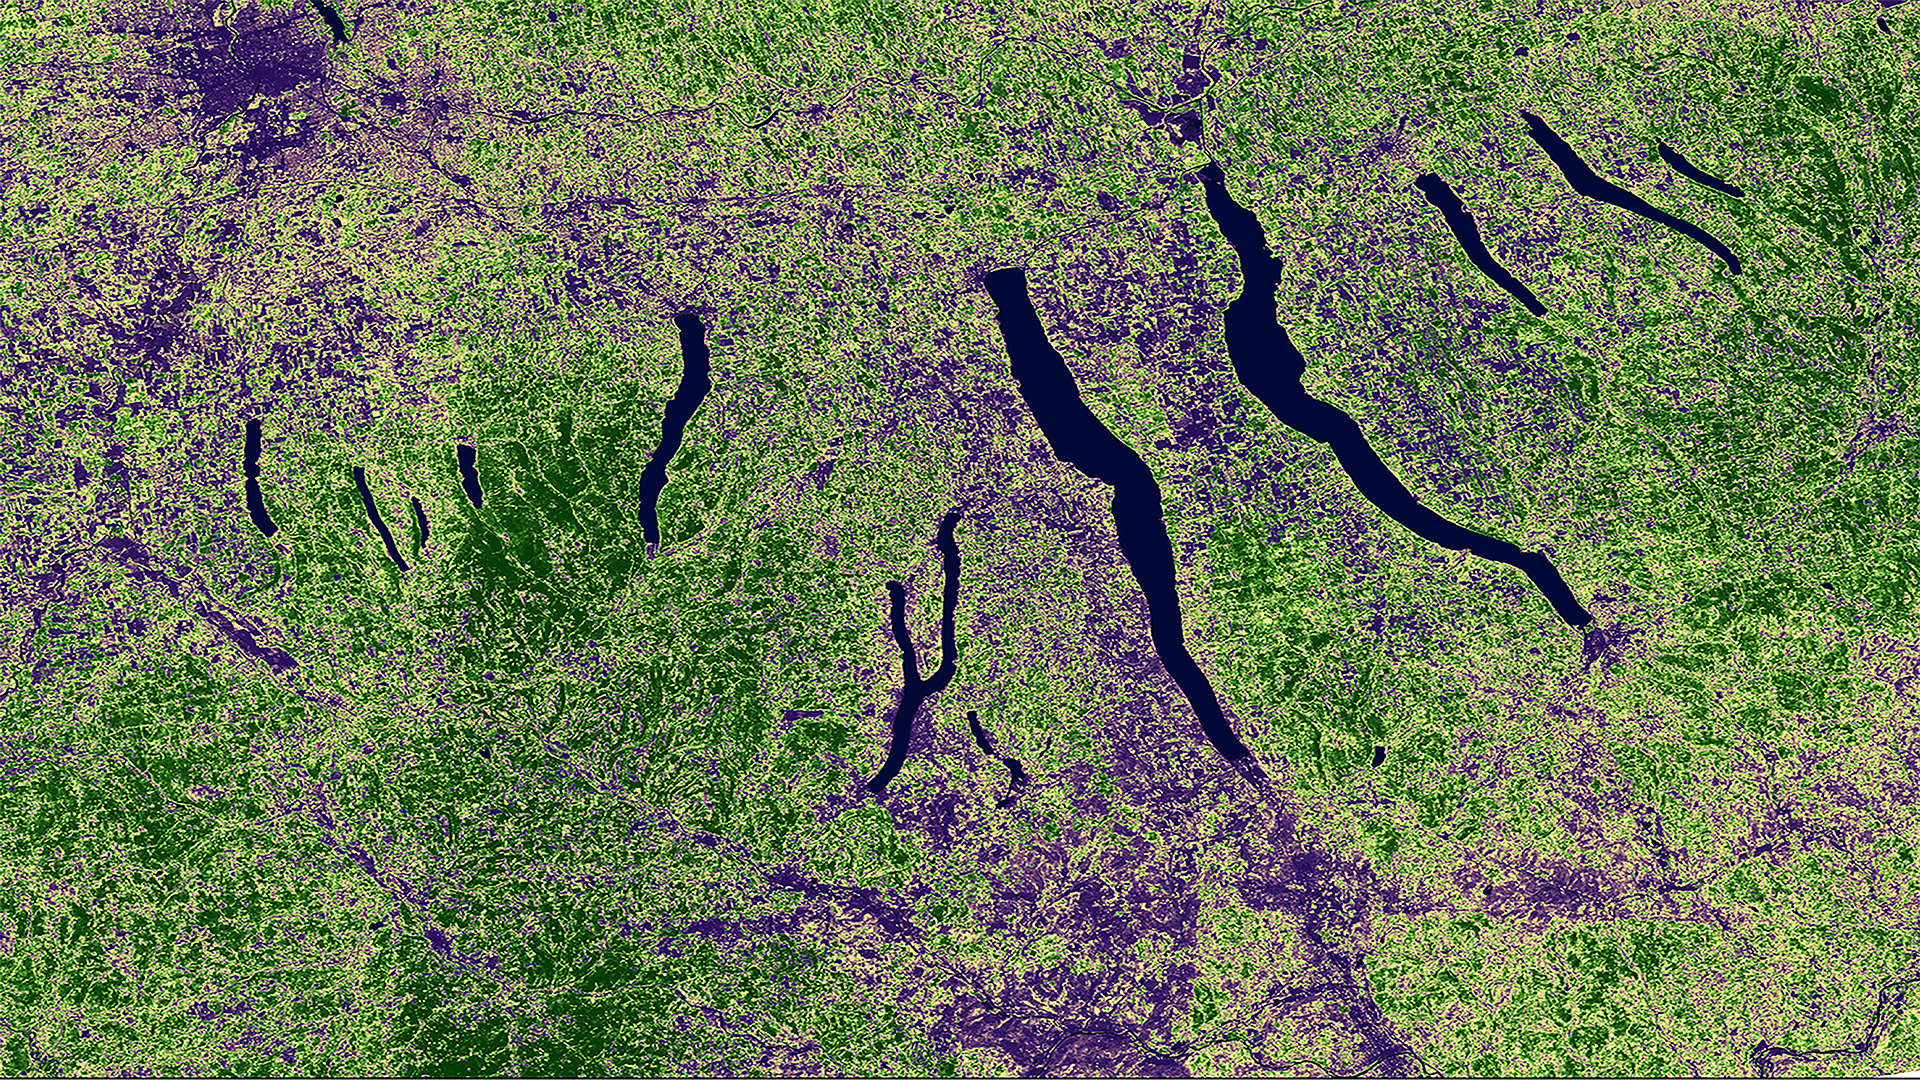
Principal Investigator

John Dialesandro

Imagen
Split-season composite from May (leaf-on) and November (leaf-off) 2018 in the Allegheny Mountains of West Virginia. This Landsat 8 OLI imagery displays a color combination of SWIR_1 (leaf-on), SWIR_1 (leaf-off), and NIR (leaf-on). Urban areas are shown in pink, impervious surfaces in periwinkle, conifer forests in dark green, and exposed soil in orange. This stack, and others like it, are used for determining land cover classifications and collecting training data for forest restoration efforts.

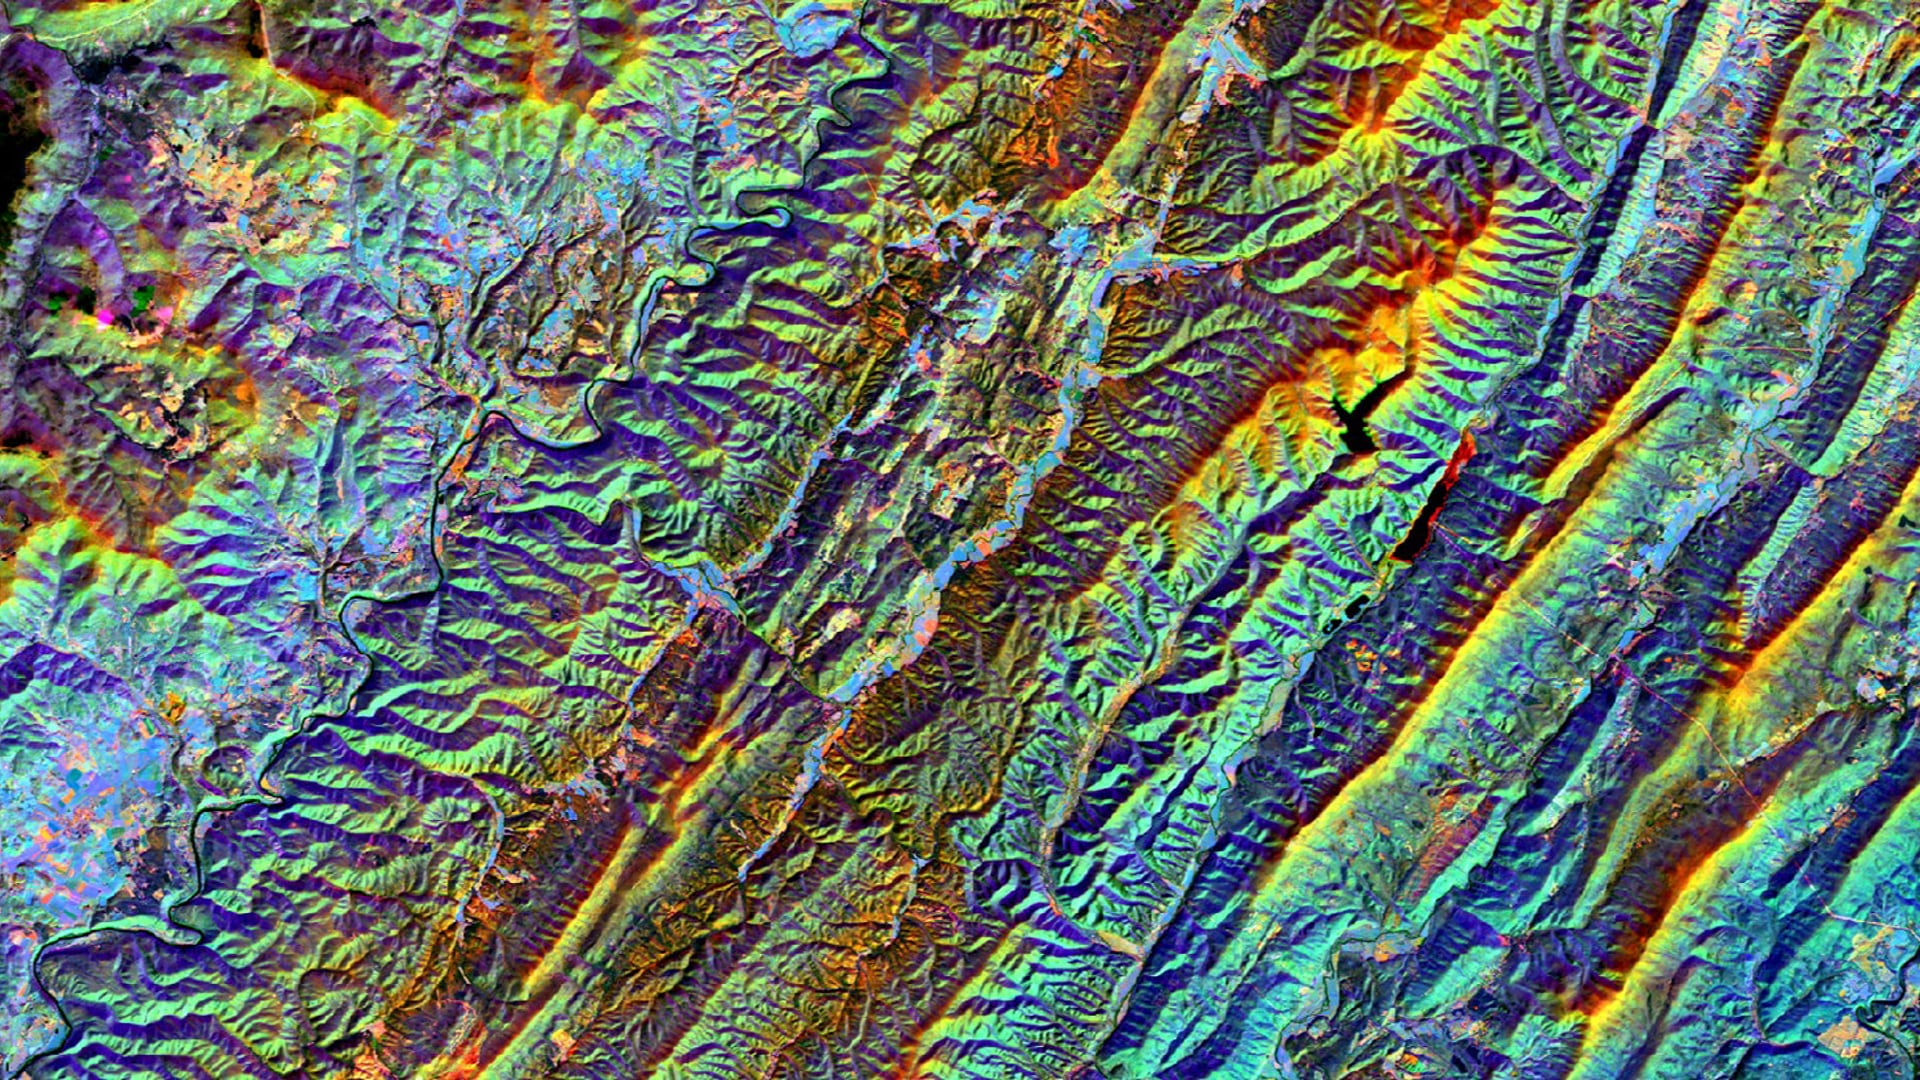
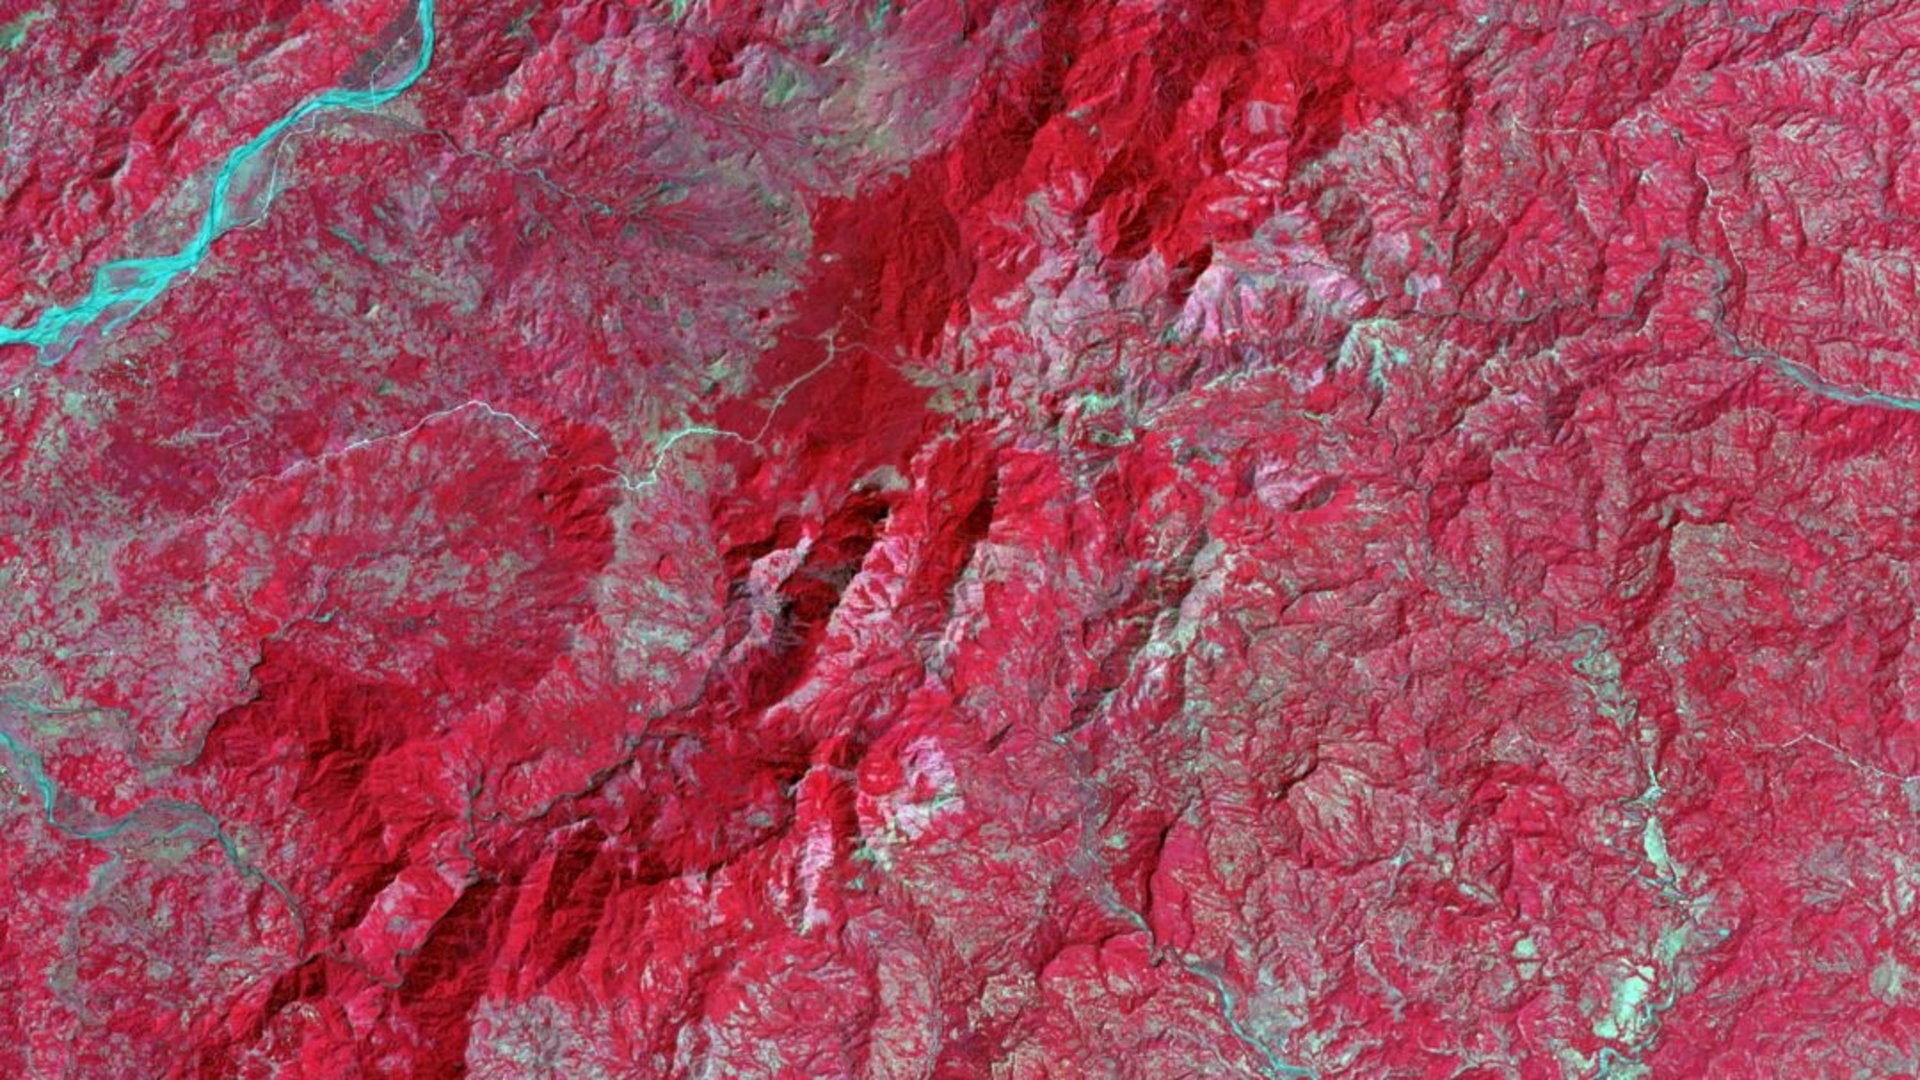
the Monongahela National Forest (MNF), situated in the Allegheny Highlands of West Virginia, extensive logging and mining practices have significantly altered the structure and composition of flora and fauna over the past two centuries. Of particular concern to MNF land...

Principal Investigator

Maximilian Ioffe

Imagen
Generating Hemispherical Visualizations of Artificial Sky Brightness Using Updated Sky Glow Estimation Tools on Suomi NPP-VIIRS Data

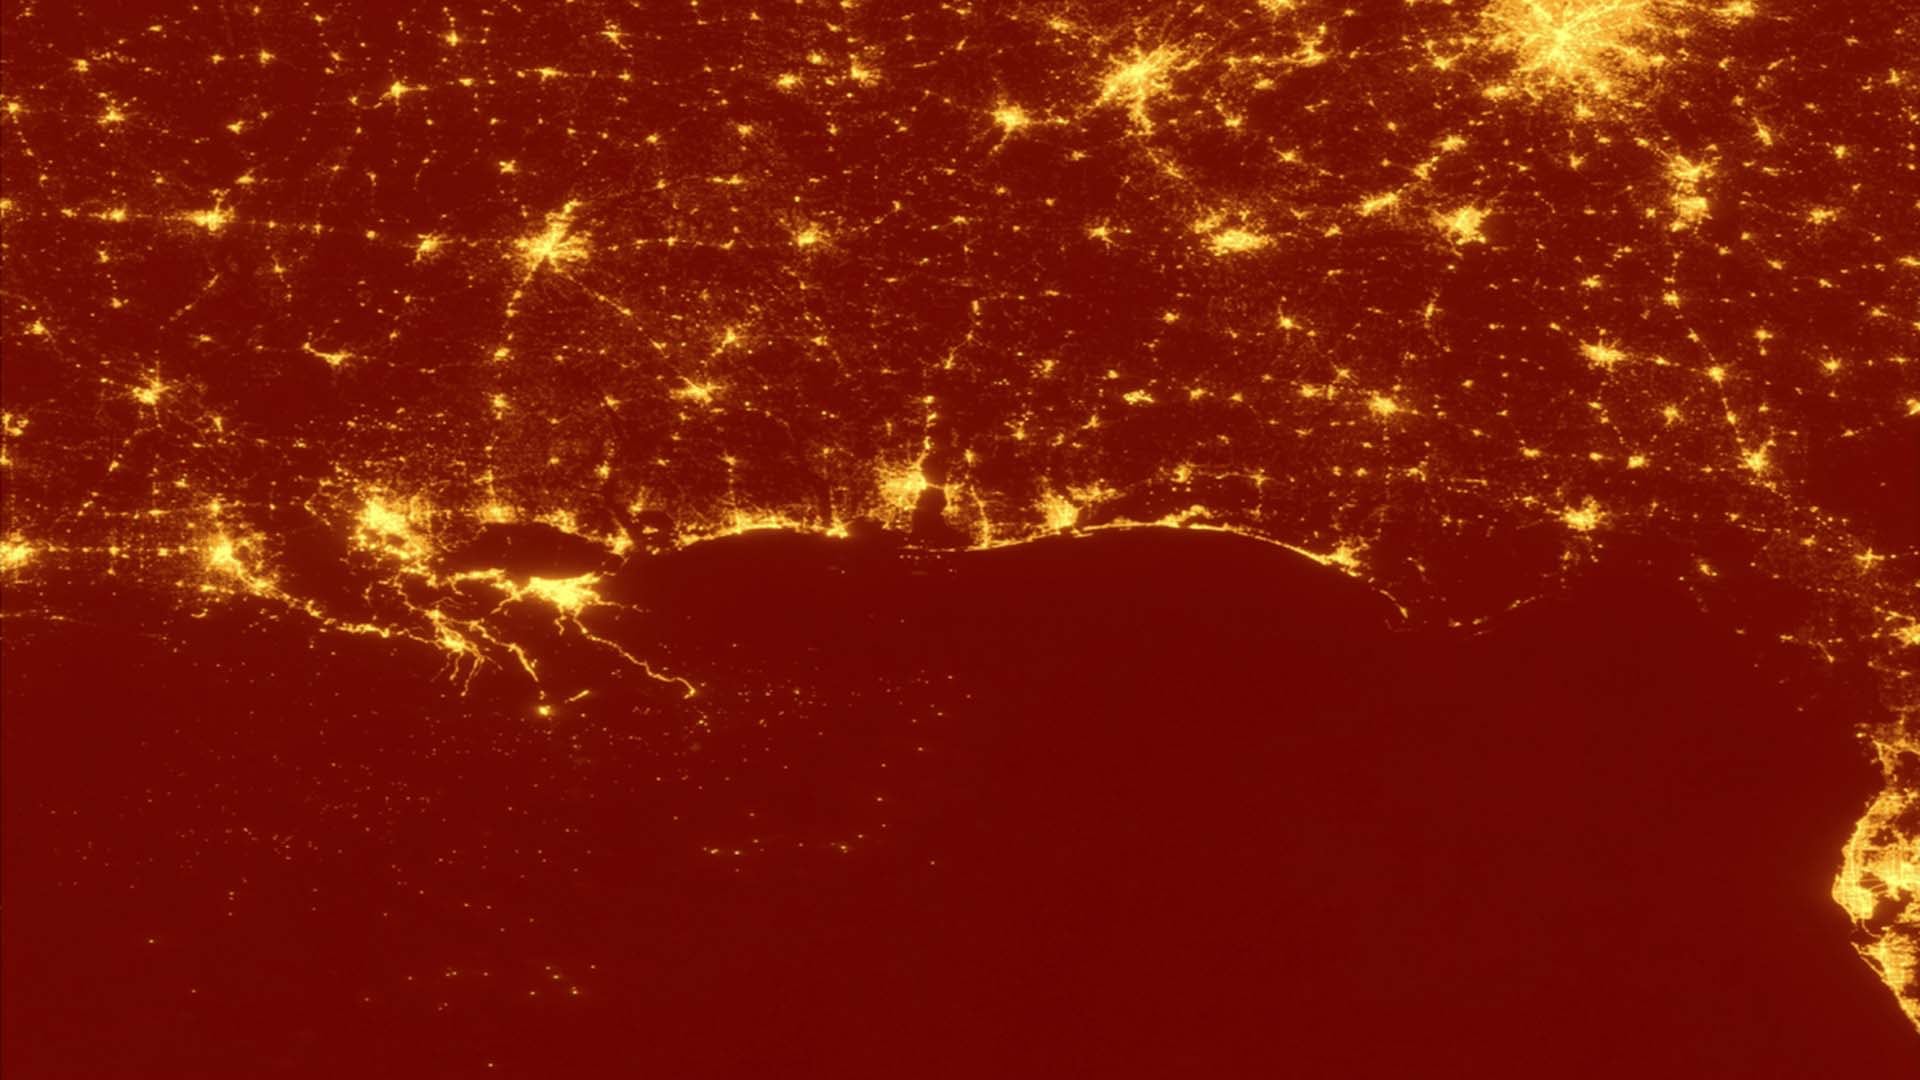
The expansion of the global population in conjunction with rapid industrialization has caused an increase in artificial light pollution, also known as artificial sky glow. Anthropogenic light pollution disturbs the world's ecosystems by interfering with the interconnected life of flora and fauna, degrading night sky...

Principal Investigator

Katie Lange

Imagen
NASA’s Gravity Recovery and Climate Experiment (GRACE) and Sentinel-1 C-band Synthetic Aperture Radar (SAR) can be used to evaluate groundwater depletion and land subsidence. Groundwater storage change, calculated from GRACE, and land surface subsidence, calculated from Sentinel-1 C-SAR, from March 2015 to August 2019 are shown in the California Central Valley. Redder shades indicate greater groundwater storage loss detected by GRACE. Sentinel-1 data shown in blue, illustrates greater land subsidence in darker blue.   Keywords: GRACE, InSAR, land subsidence, groundwater storage, California, Central Valley, Kathleen Lange, James Kitchens, Vanessa Valenti, Elizabeth Perez

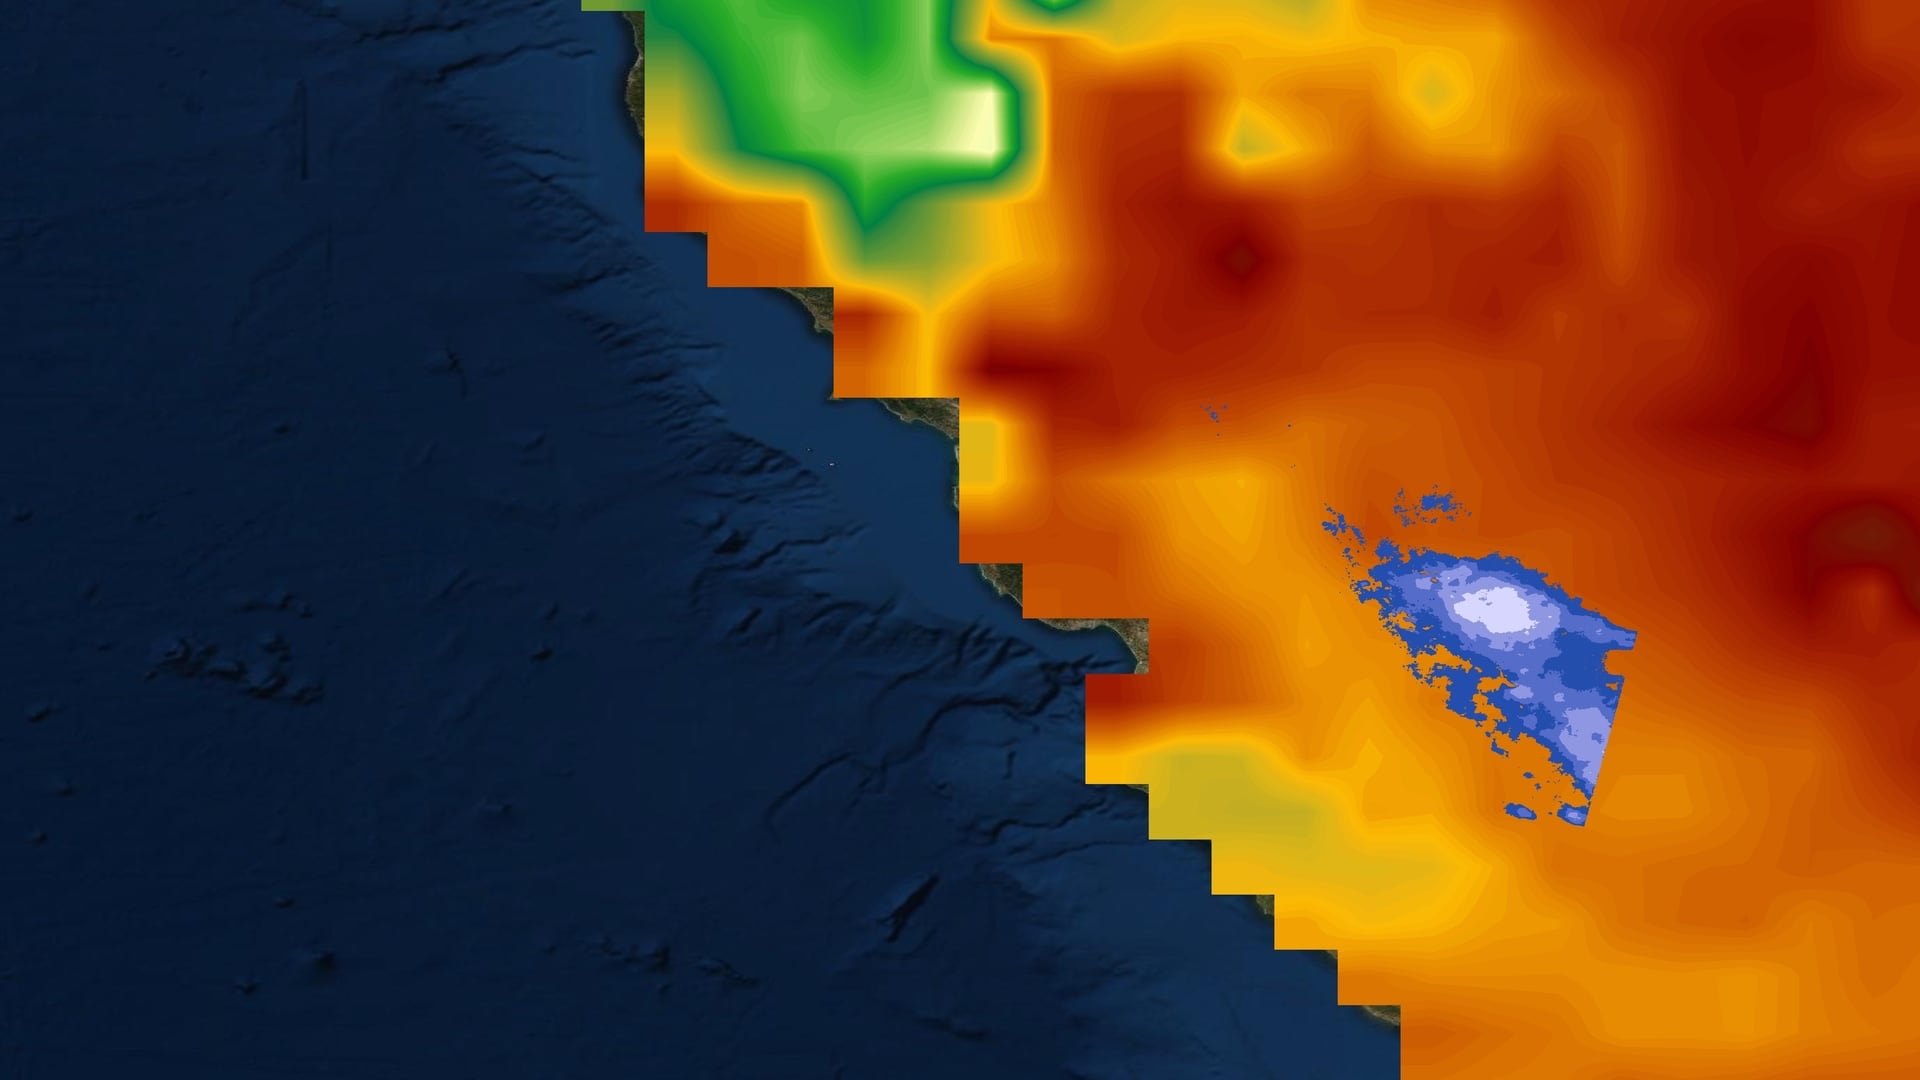
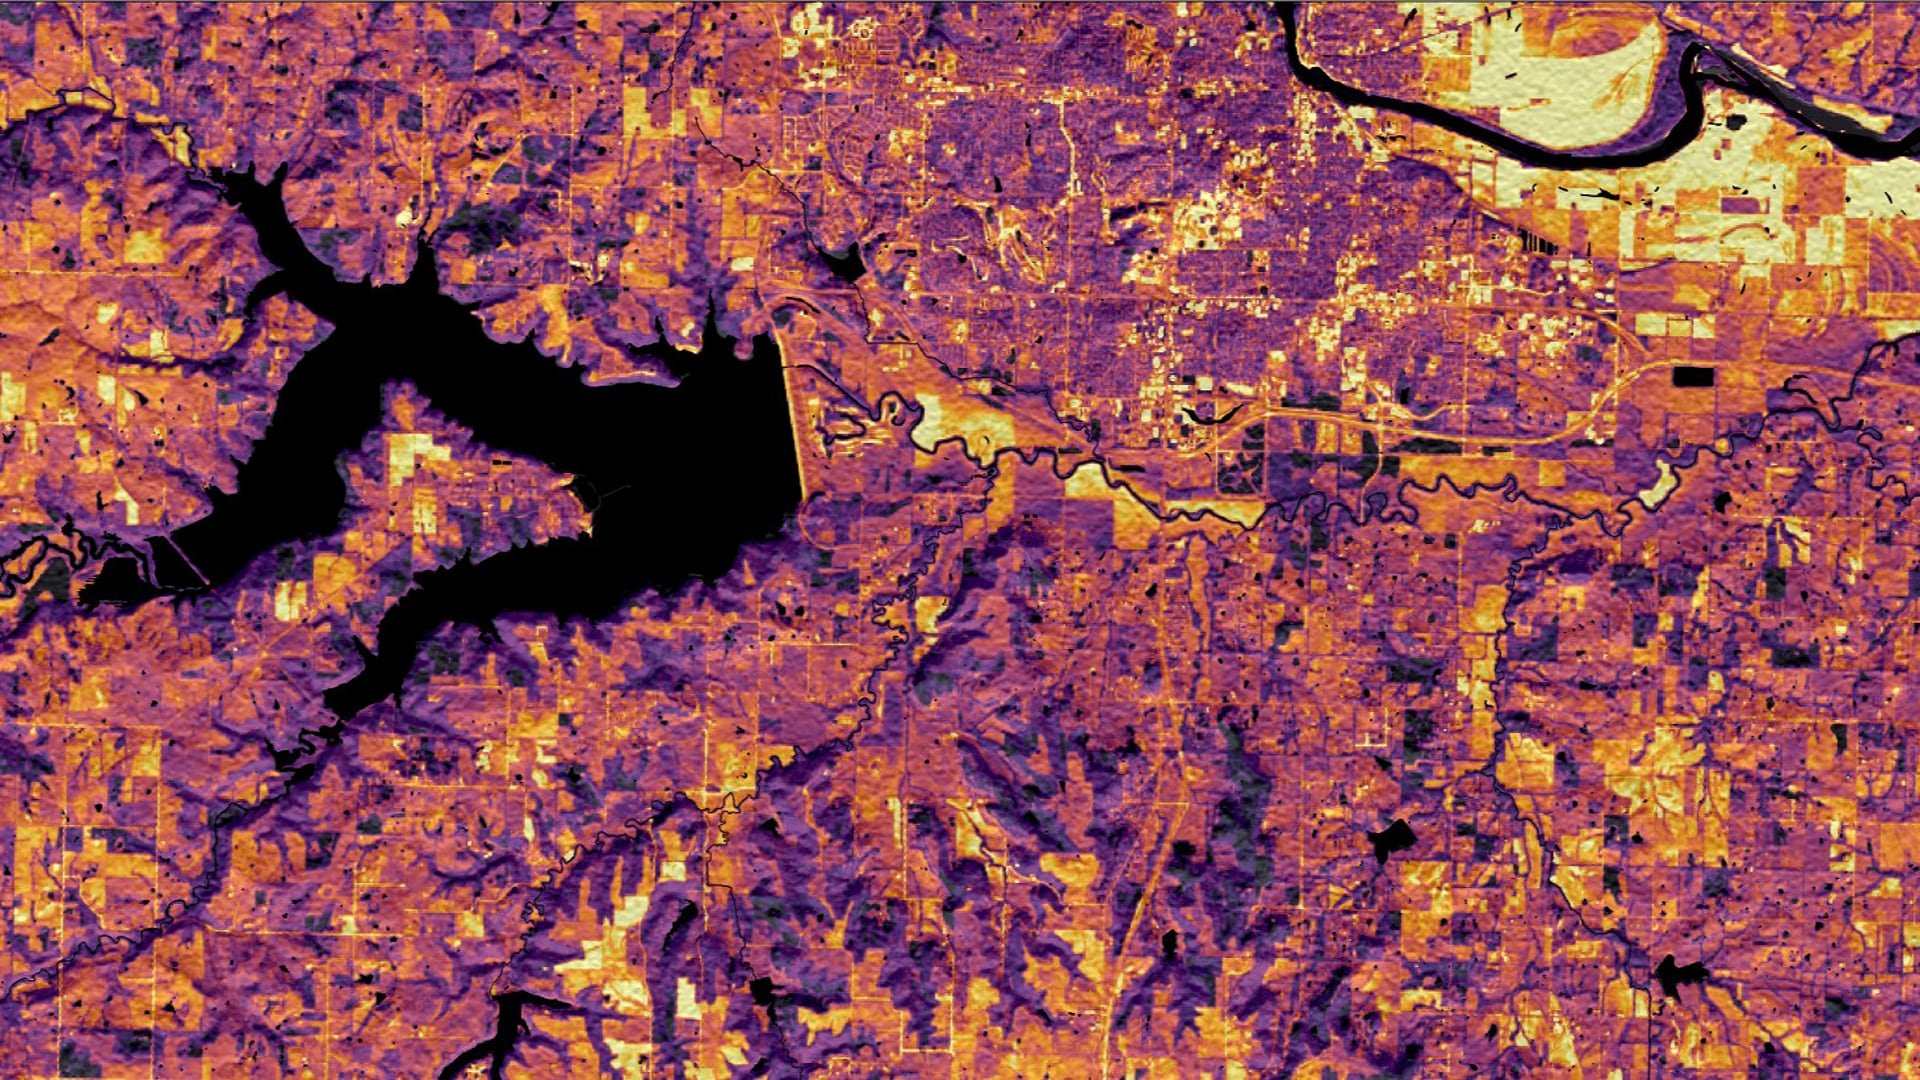
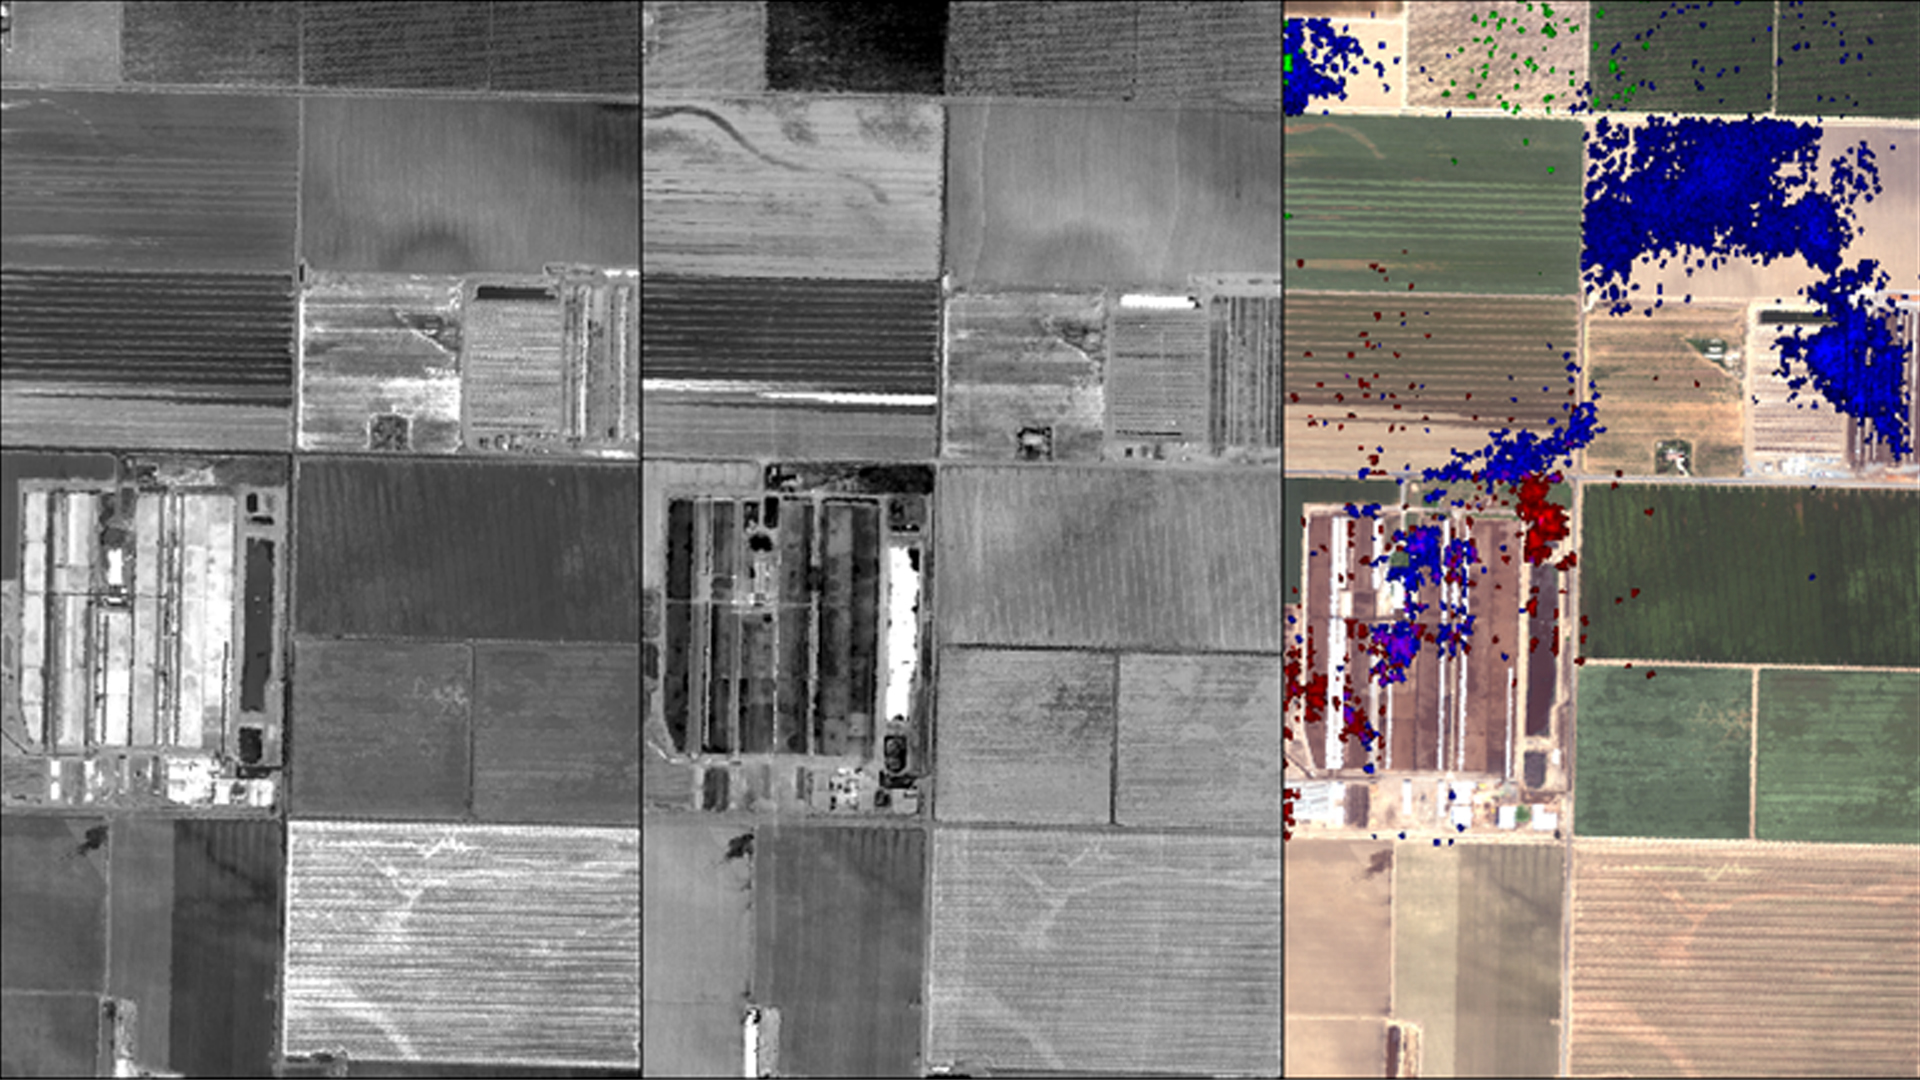
California’s Central Valley is one of the most productive agricultural regions in the United States, producing a fourth of the nation’s food supply. The water demand in this region is heavily dependent on groundwater resources, resulting in over pumping of...

Principal Investigator

Ryan Slapikas

Imagen
Landsat 8 Operational Land Imager multi-year composite 2017 to 2019. The false color band combination 4, 3, 2 shows land cover distinctions of Southern Panay Island in the Philippines. Primary Forest is represented by the darker red shade along the center. Lighter shades of red indicate Secondary Forest cover. Distinct shades of brighter blue characterize urban areas of the island. Displaying differences in land cover can assist with identifying favorable habitats for endemic species.  Keywords: Visayan Islands Ecological Forecasting

The islands of Negros and Panay in the Philippines contain the last existing habitat for the critically endangered Visayan spotted deer (Rusa alfredi) and Visayan warty pig (Sus cebifrons). NASA DEVELOP partnered with the Arizona Center for Nature Conservation –...

Principal Investigator

Robert Cecil Byles

Imagen
A 30-meter resolution map from a 4/26/2019 Landsat 8 OLI image with a tasseled cap brightness transformation overlaid on a solar insolation map derived from a 9/23/2014 DEM created with the SRTM C-Band. Lawrence, Kansas, is featured here. Bright yellow signifies areas with high surface reflectance, indicating bare soil and rooftop areas ideal for solar panels. Darker purple signifies areas of low surface reflectance, indicating forest and wetland locations not ideal for solar panels.

The City of Lawrence and Douglas County, Kansas, are working to reduce greenhouse gas emissions and achieve 100 percent renewable energy. The NASA DEVELOP team used Shuttle Radar Topography Mission (SRTM) and LiDAR elevation data along with Landsat 8 Operational...

Principal Investigator

Kate Markham

Imagen
The Enhanced Vegetation Index (EVI) quantifies vegetation greenness over a dense canopy section of Southern Costa Rica using a Landsat 8 OLI composite from 11-01-2018 through 12-31-2019. The coral to pink hues indicate healthier vegetation, the orange to gray indicate less healthy vegetation. The black indicates the absence of vegetation and the river is rendered in aqua. This image illustrates the variability of vegetation health to allow stakeholders to identify areas of sparse vegetation.  Keywords: Eder Hernandez, Sharifa Karwandyar, Kate Markham, Teodora Mitroi, EVI, Landsat 8 OLI, Southern Costa Rica

Seven percent of all scientifically known life forms lie within the 202,230 square miles of Central America, making this area ecologically unique and increasing the need for environmental management. The Mesoamerican Biological Corridor forms a conservation partnership throughout Central America...

Principal Investigator

Zac Peloquin

Imagen
Assessing and Assisting Monitoring Efforts of Water Clarity to Identify Potential Areas of Submerged Aquatic Vegetation (SAV) in the Chesapeake Bay

Bromus tectorum, otherwise known as cheatgrass, is an invasive grass from Europe that has increased its presence all over the world by out-competing native grasses due to its adaptability and lifecycle. During the end of its life cycle, typically occurring in the summer, its flammable...

Principal Investigator

Li-Wei Lin

Imagen
Enhanced Vegetation Index (EVI) calculated from Landsat 8 Operational Land Imager(OLI) in 2019.  Central New York is a high production region for maple syrup. Purple pixels indicate urban or highly developed areas, black pixels indicate water, and darker green pixels represent highly vegetated areas. Areas of higher vegetation will be more suitable for sugarbush locations. This will help maple producers identify suitable sugar maple tree habitats.  Keywords: EVI, Landsat 8 OLI, sugarbush, New York

Variable climate, anomalous weather conditions, and other environmental stressors impact sugar maples (Acer saccharum), the main source of maple syrup in the Northern Forest region. Maintaining sugar maple health and current syrup production levels is vital for the region’s cultural...

Principal Investigator

Samantha Trust

Imagen
Solar insolation levels collected by Terra/Aqua Clouds and the Earth's Radiant Energy System (CERES) in 2019 were used as inputs for solar suitability and environmental sensitivity conflict maps to inform solar developers of overlap between areas desirable for solar farms and nearly threatened species habitats. The darkest magenta designates the most environmentally sensitive areas, the darkest shade of blue indicates the highest level of solar suitability, while levels of conflict are shown in shades of purple.   Keywords: LUCIS, CERES, Solar Energy, Georgia, Samantha Trust​

The rapid expansion of the solar industry across the state of Georgia has a detrimental effect on the habitats of keystone and threatened species, such as the gopher tortoise (Gopherus polyphemus) and the American black bear (Ursus...

Principal Investigator

Jacob Arndt

Imagen
Identifying Methane Emissions Patterns from Dairy Farms Using Aircraft Remote Sensing Observations and Image Classification

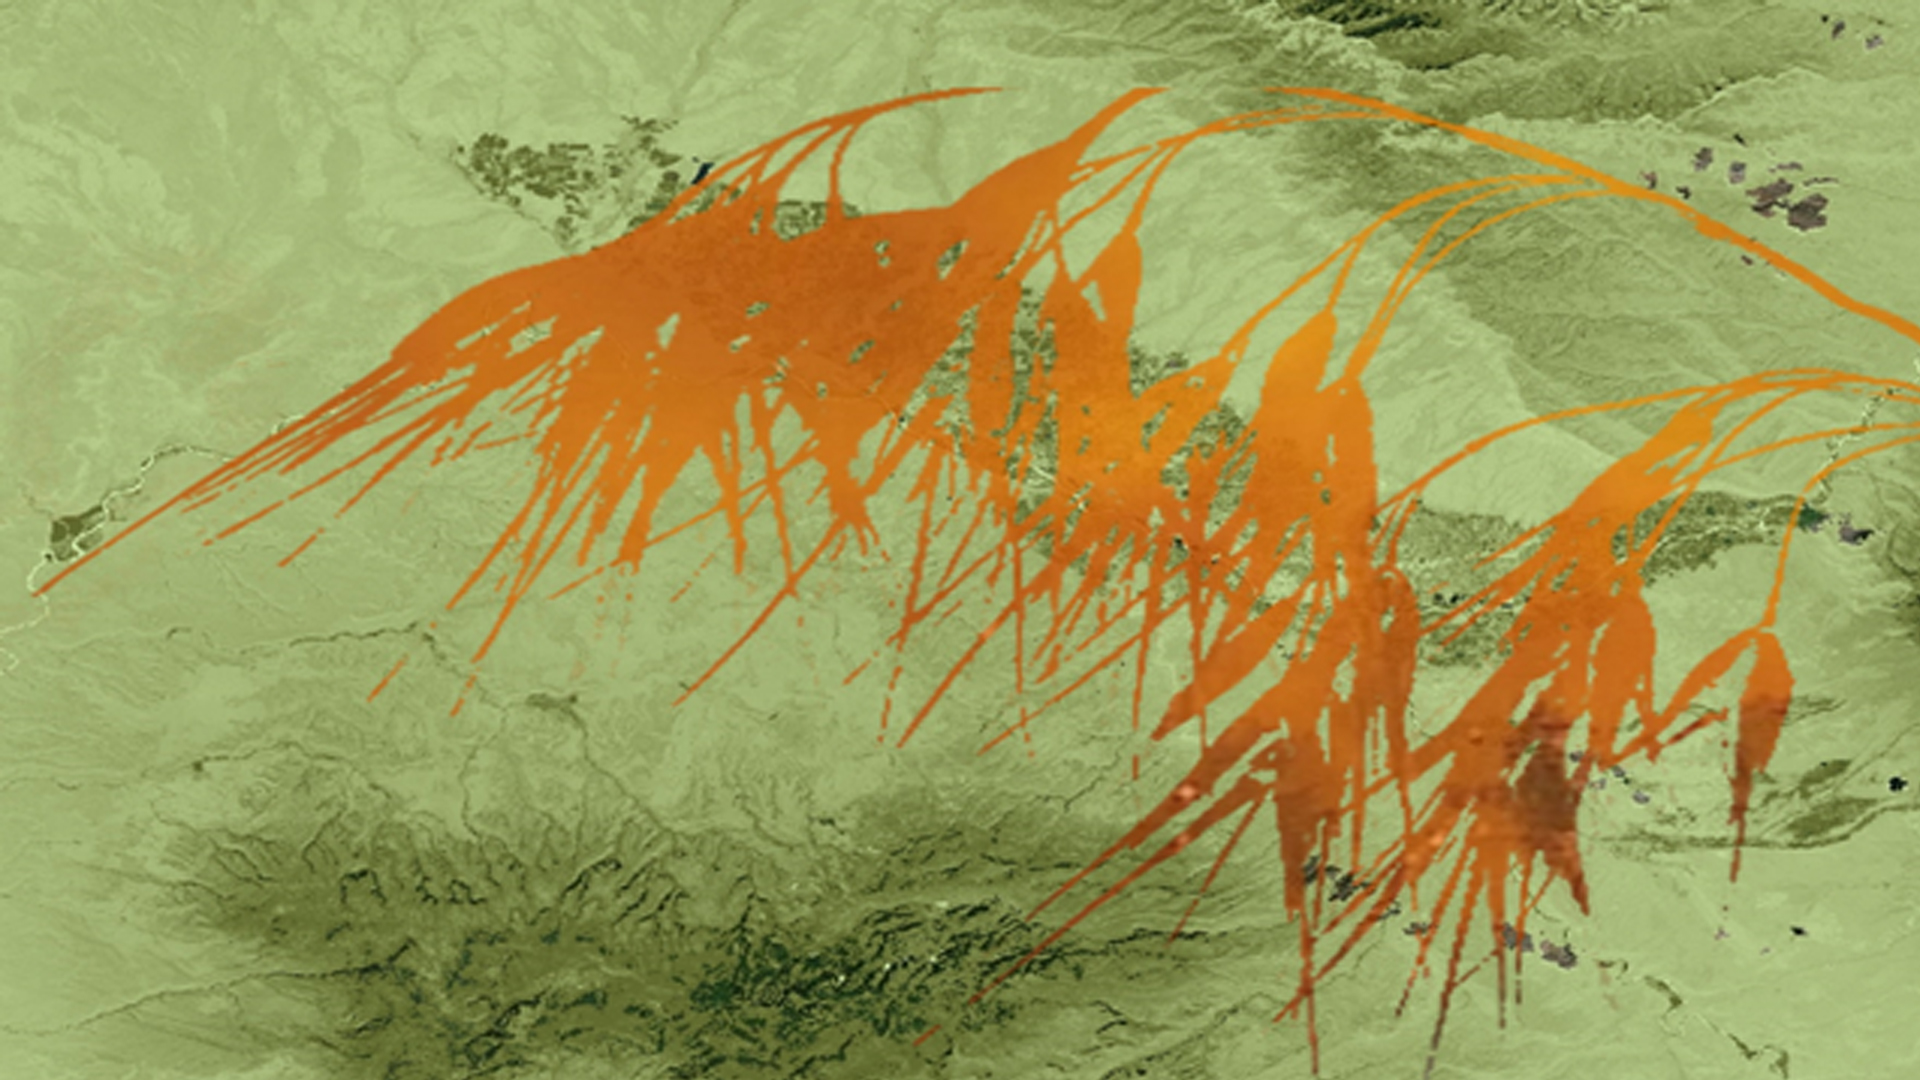
Methane (CH4) is a potent greenhouse gas (GHG) with a lifetime of less than 10 years and a global warming potential that is 25 times greater than carbon dioxide (CO2) over a 100 year time period. Between the energy, industrial processes and product use, agriculture...