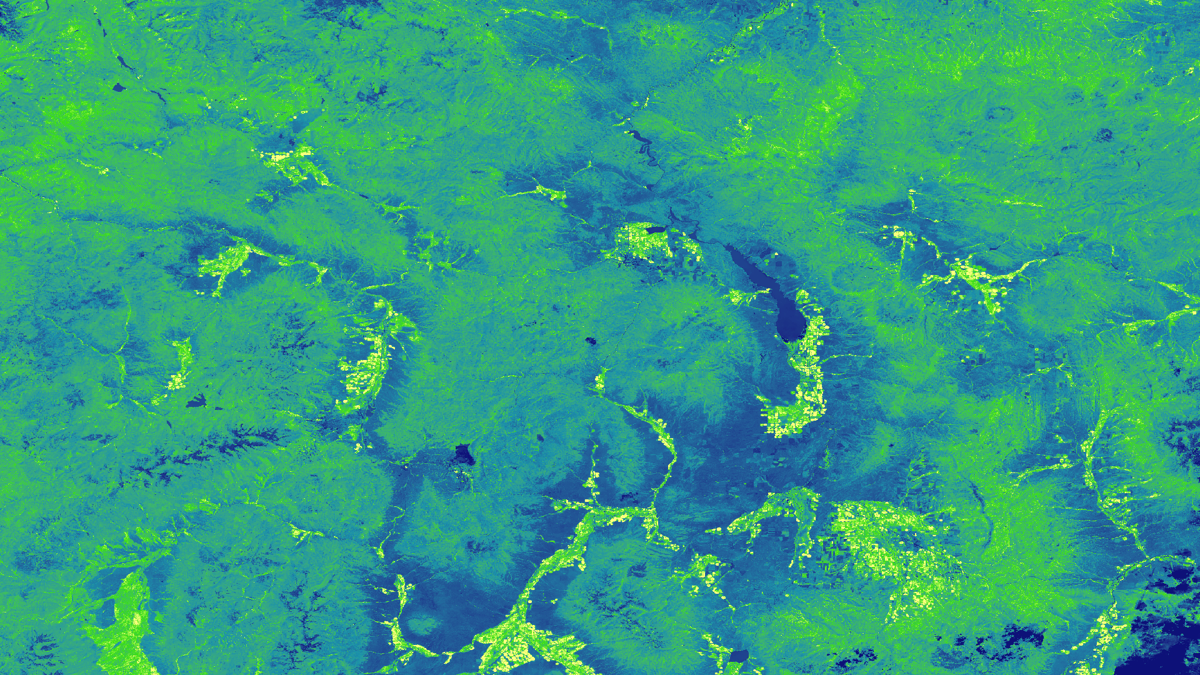
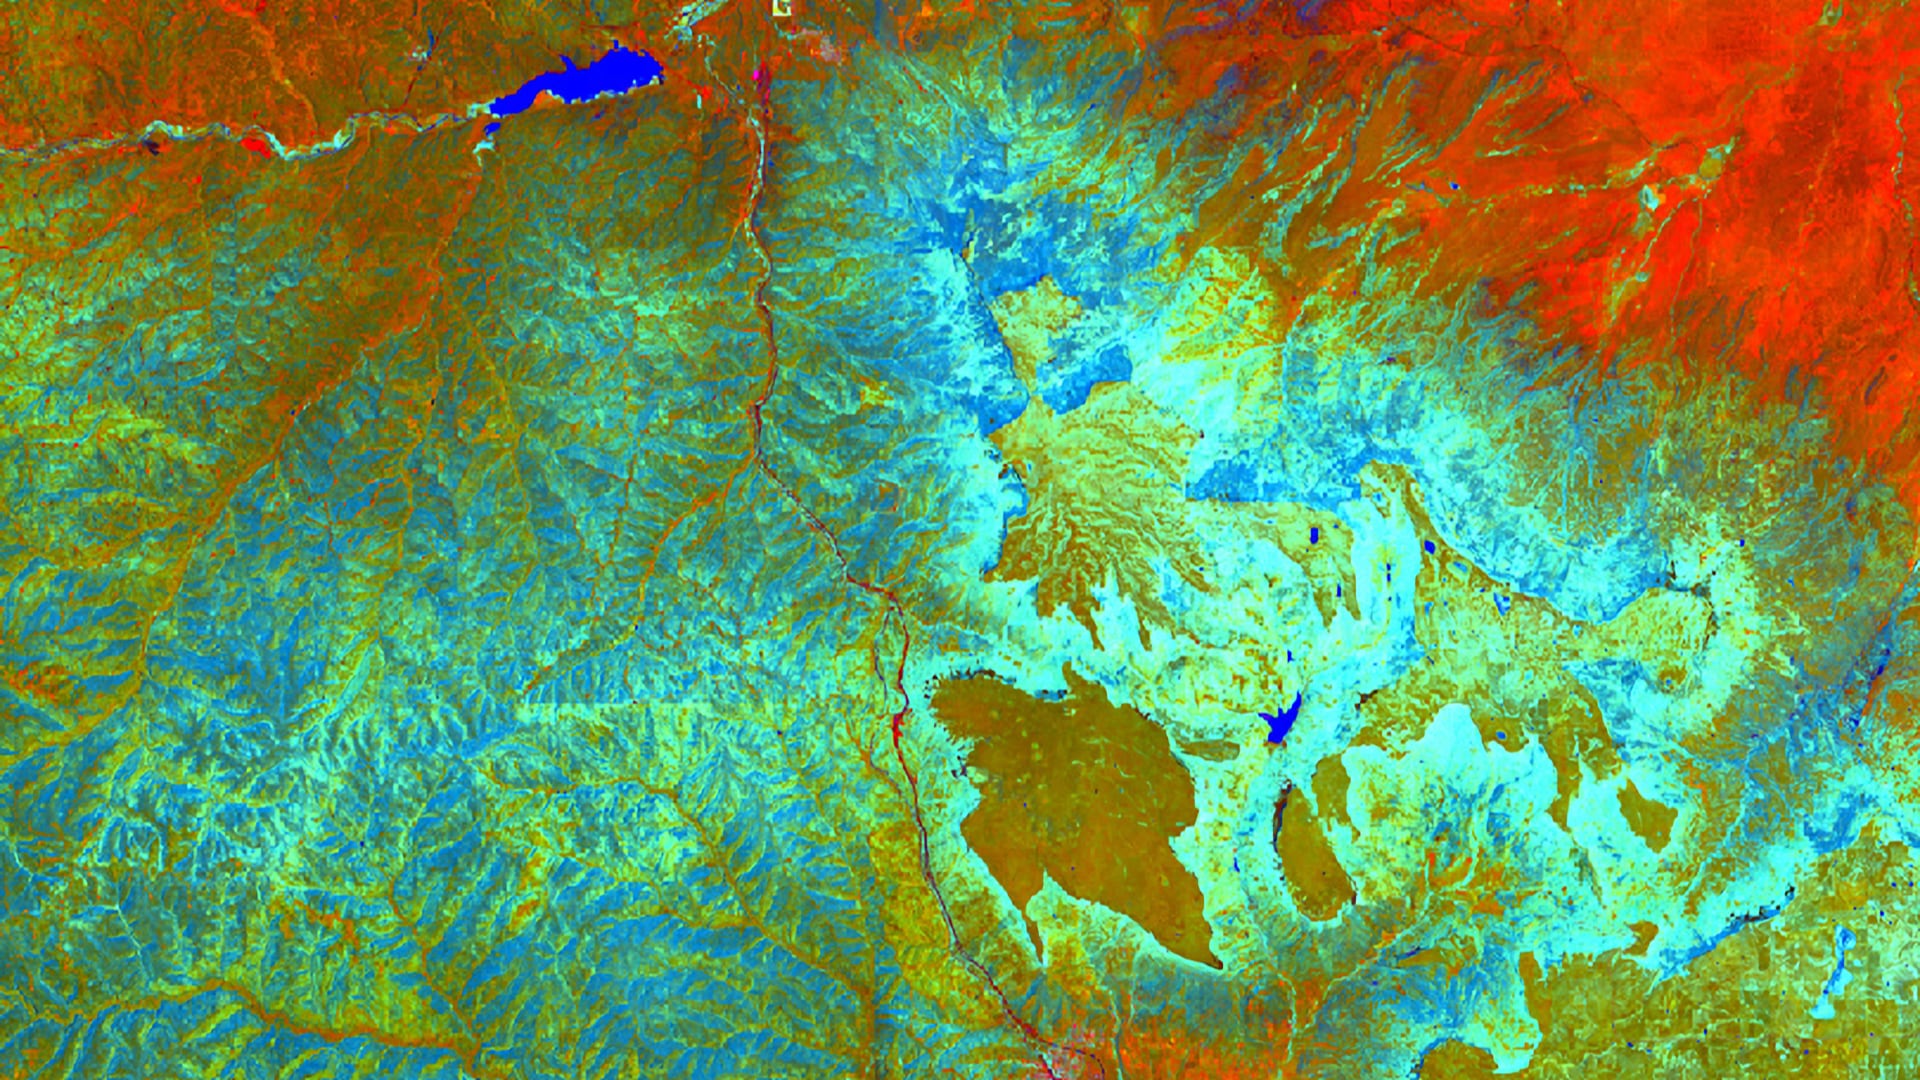
Principal Investigator

Ani Matevosian

Imagen
This image displays a portion of Eastern Washington State, on the leeward side of the Cascade Mountains. Lightning point data, derived from the ISS Lightning Image Sensor for the year 2018 is overlaid upon 2018 Landsat 8-OLI imagery processed for a Normalized Difference Moisture Index, for the May-October fire season. Sparks symbolize the point coordinates of lightning strikes. The red-orange color shows dry vegetation, while the forest green represents vegetation with a higher moisture content.  Keywords: Amelia Zaino, Ani Matevosian, Amy Kennedy, Evan Bradish, lightning, wildfires, Eastern Washington, vegetation moisture. Background map layer, credit: Esri, DigitalGlobe, GeoEye, Earthstar Geographics, CNES/Airbus DS, USDA, USGS, AeroGRID, IGN, and the GIS User Community

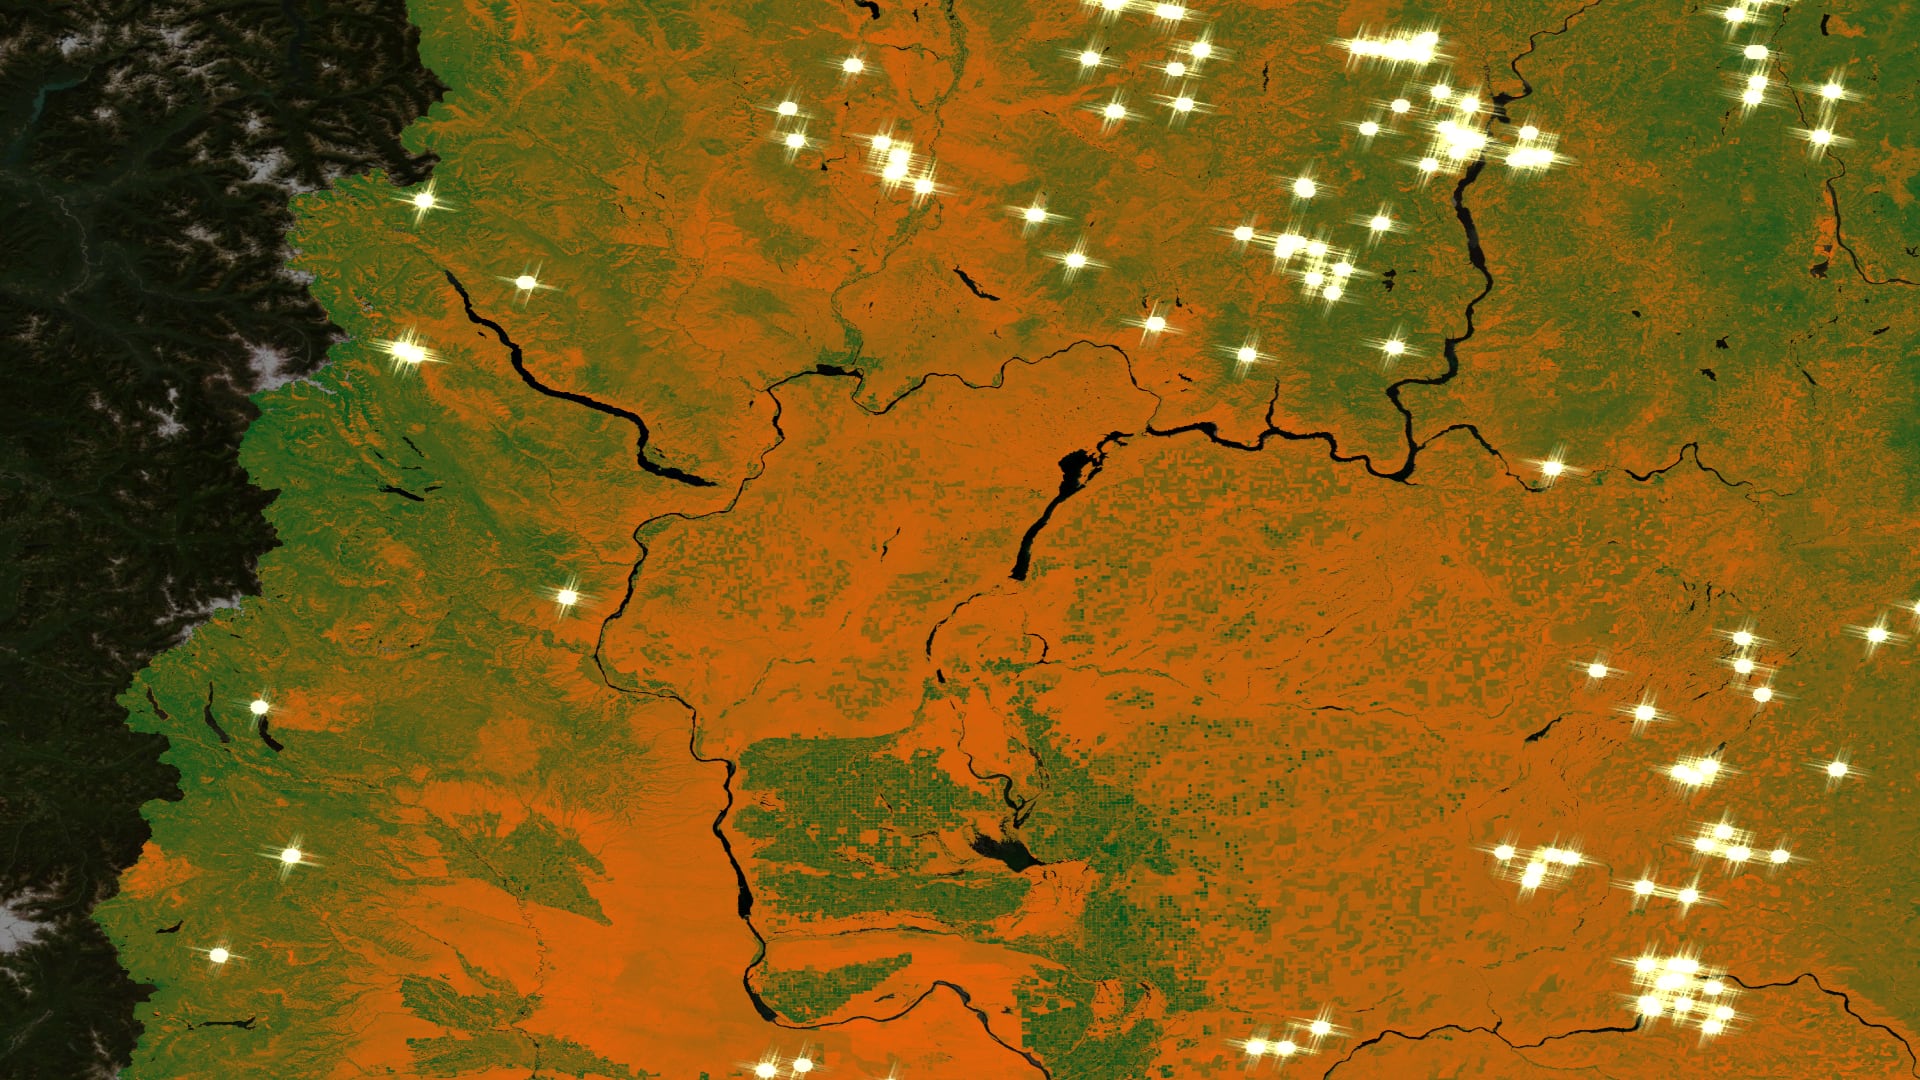
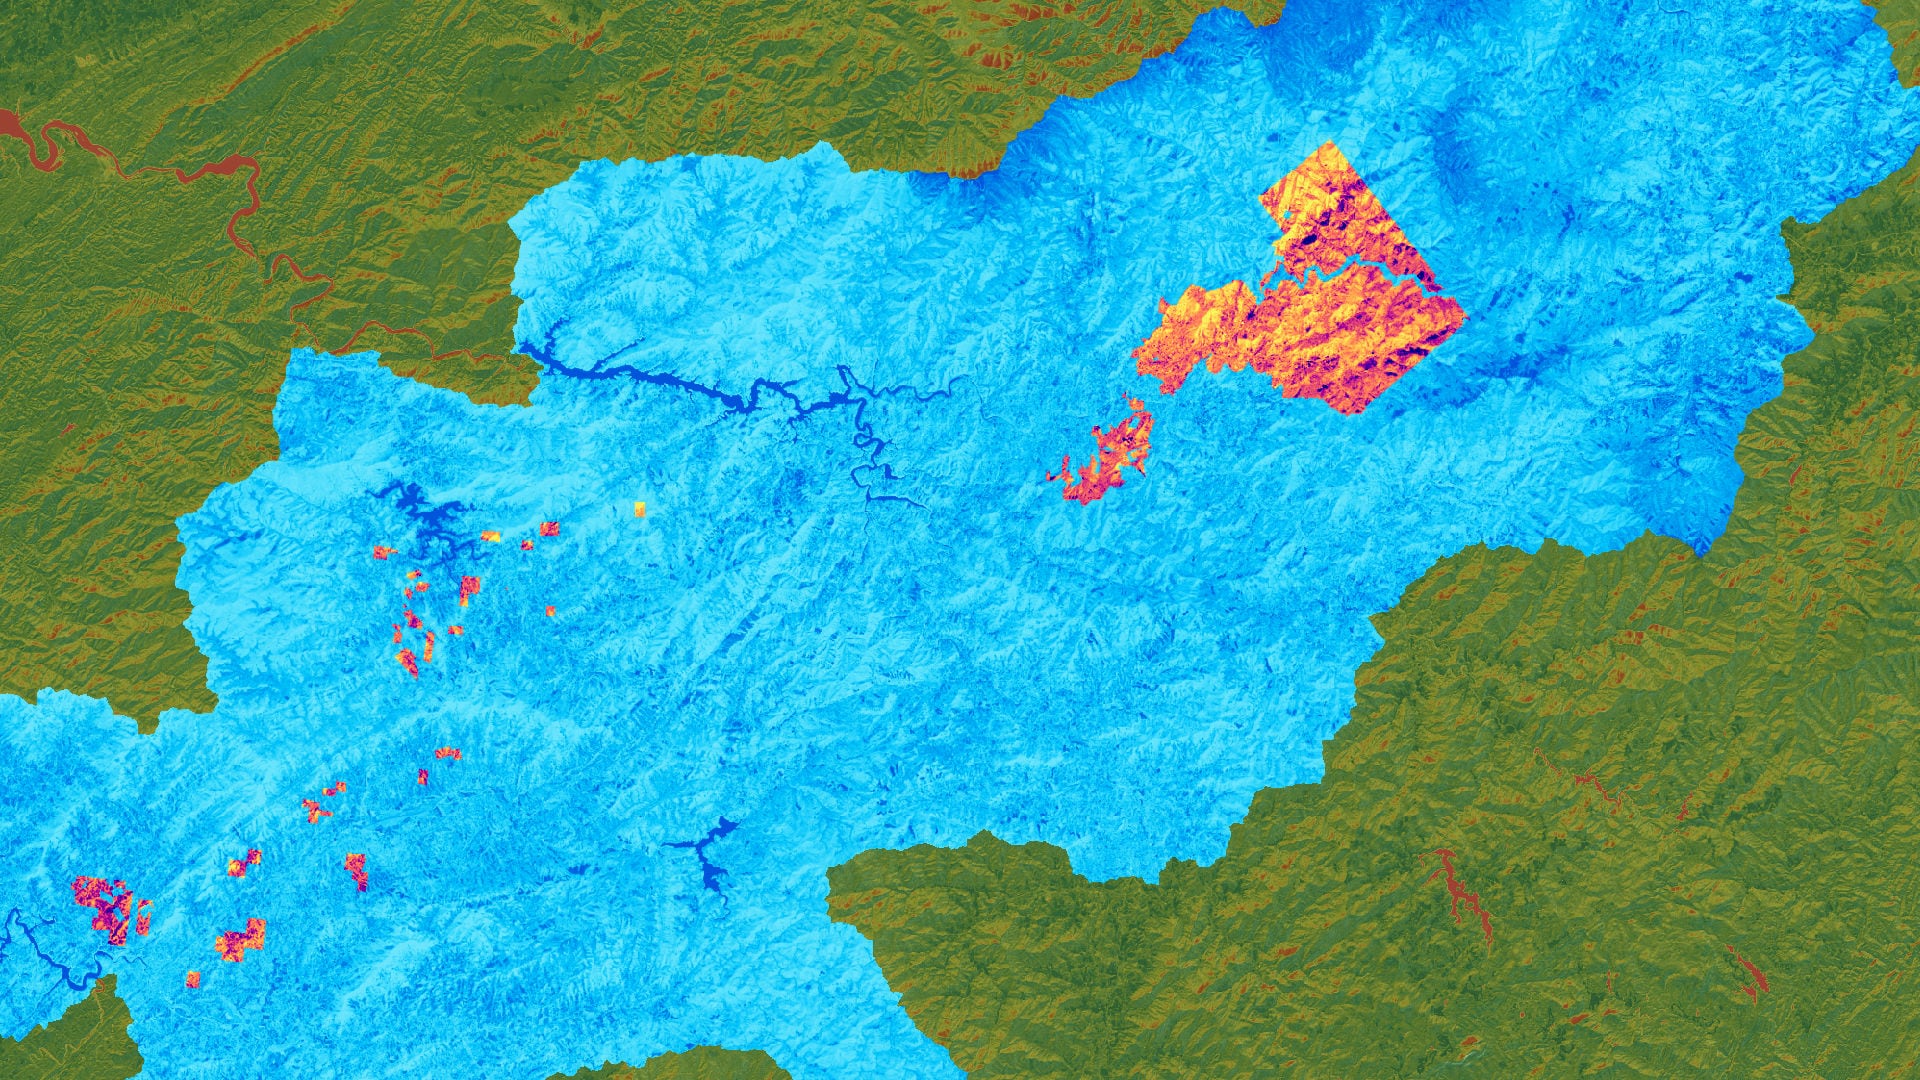
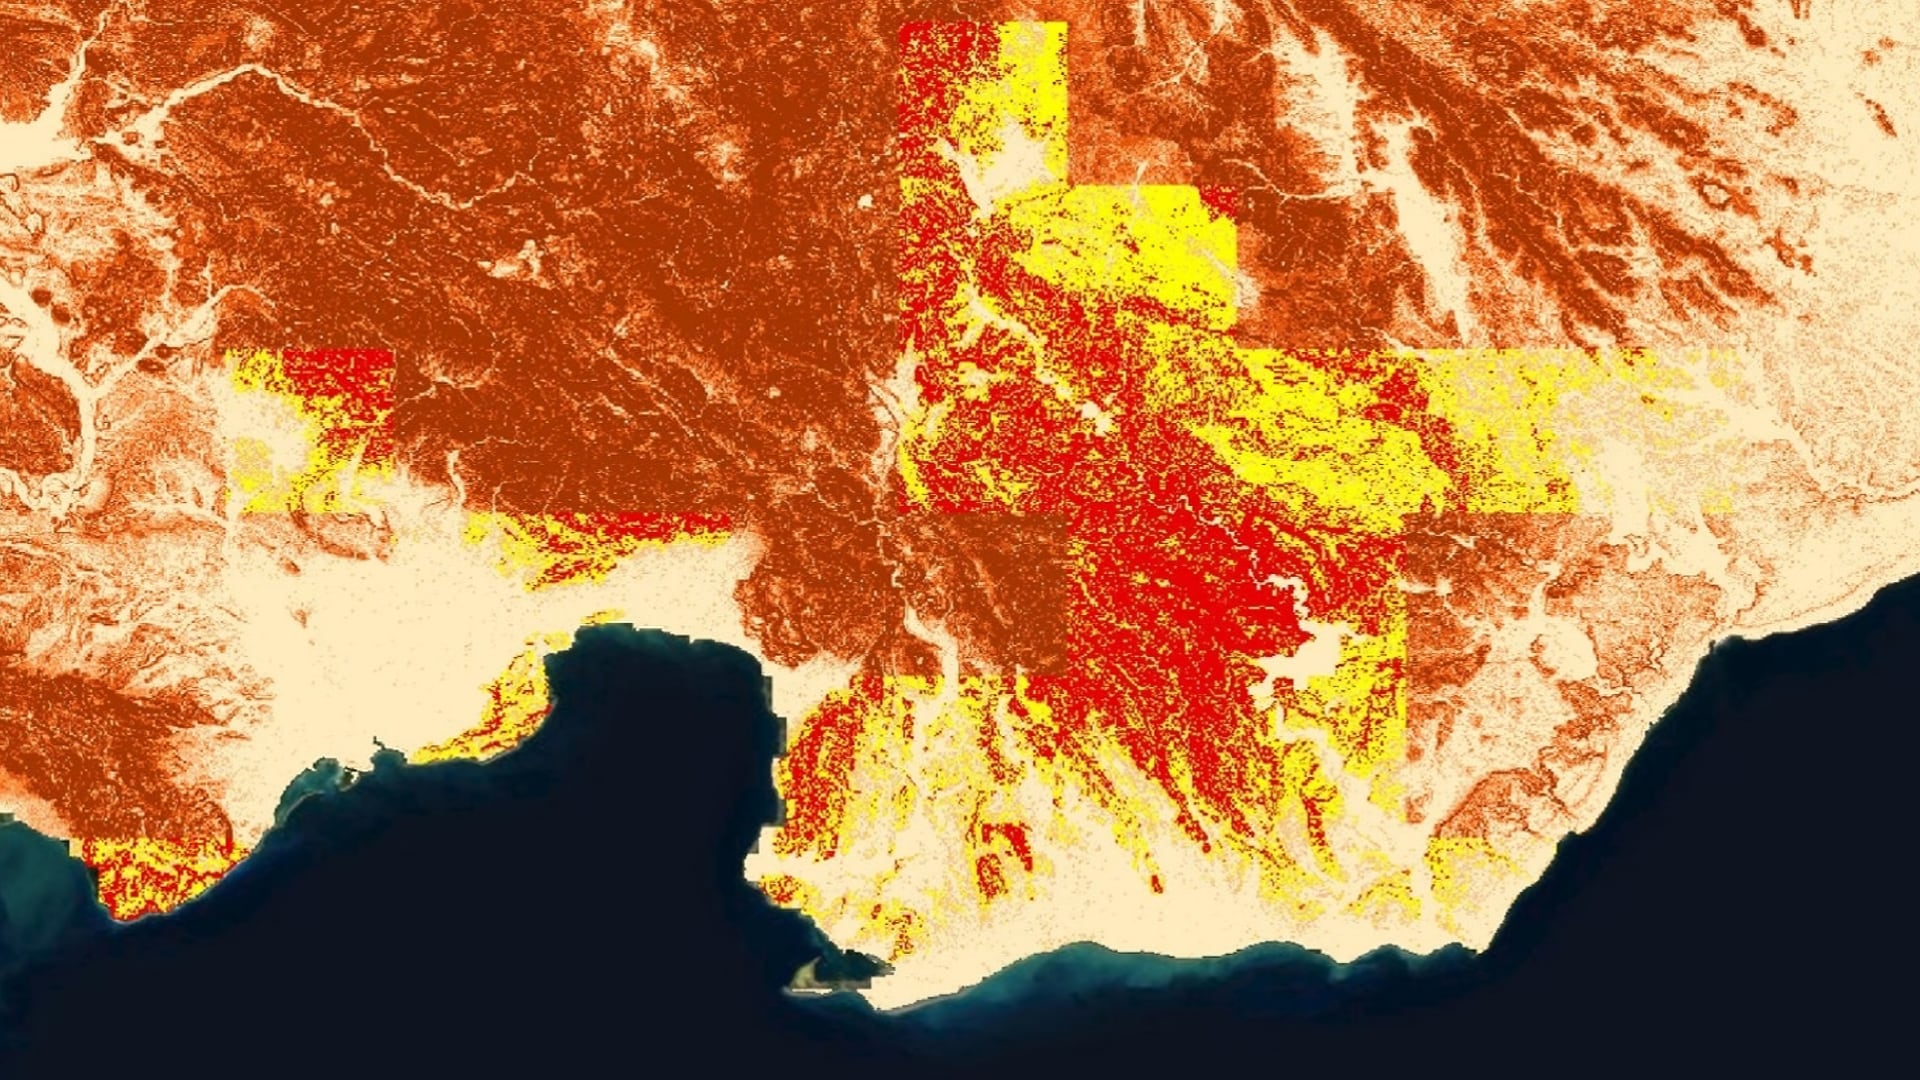
According to the Washington Department of Natural Resources, roughly 36% of large fires in the state since 2010 were caused by lightning. General trends also show a greater increase in the number of lightning-ignited fires over the last three decades...

Principal Investigator

Christine Evans

Imagen
Integrating NASA Earth Observations to Monitor Thunderstorms and Assess Lightning Exposure and Risk in the Hindu-Kush Himalayan Region

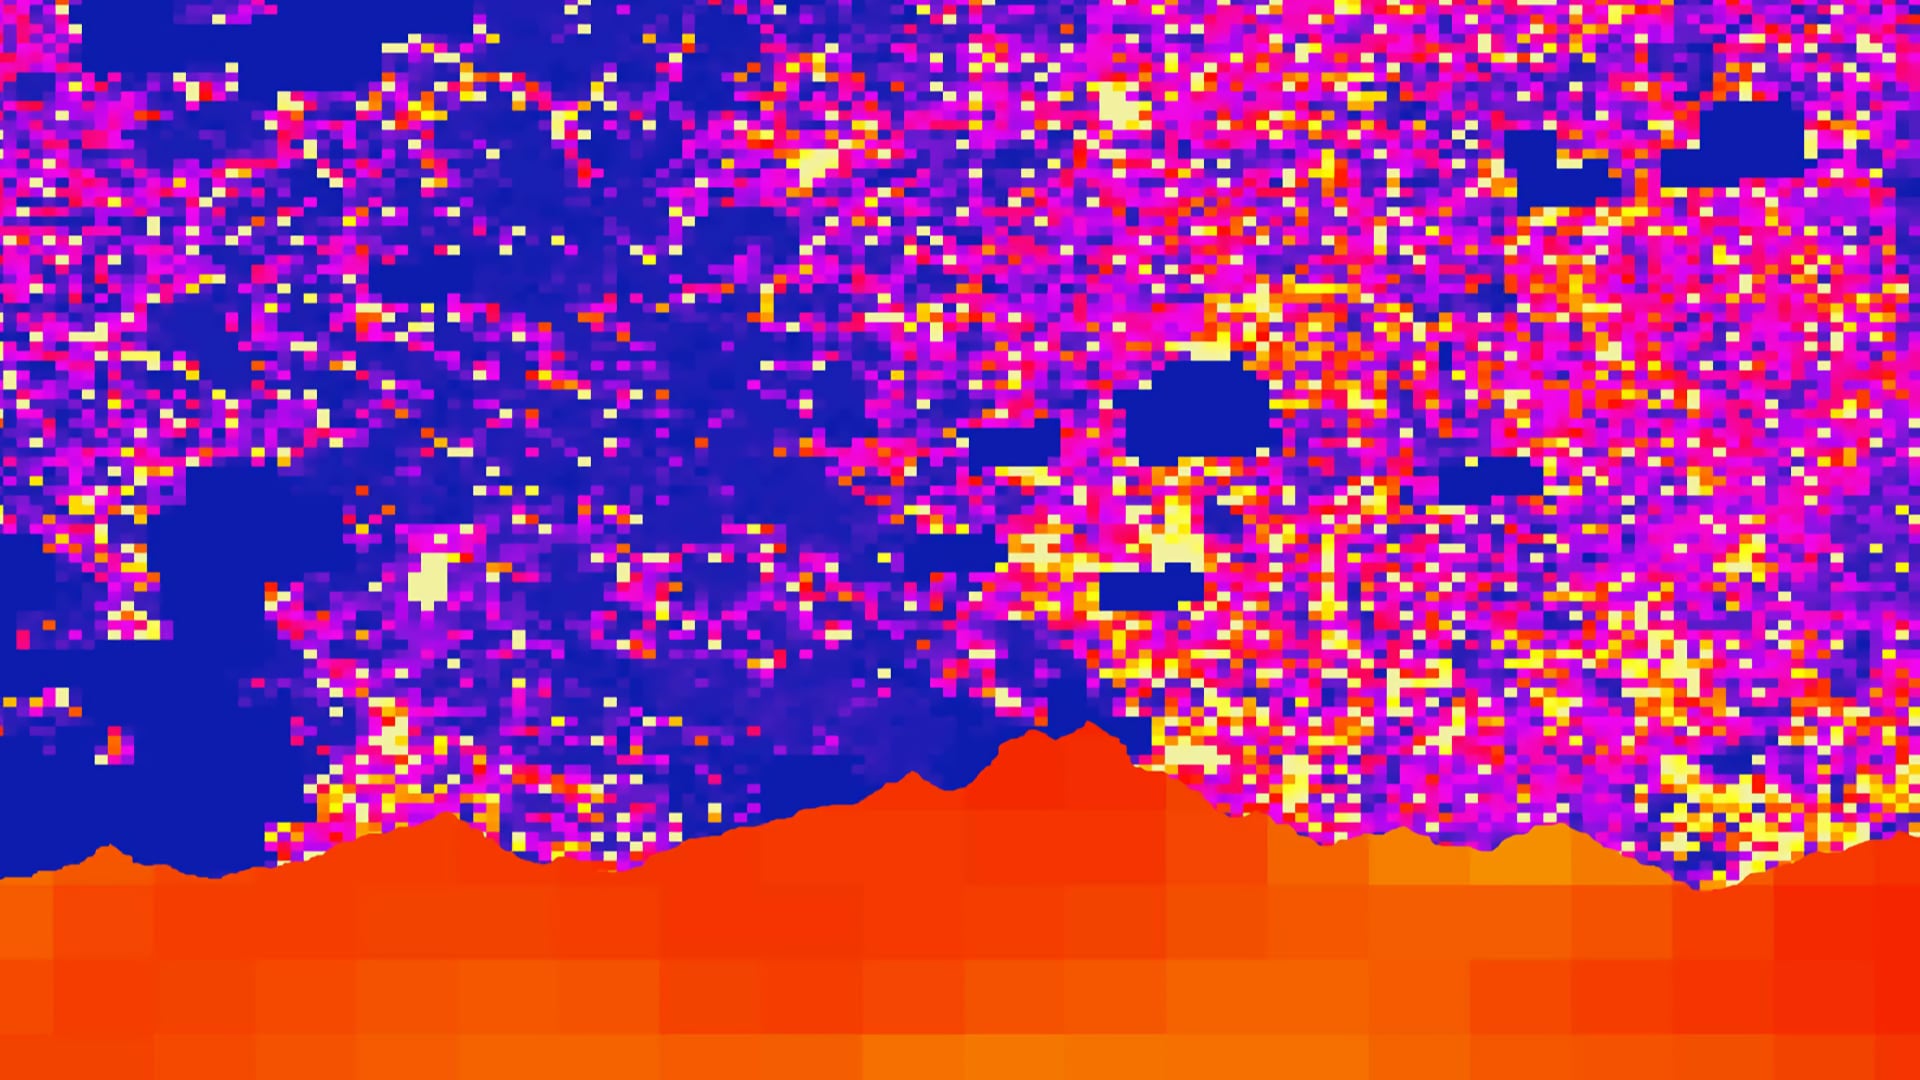
Intense thunderstorms throughout the Hindu-Kush Himalayan (HKH) region have resulted in an upsurge of lightning-related deaths due to an increase in population. Partnering with the NASA Global Hydrology Resource Center Distributed Active Archive Center, NASA SERVIR Science Coordination Office, Bangladesh Meteorological Department (BMD), Nepal Department...

Principal Investigator

Elizabeth Stapleton 

Imagen
Land use classification imagery using 2020 Landsat 8 OLI data, blended with a false color band combination (6,5,4), with the highway system overlayed in dark blue. Pictured is the Madre de Dios region of Peru, centered around the La Pampa illegal mining site. The light green indicates areas of gold mining, areas in pink represent wetlands, and areas in yellow represent forest cover. Tracking land use change allows agencies to understand where deforestation is occurring.  Keywords: Nelson Huffaker, Oliver Nguyen, Elizabeth Stapleton, Ariel Calle, Nataly Chacon

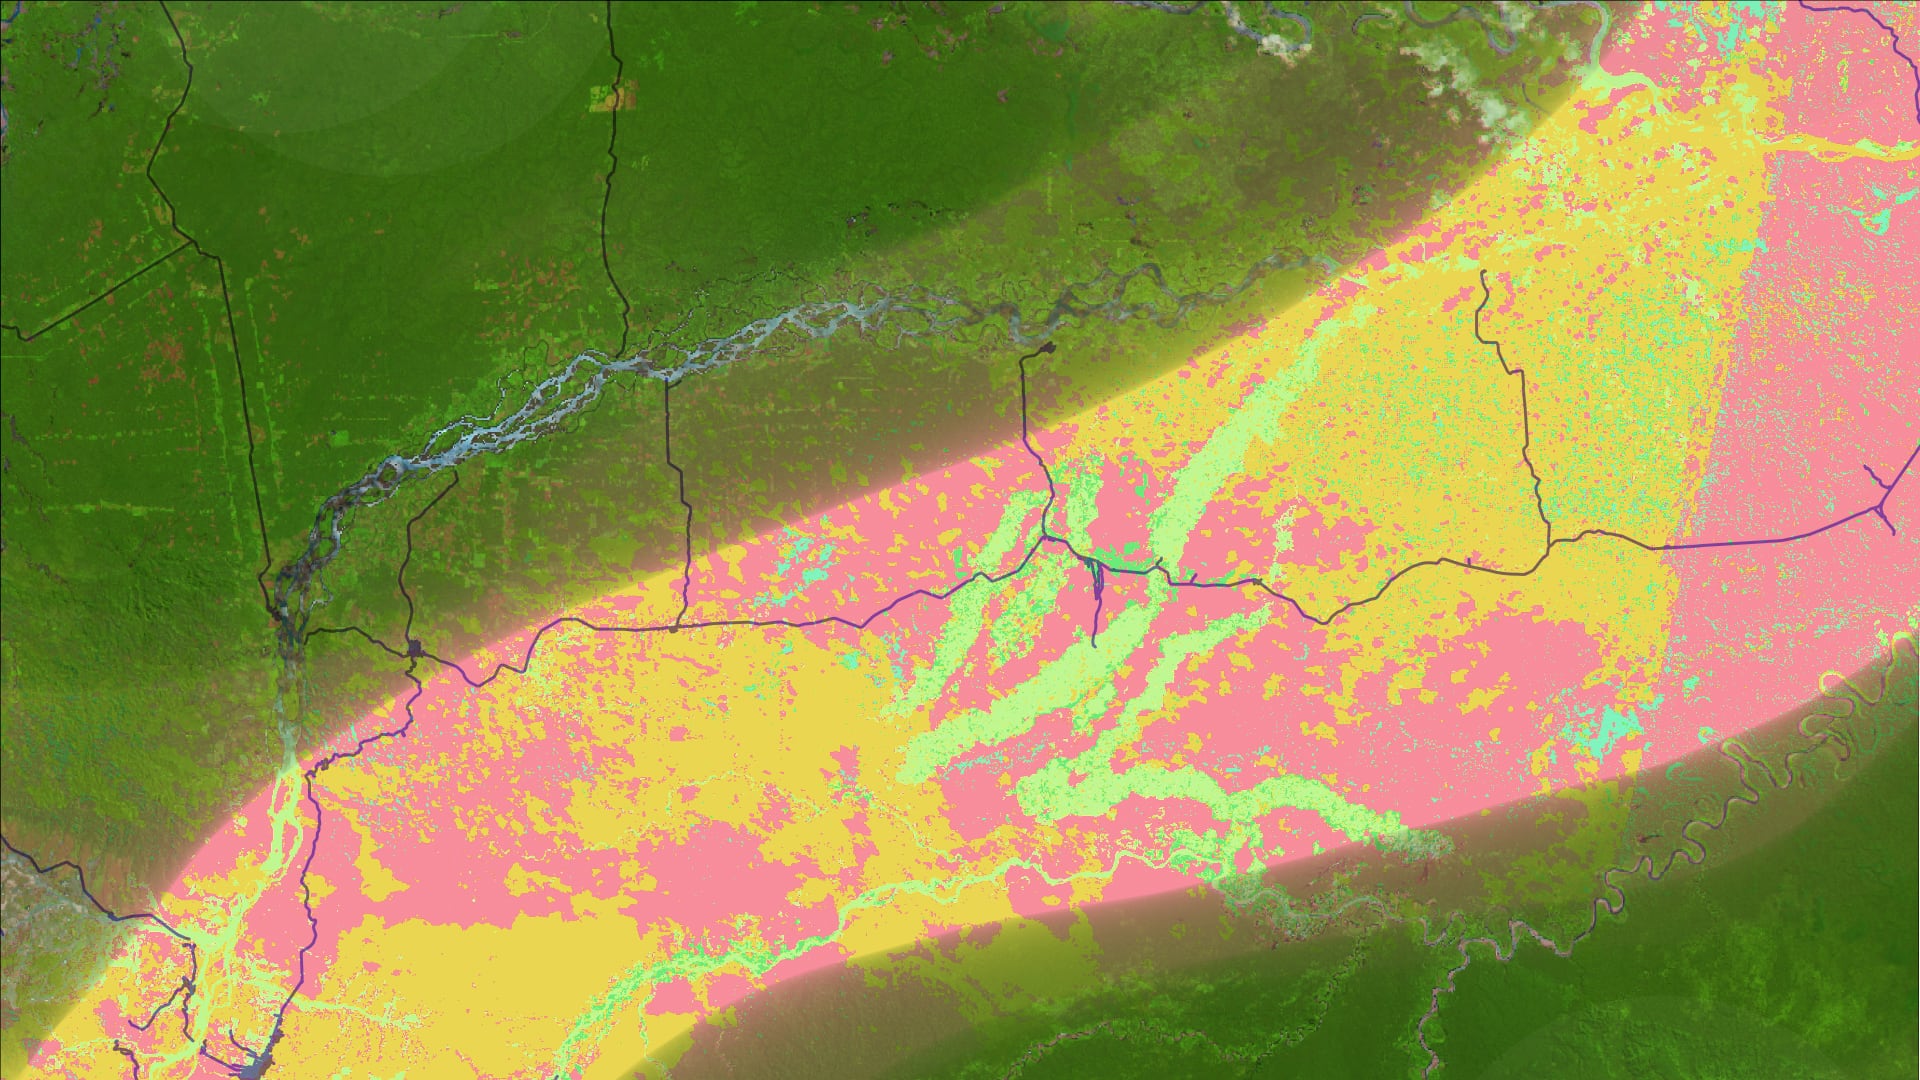
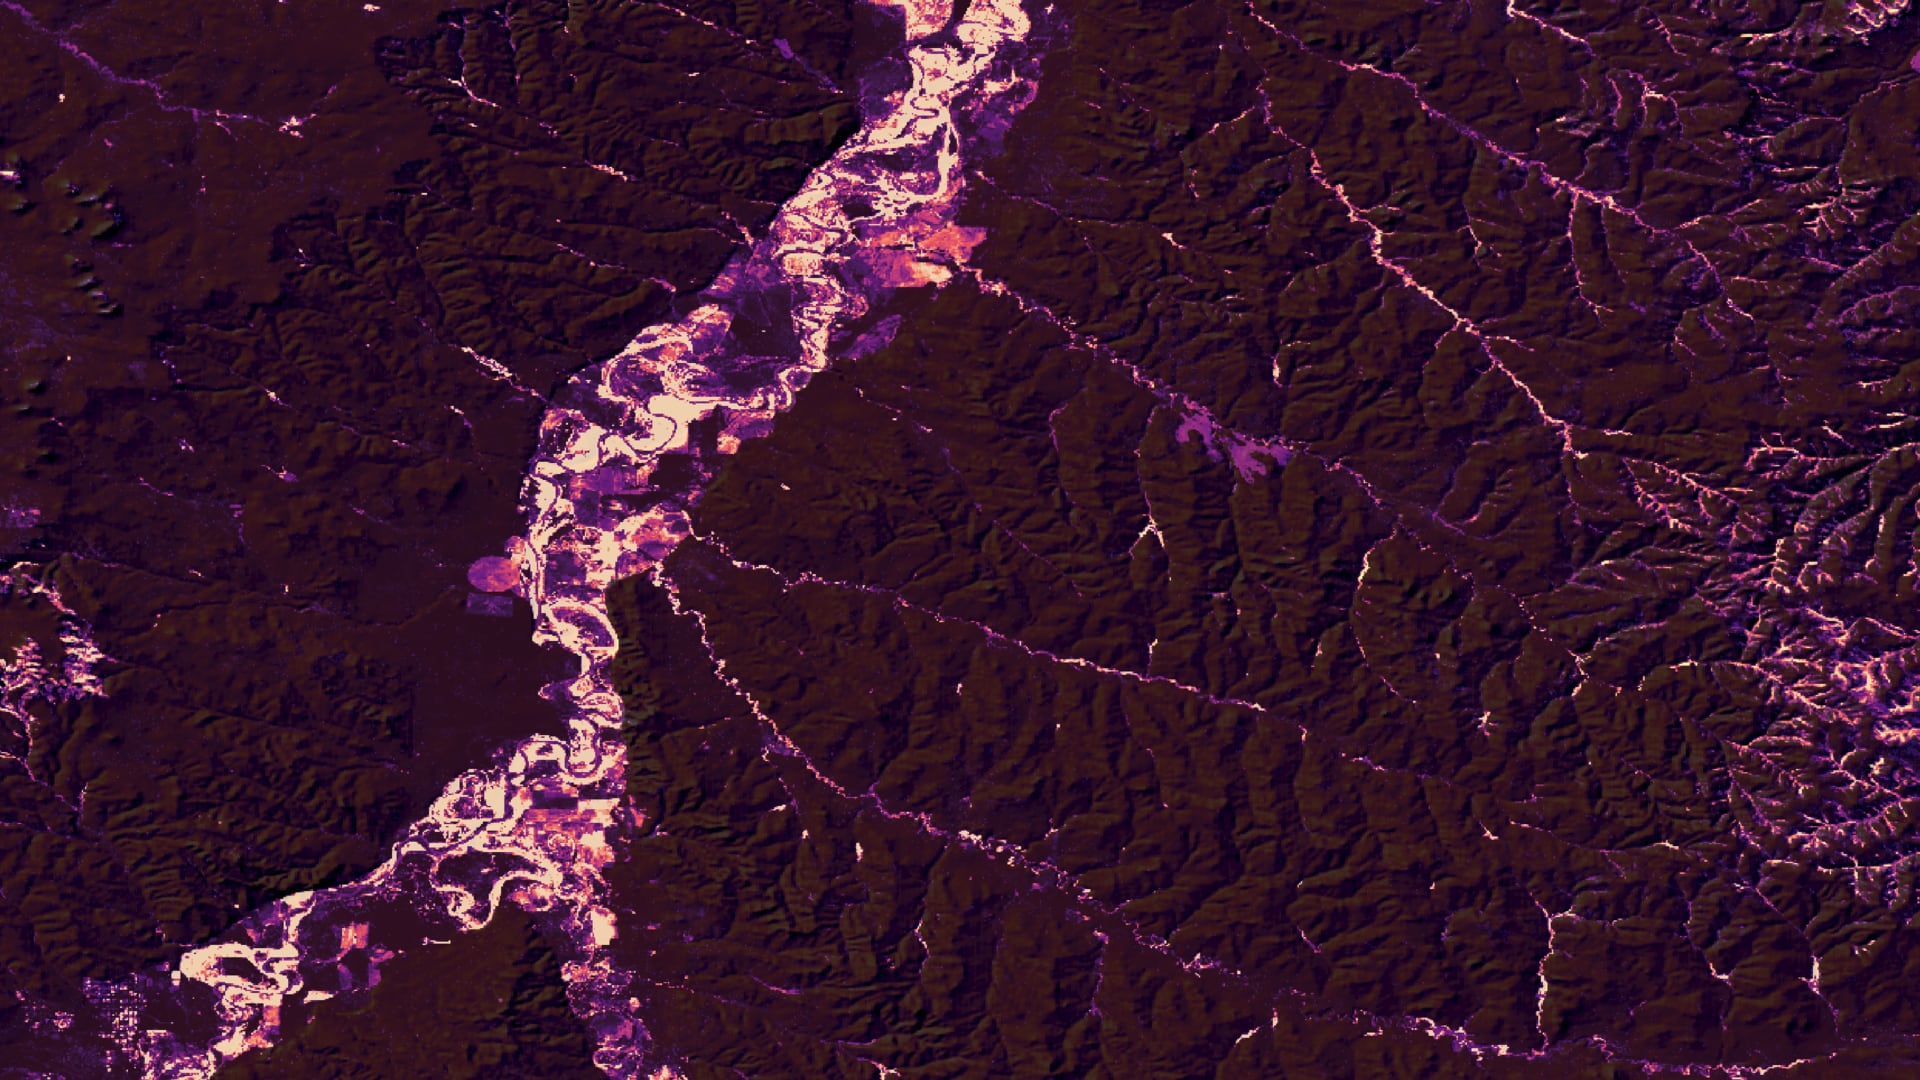
In the Madre de Dios region of the Peruvian Amazon, forests are being cleared for mining, timber harvesting, road construction, and hydroelectric dam development. These rapid land use changes are increasing human presence in previously sparsely-populated areas, disrupting ecosystems and increasing the...

Principal Investigator

Sophie Barrowman

Imagen
NDVI image of croplands in north-central Iowa derived from Landsat 8 OLI. The image is a cloud-removed, composite mean from all images available from June 2020 to July 2020. NDVI values, which indicate the level of photosynthetic activity, correspond from low-high with the orange-green color gradient. Farmers and agricultural researchers tasked with monitoring crop performance can use the data from an image like this to model crop yield and encourage sustainable agriculture practices.  Keywords: sustainable agriculture, NDVI, Google Earth Engine, agriculture, Landsat, crop diversification

Agriculture in the Midwest is dominated by monoculture systems that strip the soil of nutrients, decrease yields, and worsen water quality. Crop diversification and cultivating small grains is economically and ecologically advantageous, but limited in practice due to a lack...

Principal Investigator

Lauren Lad

Imagen
Composite of the area around Fisher's Peak State Park made of the Tasseled Cap coefficients Brightness, Greenness, and Wetness. Coefficients were calculated from a single Landsat 8 OLI TOA image from July 9, 2019. The red, green, and blue bands align with Brightness, Greenness, and Wetness, respectively, to showcase vegetation health and density. Greenness and Wetness are good indicators of biomass, and areas of lush vegetation can be seen in turquoise.   Keywords: Colorado, Landsat, Tasseled Cap, Biomass​

Fisher’s Peak is a 77.5 km2 property southeast of Trinidad, Colorado that is planned to become Colorado’s newest state park. The area has experienced limited anthropogenic disturbance and is home to an abundance of unique habitats and species. A...

Principal Investigator

Chloe Schneider

Imagen
Winter 2018-2019 Landsat 8 OLI-derived spectral indices used to investigate suitability of hemlock trees for the Eastern Band of Cherokee Indians (EBCI). EBCI owned land tracts are shown in a yellow-purple gradient representing Normalized Difference Built-Up Index, watersheds encompassing EBCI land are shown in a blue gradient representing Normalized Difference Moisture Index, and the surrounding study area is show in a red-green gradient representing NDVI and the leaf-on greenness of evergreen forest stands in winter.   Keywords: hemlock, evergreen, NDBI, NDVI, NDMI, EBCI, Landsat 8 OLI​

The Eastern Band of Cherokee Indians (EBCI) owns and manages more than 55,000 acres of land in the Southern Appalachian Mountains of western North Carolina. Most of these lands reside within the Oconaluftee River watershed. In this region and watershed...

Principal Investigator

Scott Harrison

Imagen
Compilation of processed provisional land surface temperature data from 1990-2019 acquired by Landsat 4-8. The City of New York, located in Southeast New York State is displayed. Blue hues represent areas where temperatures are less than the average mean. Orange to red hues show areas equal to or higher than the mean temperature. Areas in red are hotspots within the city. These are areas where policymakers should focus green initiatives on to reduce extreme heat.  Keywords: Landsat, Urban Heat, Hotspots, New York City, Extreme Weather

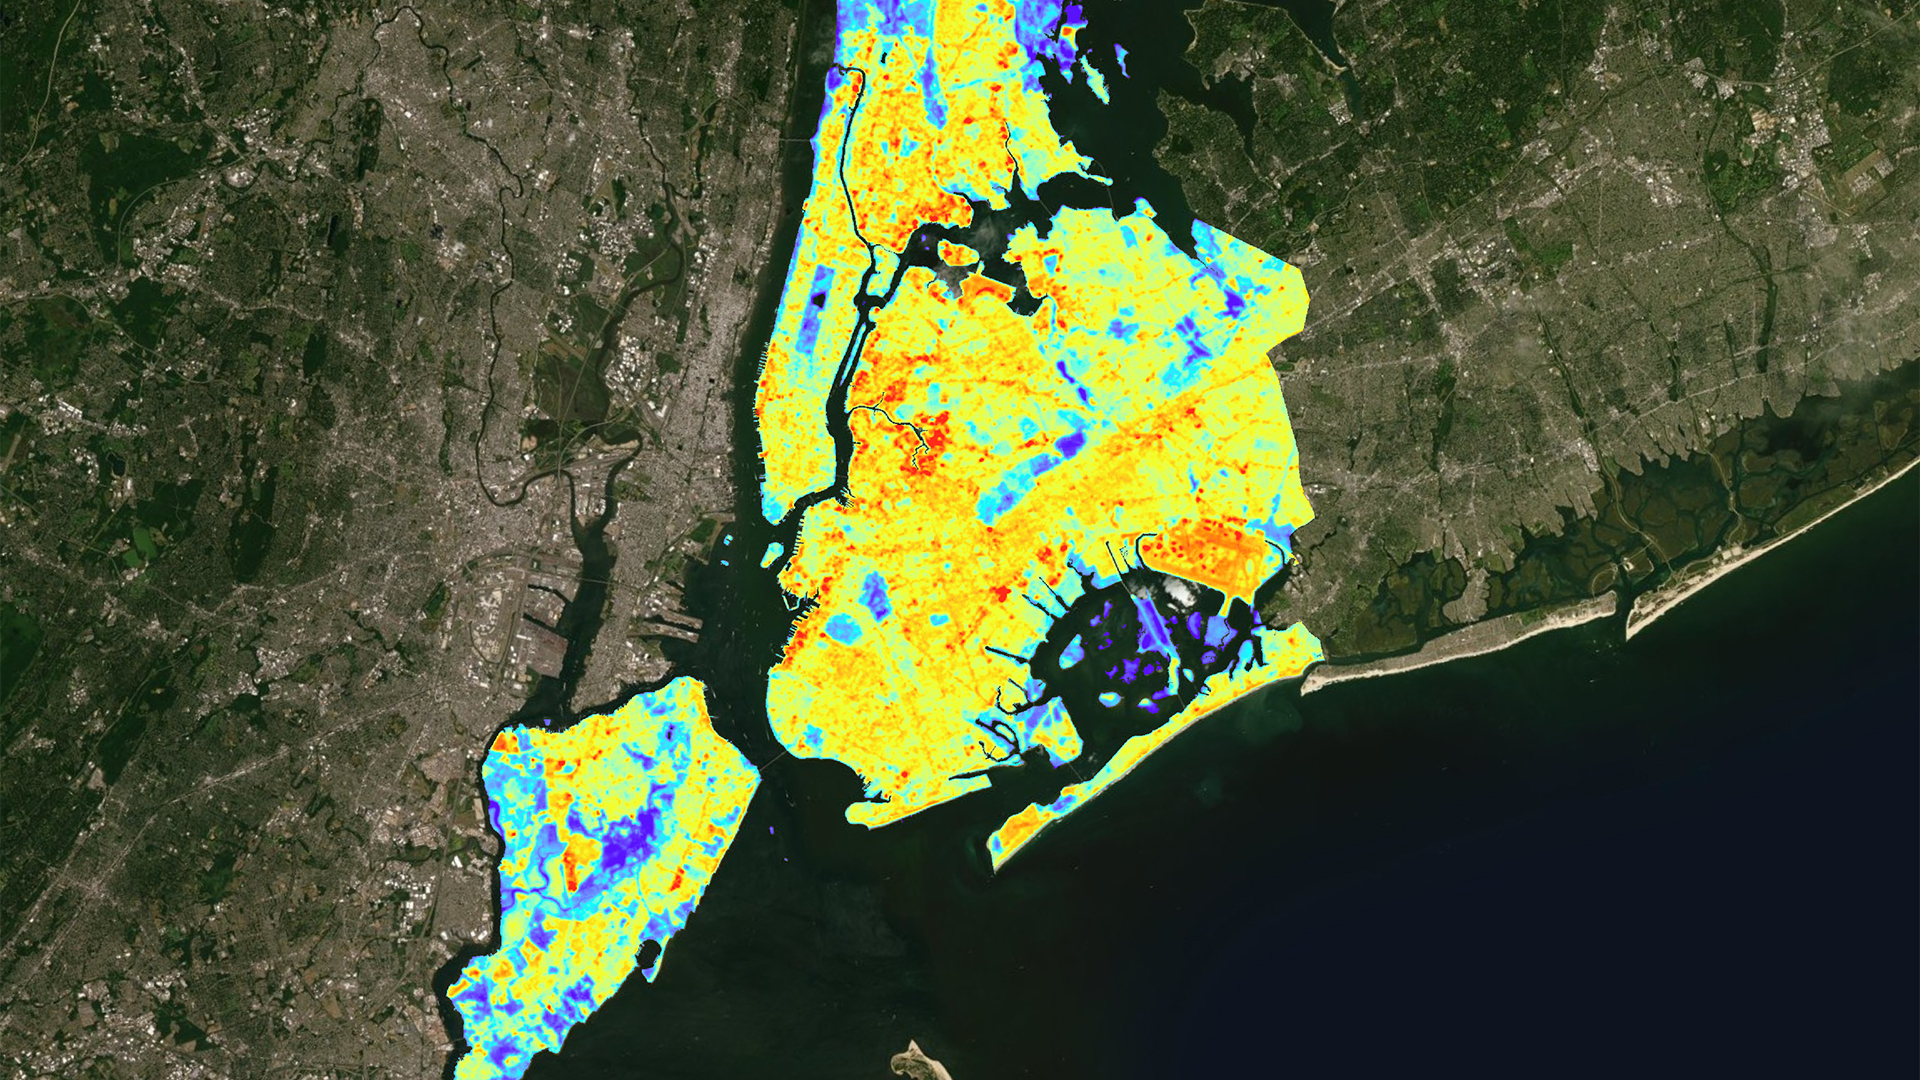
The effect of urban hotspots is a growing public health concern. In the face of climate change and urbanization, city dwellers are at increasing risk for heat-related illness and mortality. New York City (NYC) is especially vulnerable to heat-related illness...

Principal Investigator

Chiara Phillips

Imagen
NDVI-processed Landsat 8 OLI data over the Lower Omo River Valley on January 11th, 2018. Lighter colors indicate areas with high vegetation greenness while darker colors indicate less green vegetation and water. This will help decision-makers understand where agricultural areas are located in comparison to uncultivated lands.  Keywords: remote sensing, Landsat, Normalized Difference Vegetation Index, Tasseled Cap, agro-business, land cover change

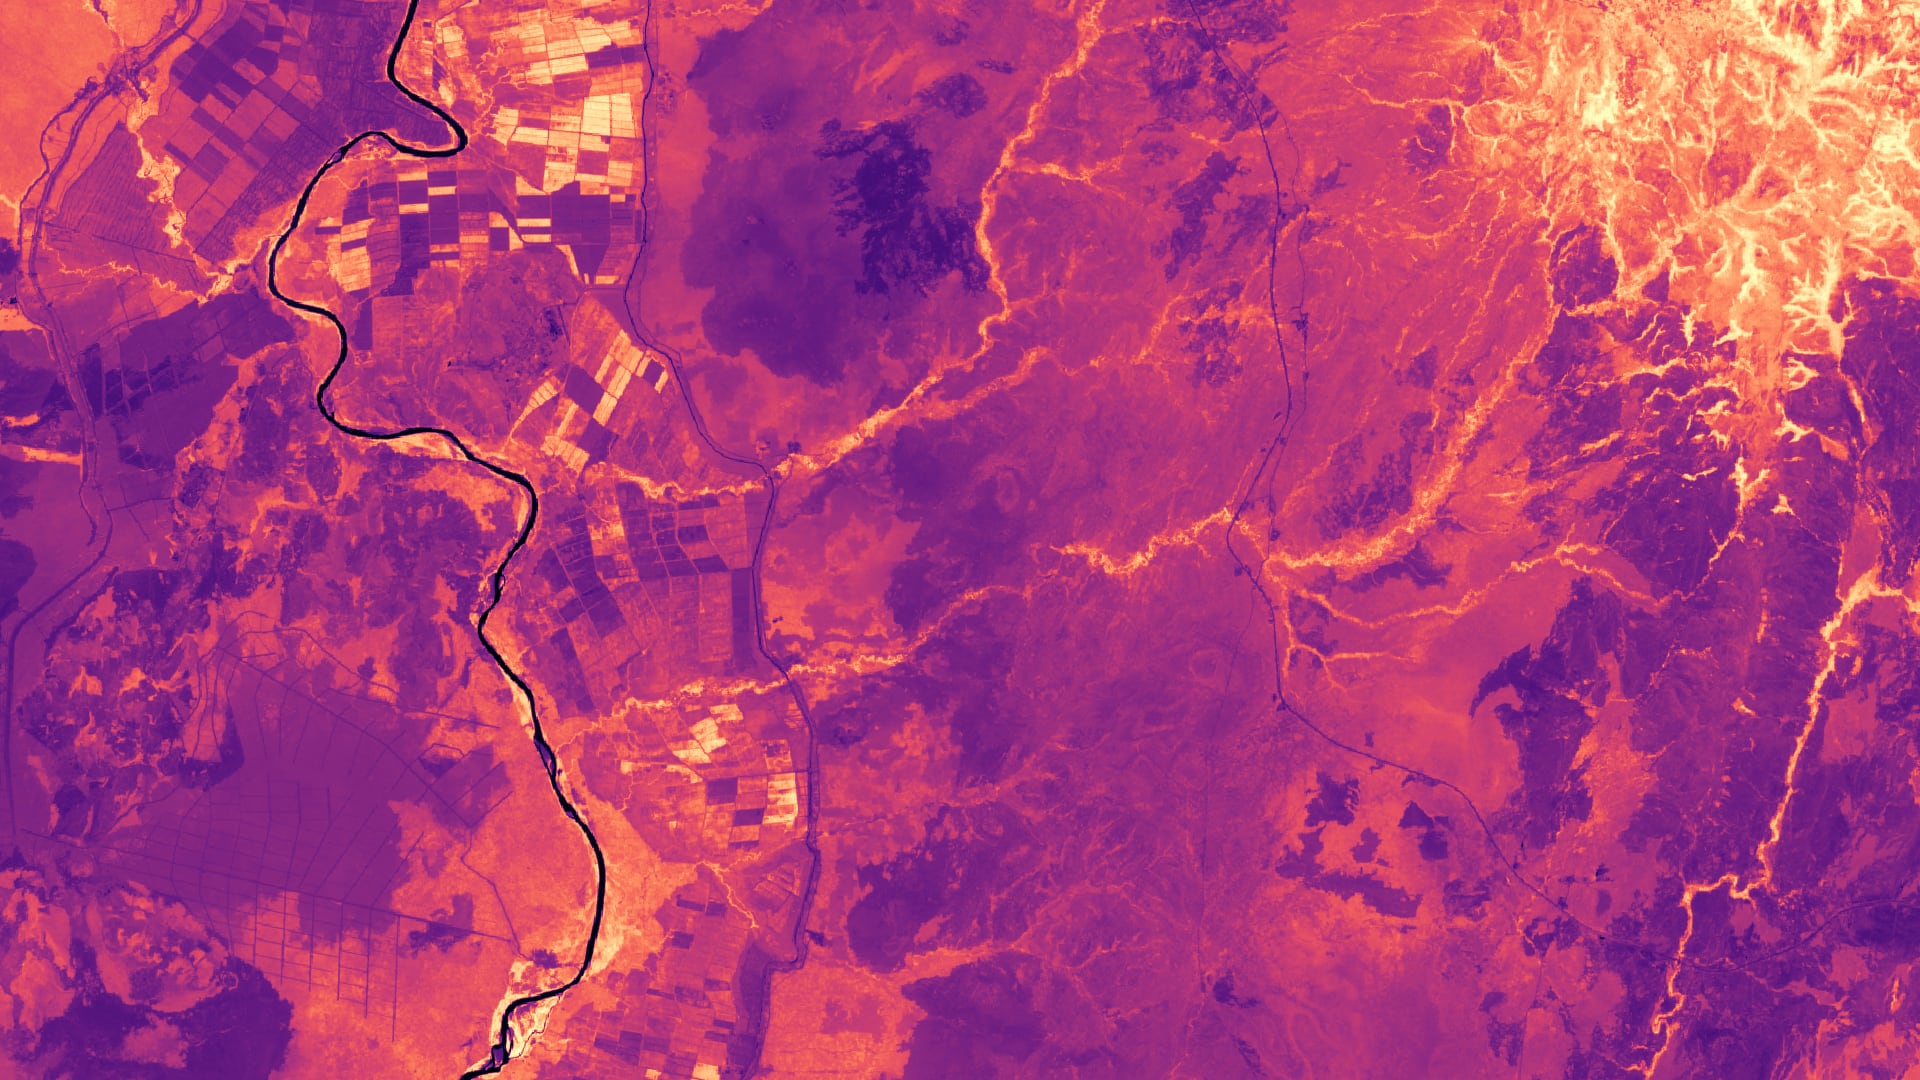
Ethiopia is home to unique wildlife, biodiversity, and ecosystem services and, like much of the world, is undergoing population growth, development, and land use change. As a result, some biodiverse regions may be at risk of being urbanized, cultivated as...

Principal Investigator

Sarah Aldama

Imagen
Average GPM IMERG data (2018) combined with landslide susceptibility calculated using SRTM imagery (2000) serve as inputs for the Landslide Hazard Assessment for Situational Awareness (LHASA) model for the Dominican Republic Cordillera Central mountain range. This LHASA “nowcast” respectively shows high and moderate landslide potential in red and yellow, as well as high to low susceptibility to rainfall-triggered landslides in dark and light orange. With LHASA nowcasts, landslide hazard can be assessed in near real-time.

Rainfall-triggered landslides associated with tropical storms cause devastating damage to the communities in the Dominican Republic and surrounding Caribbean islands. With the predicted increase in the frequency and intensity of storms, the region would benefit from reliable disaster monitoring. Partnering...

Principal Investigator

Catherine Buczek

Imagen
A Russian olive (RO) detection map created using 2020 Sentinel-2 MSI and 2020 Landsat 8 OLI imagery overlayed by a hillshade layer created by the Team from a series of USDA NRCS DEMs. The central portion of the Powder River is displayed. Yellow-white (purple-black) colors indicate RO presence (absence) in percent. There is no threshold on the results displayed; therefore, it is not an accurate representation of the results of our RO detection model.  Keywords: random forest model, russian olive, sentinel, landsat, shahin, courtney, tian, andrews, buczek

Since its introduction in the late 1800s, Russian olive (Elaeagnus augustifolia) has become a widespread invasive shrub that poses a threat to native riparian species in the United States that directly competes with native riparian plants for space and resources...