Image
NASA
NASA
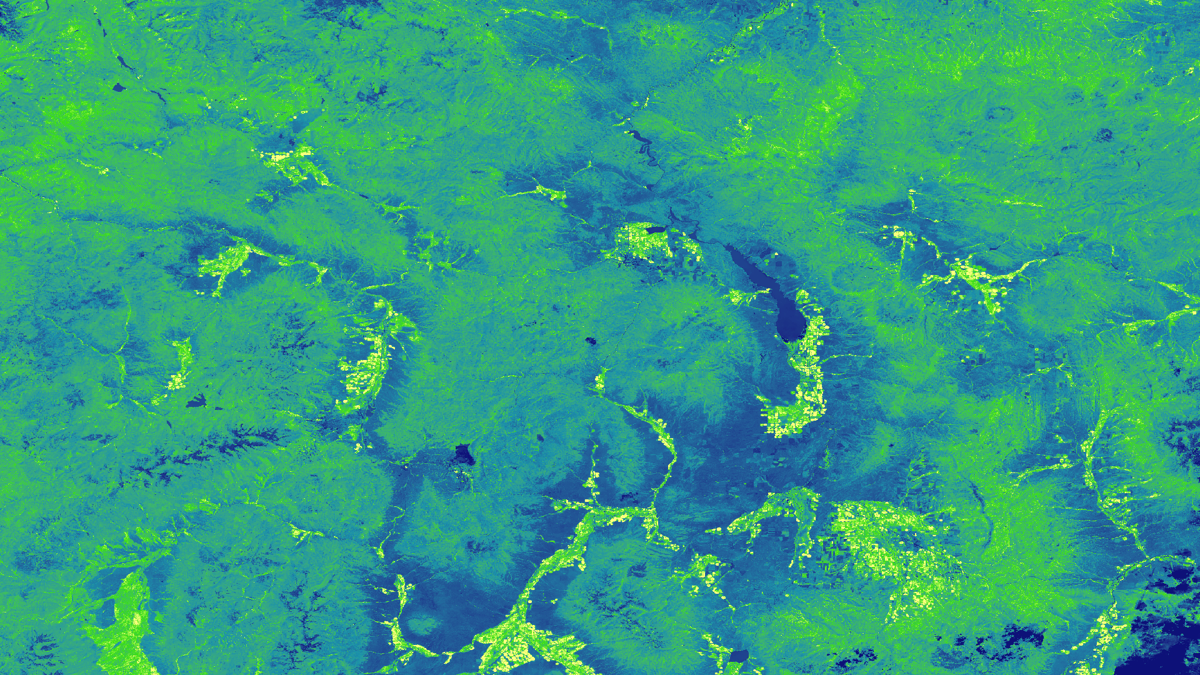
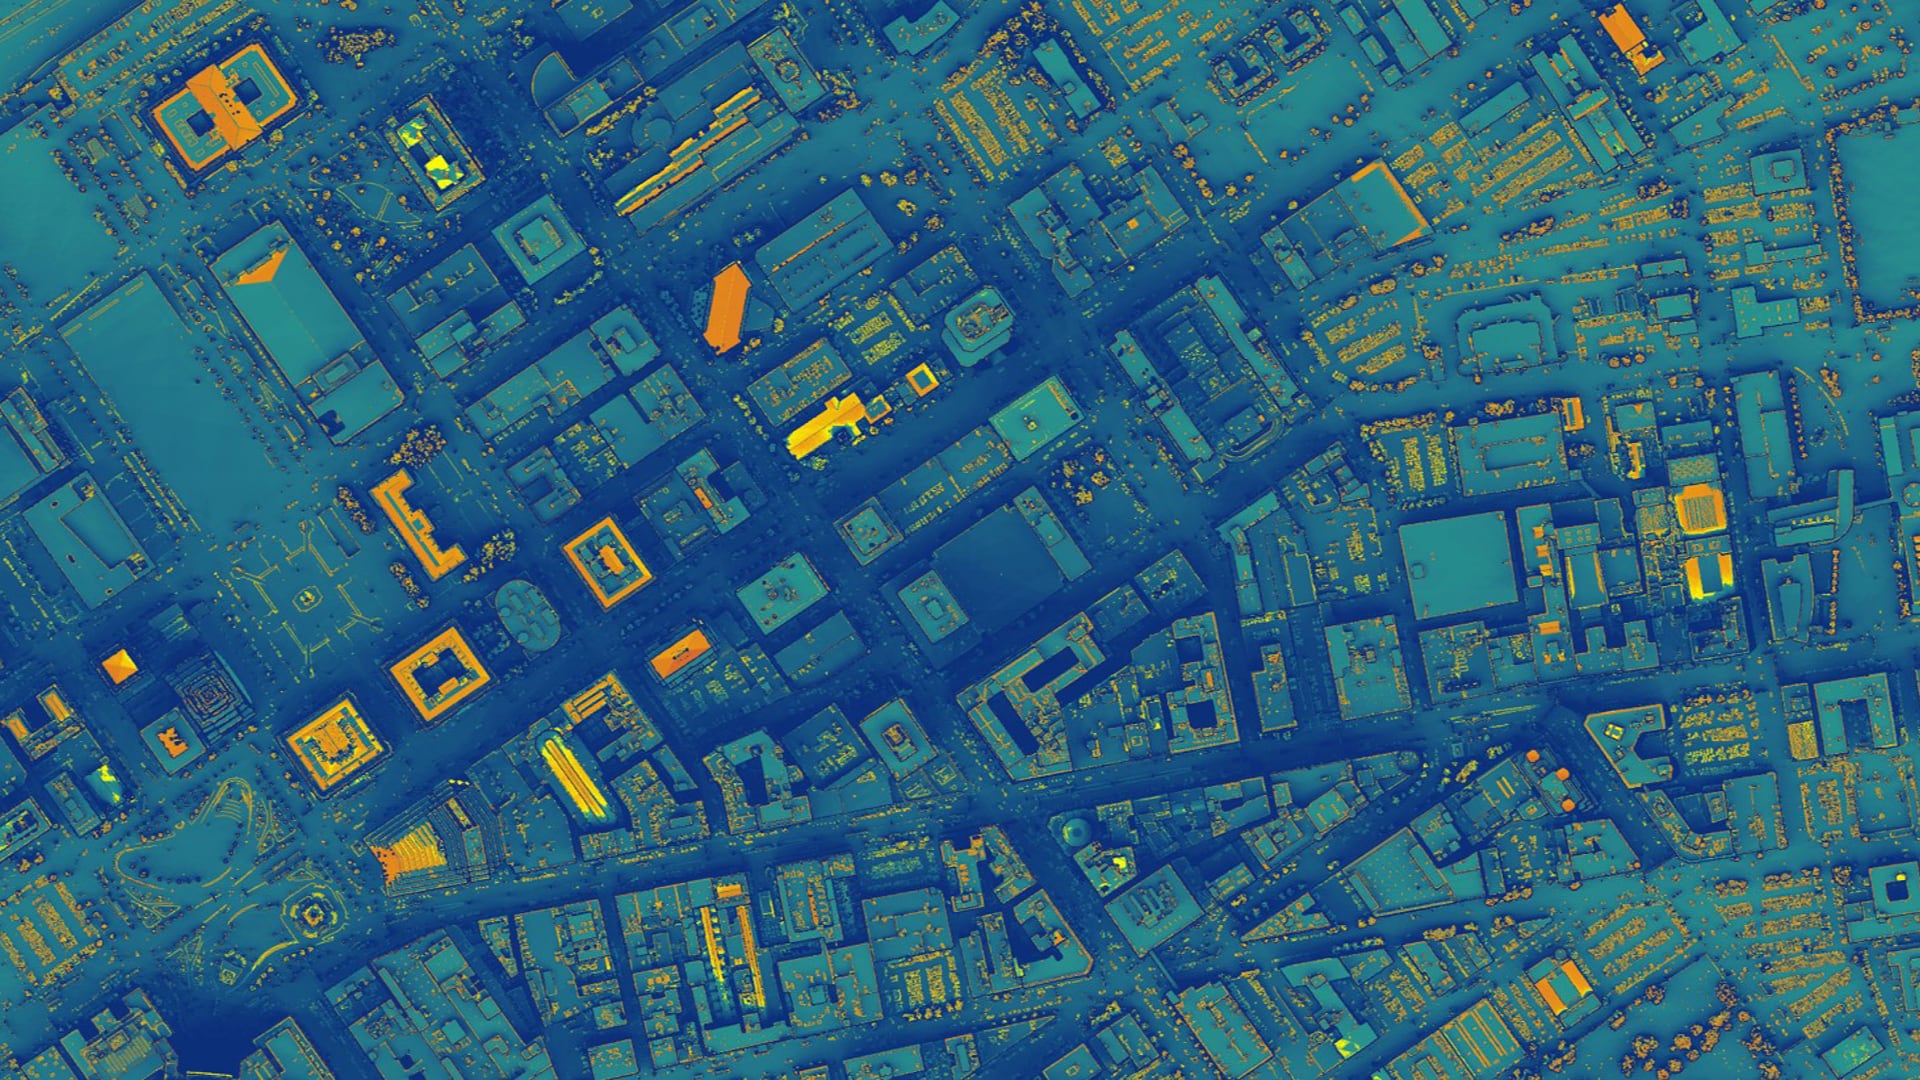
Tasseled cap greenness transformation derived from Landsat 8 imagery over lodgepole pine forest in the Intermountain West study area
Completed Projects
Amiya Kalra
In the Puget Sound region of Washington, high levels of air pollutants put residents’ health at risk by increasing their likelihood of developing critical respiratory conditions. This project used remotely-sensed data to investigate aerosol optical depth (AOD) from NASA satellite...
Nicole Holstein
The combined effects of increasing urbanization and climate change have exacerbated the urban heat island (UHI) effect and heat-related risks for city dwellers. Vulnerability to heat-related illnesses is further compounded by risk factors such as demographics, socioeconomic status, and pre-existing...
Nicole Ramberg-Pihl
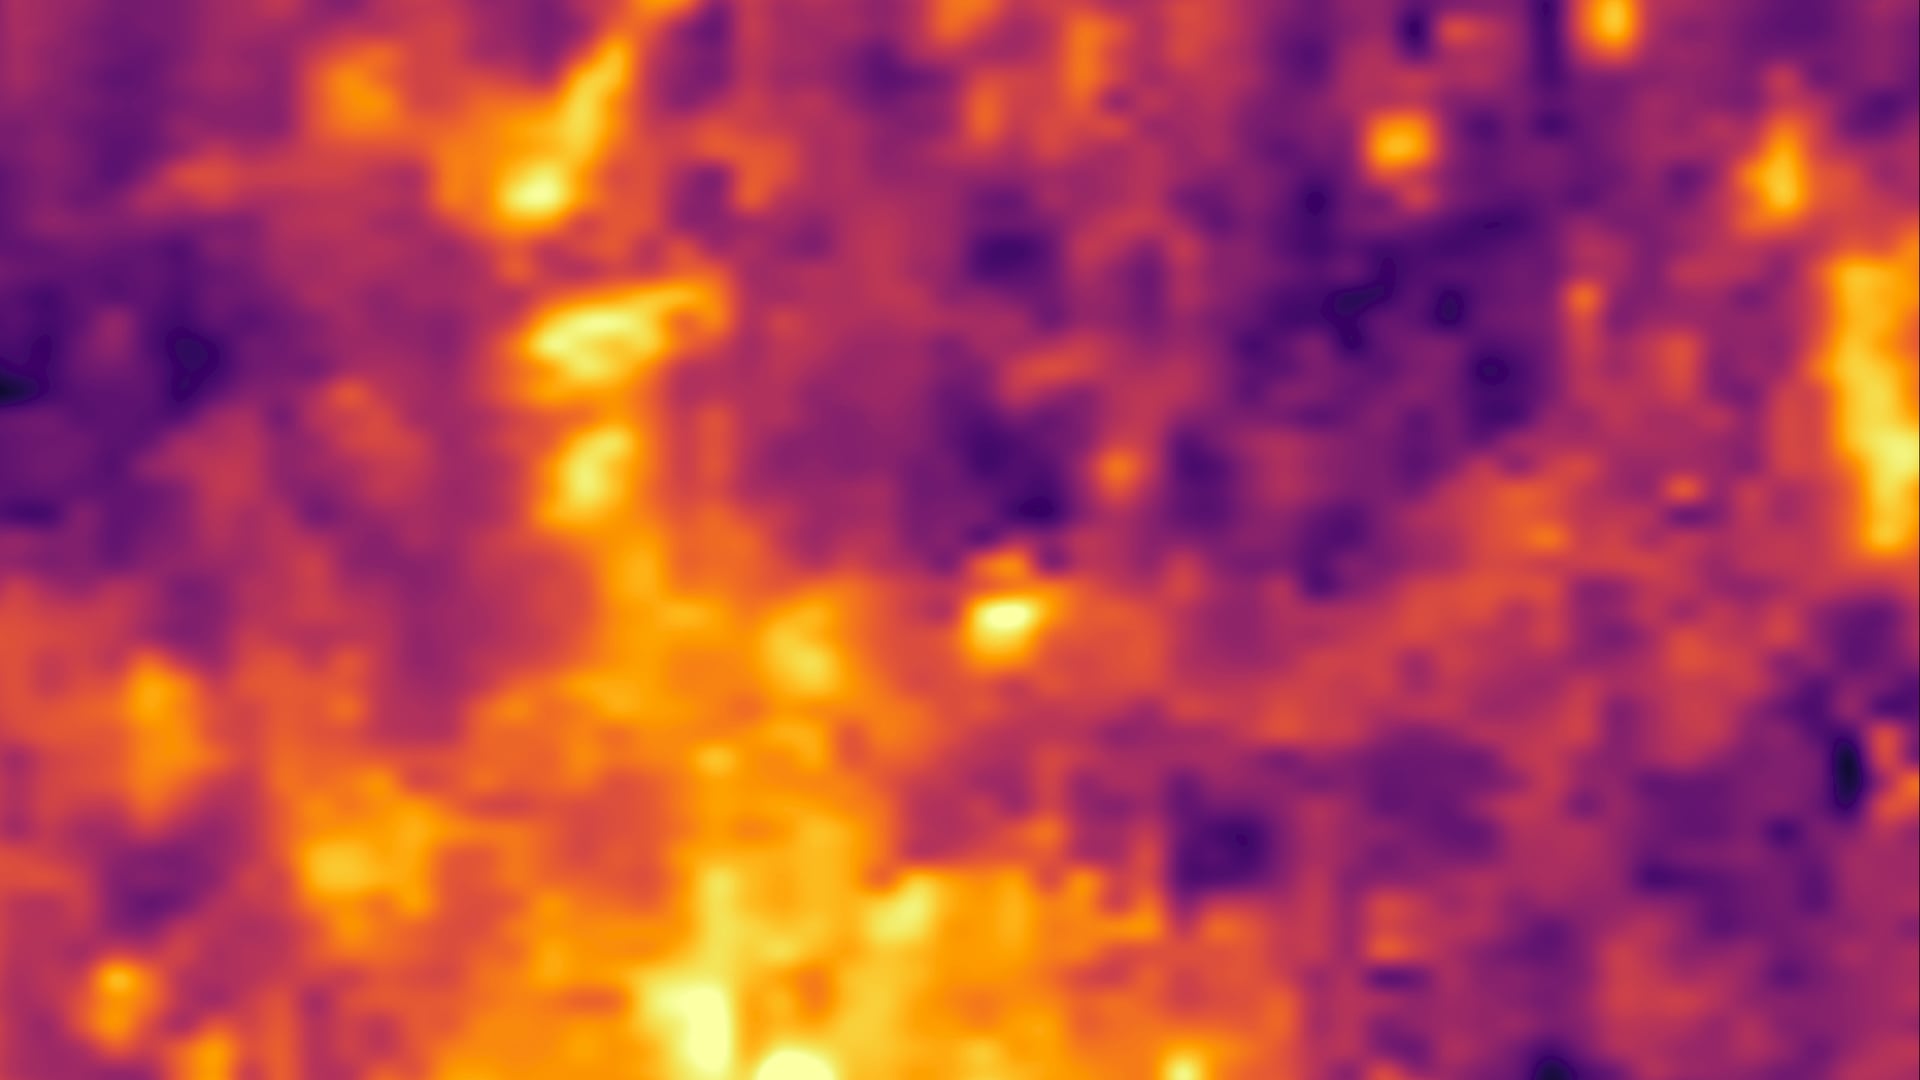
The urban heat island (UHI) effect occurs when urban areas have temperatures that are warmer on average than the surrounding suburban and rural regions. Low albedo surfaces traditionally found in urban landscapes, such as dark asphalt and rooftops, absorb solar irradiance...
Fadwa Bouhedda
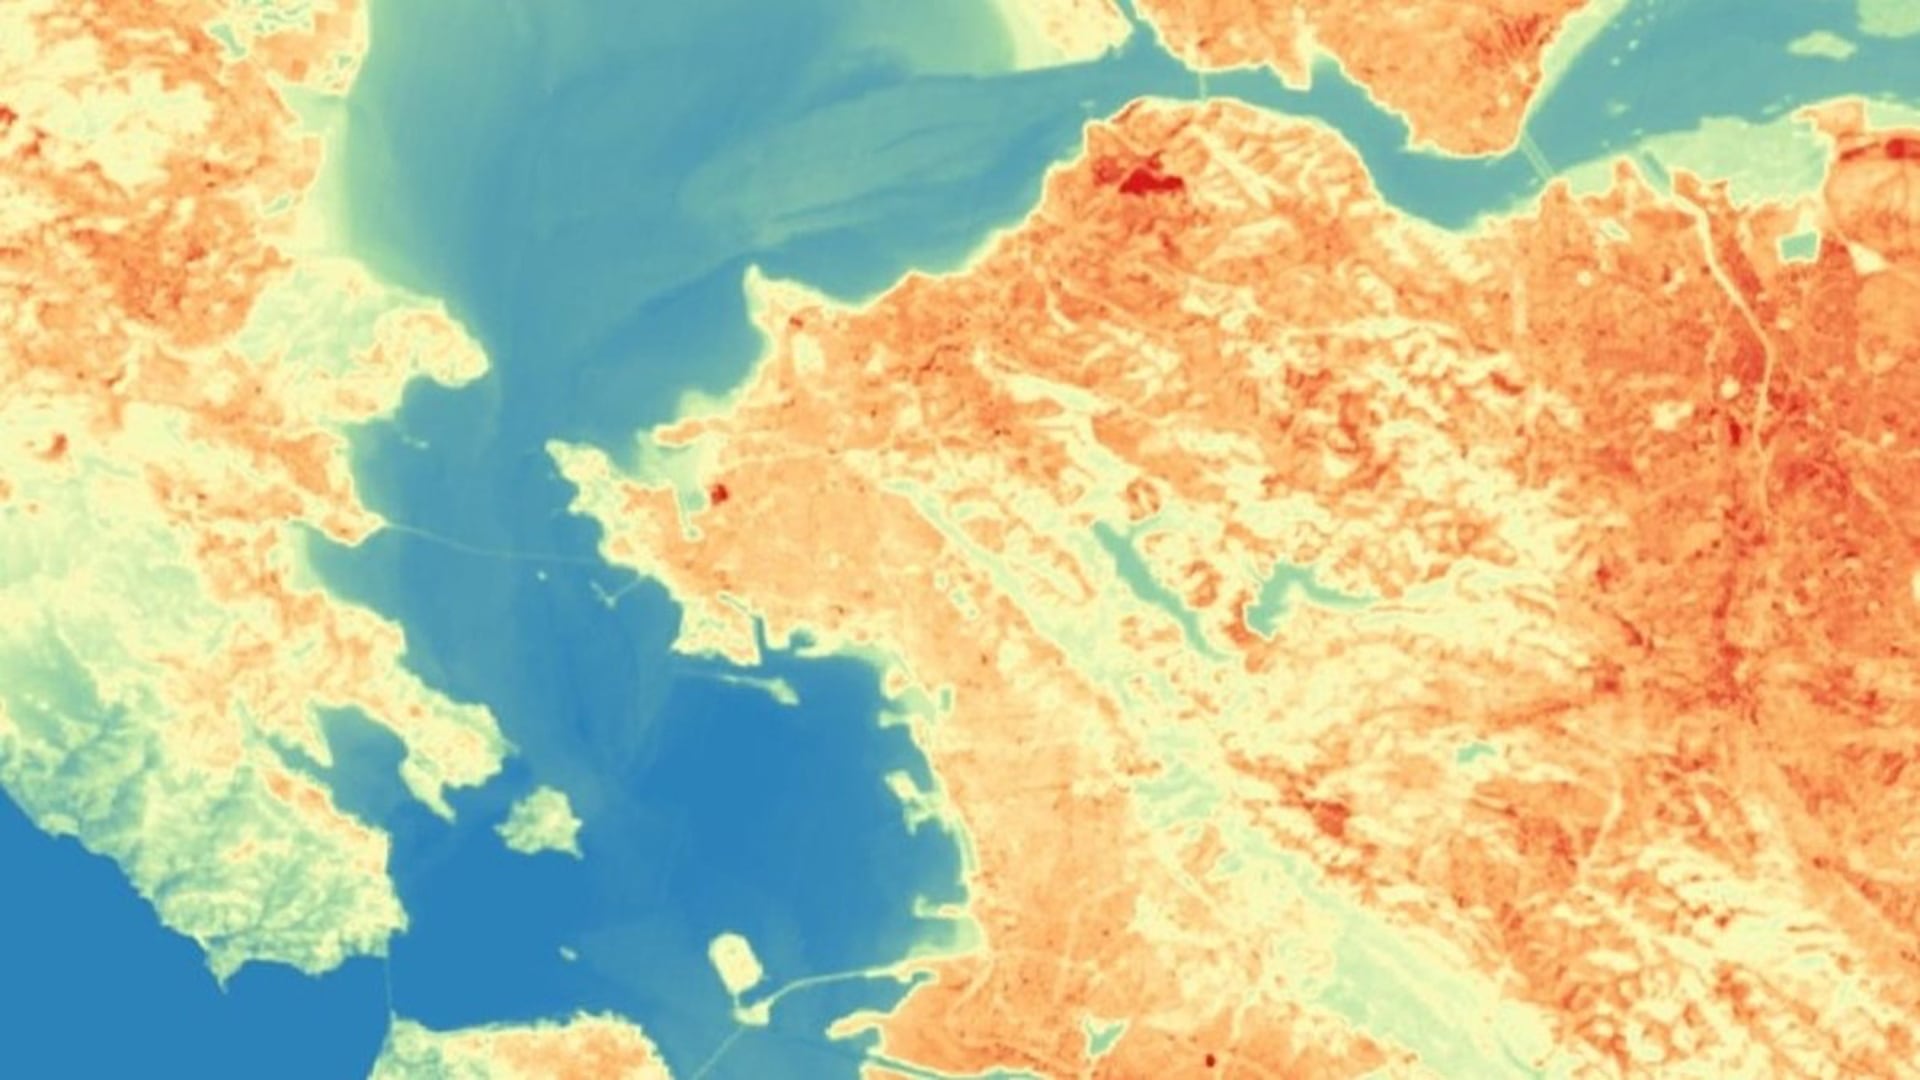
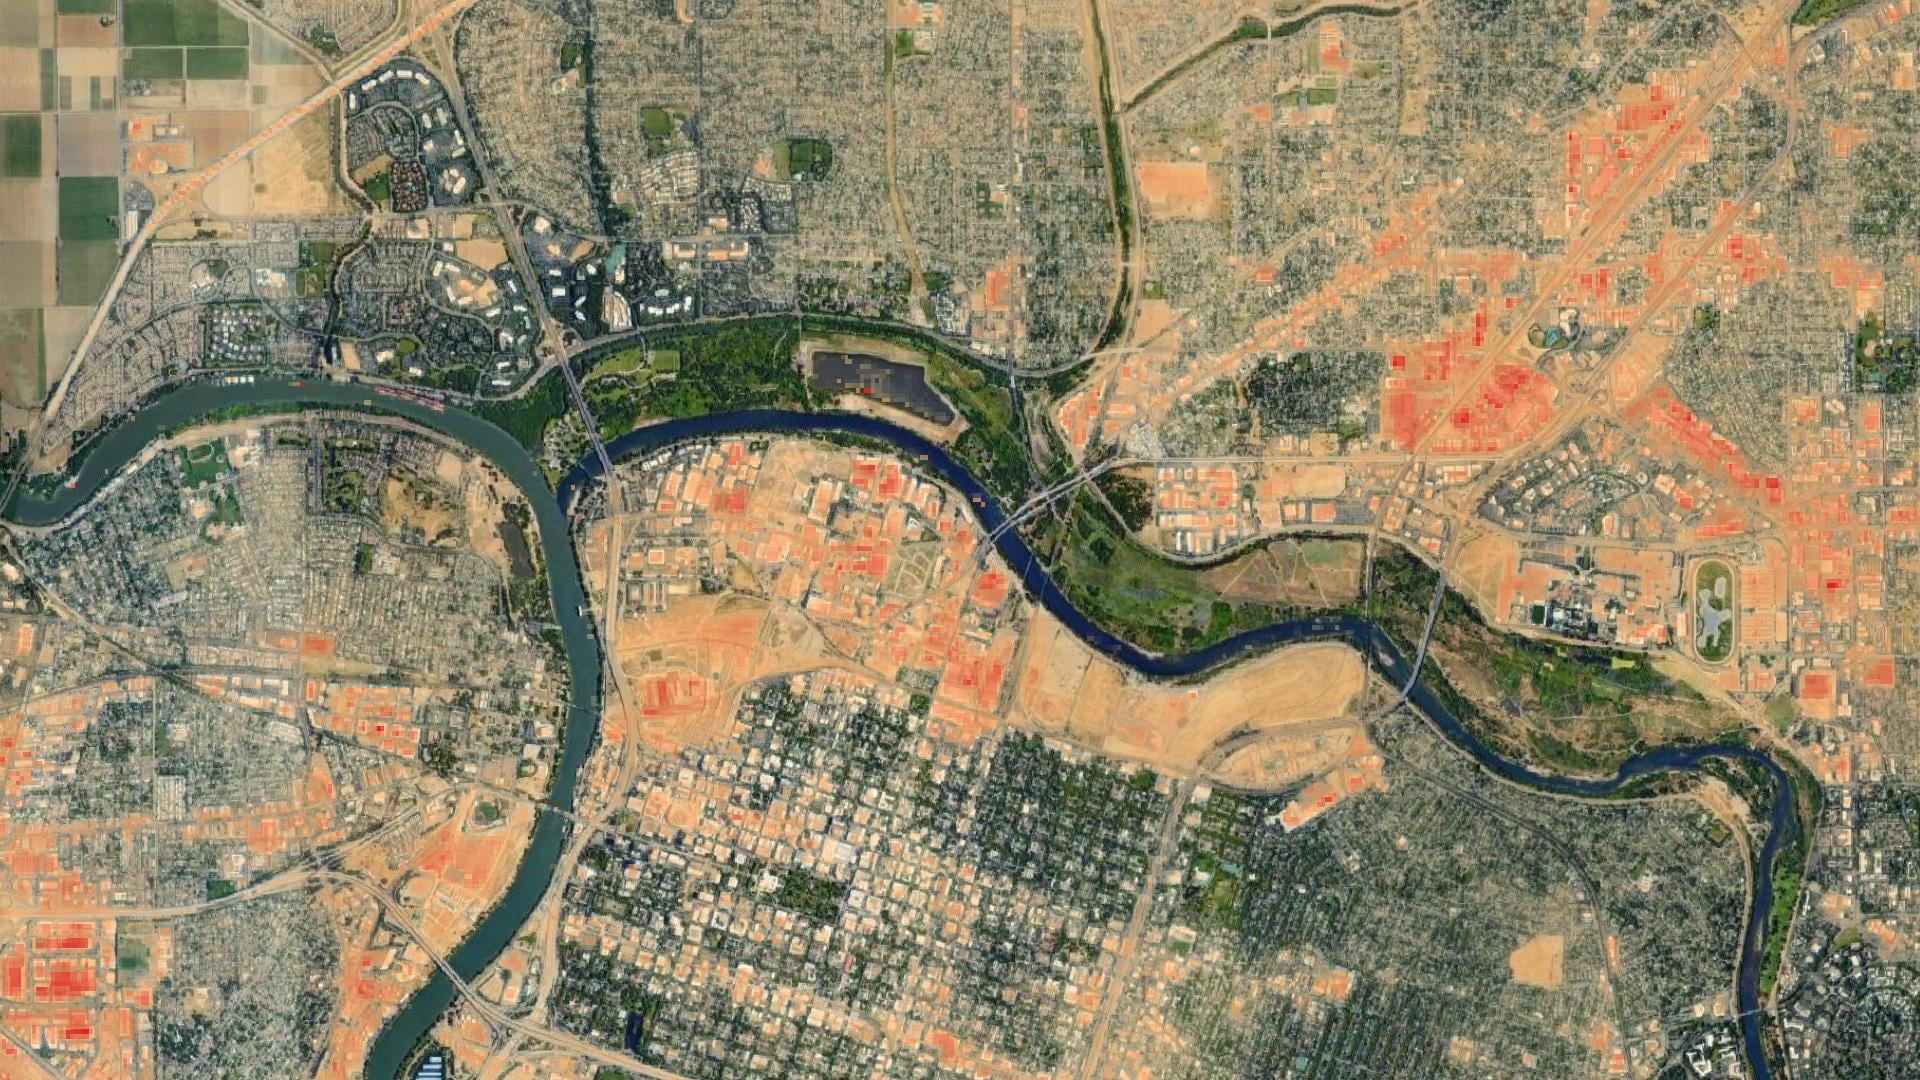
With the aim of improving air quality and mitigating increases in land surface temperature (LST), the city of Richmond, California, and partnering organizations have planted 35,000 trees over the past decade. Groundwork Richmond (GR) a local partner, has approximately 22,000 tree planting opportunities to further...
Benjamin Whong
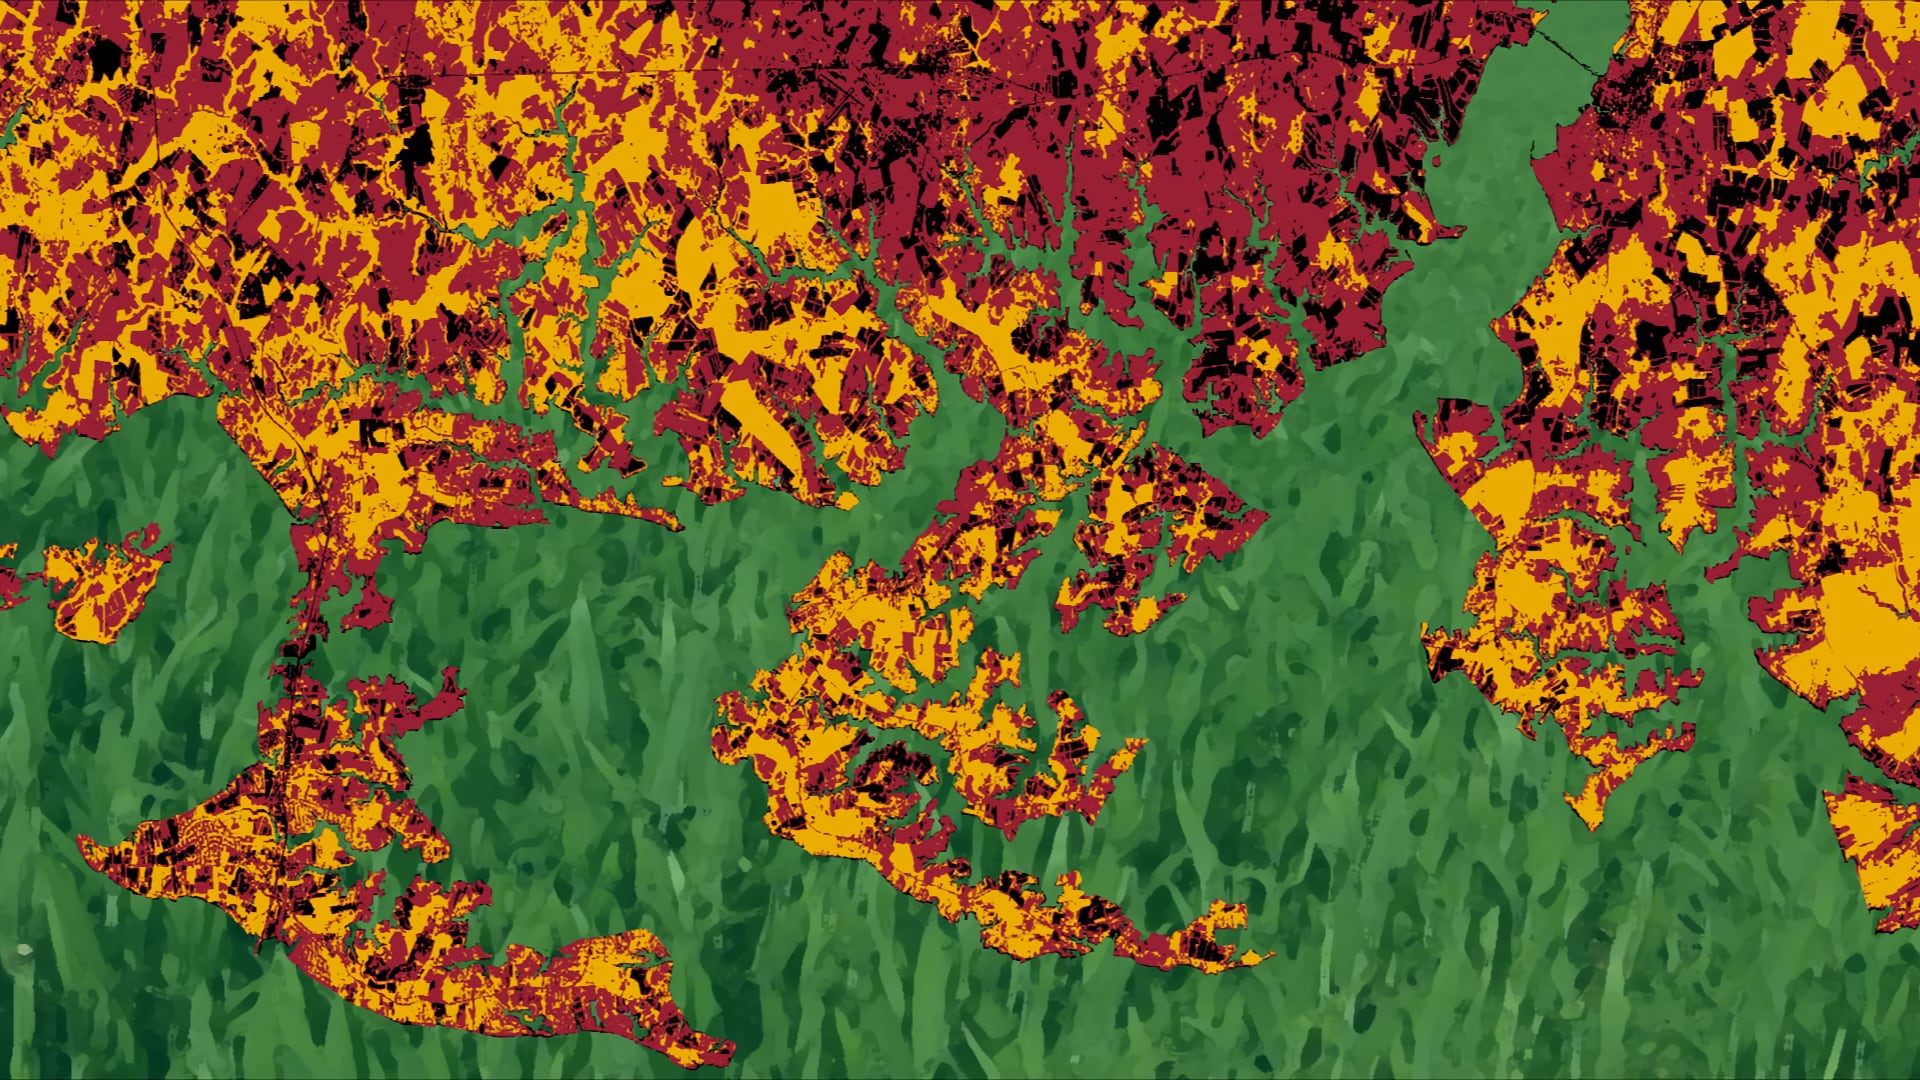
Cover crops enrich soils, limit erosion, and reduce nutrient runoff from agricultural land. To promote their usage, the Maryland Department of Agriculture (MDA) subsidizes farmers who plant winter cover crops. In order to maximize environmental benefits, cover crops must be...
Suravi Shrestha
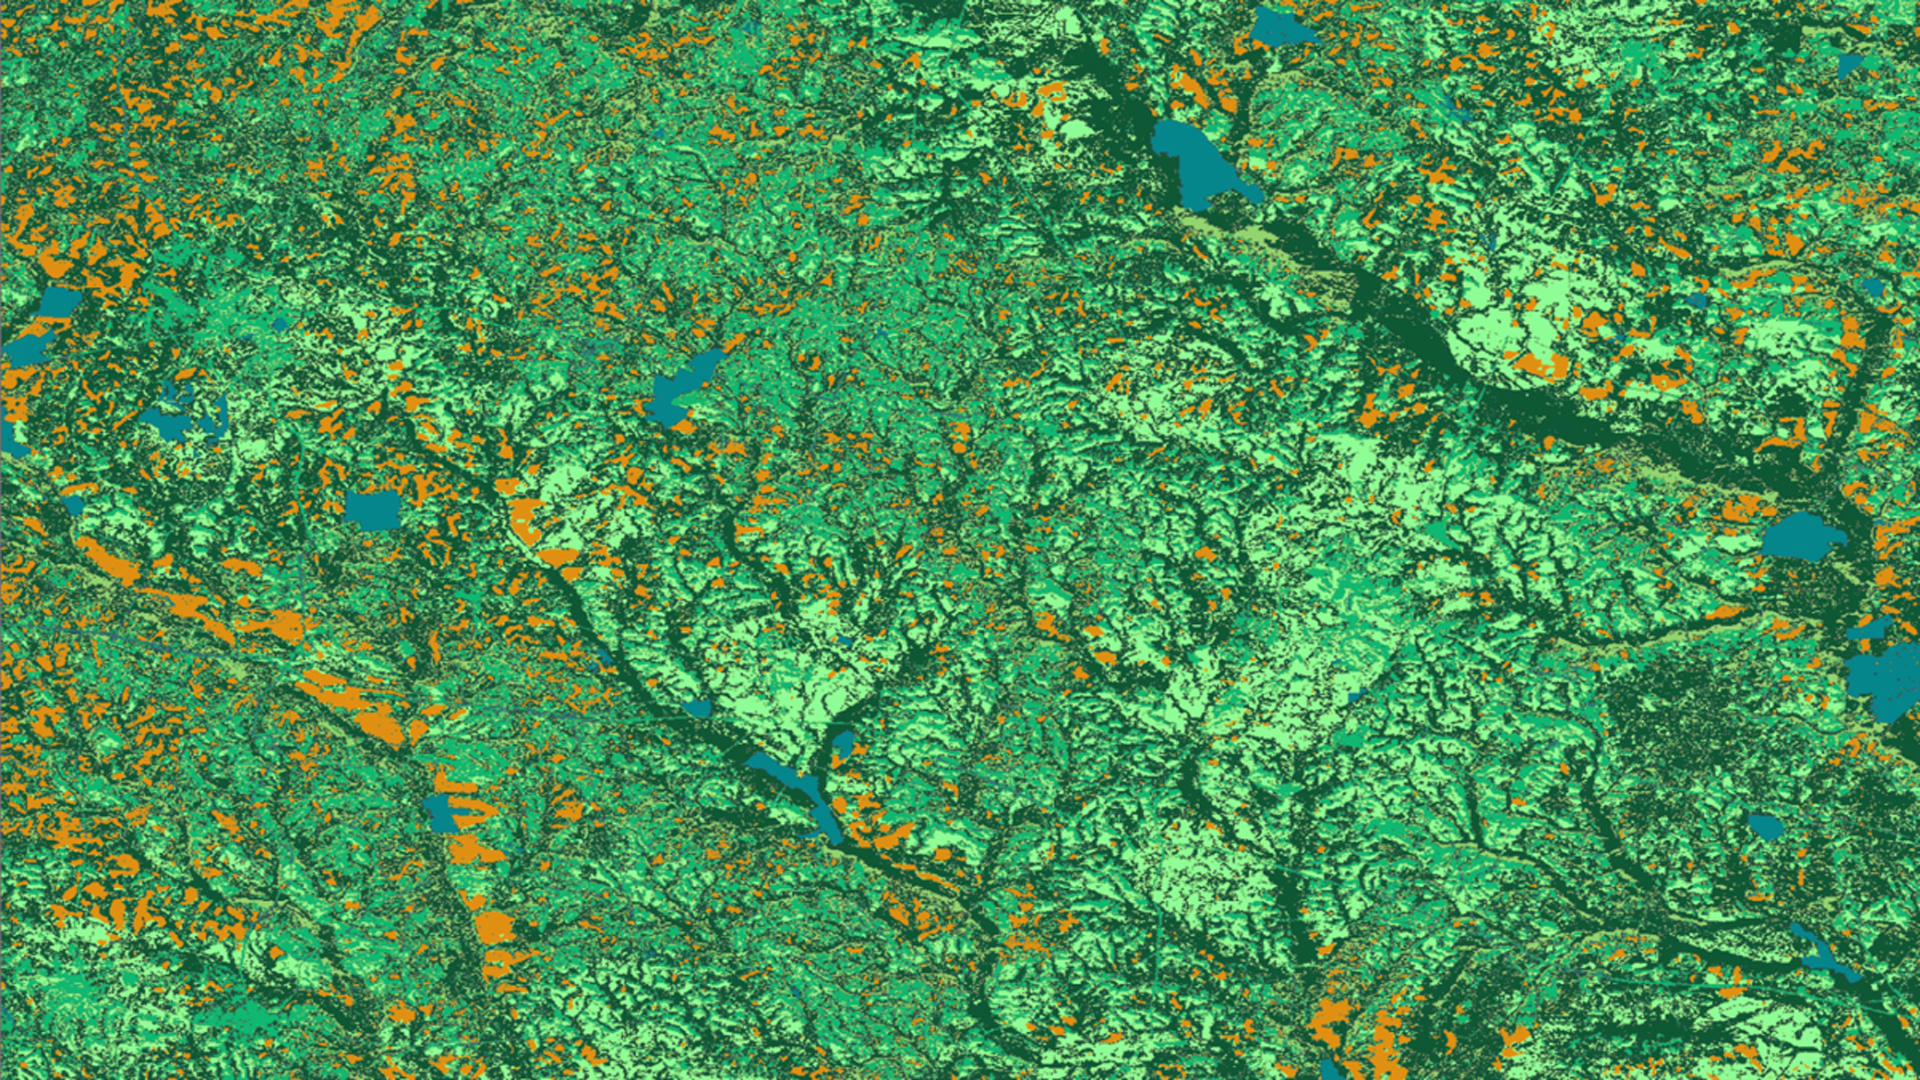
Solar energy is a rapidly growing industry in the state of Georgia. The increasing popularity of solar farms has encouraged decision-makers and developers to incorporate a sustainable plan for utility-scale solar developments. However, the construction and siting of solar farms could have a threatening impact...
Lynn Abdouni

Solar energy is a rapidly growing industry in the state of Georgia. The increasing popularity of solar farms is encouraging decision-makers and developers to incorporate a sustainable plan for utility-scale solar developments. However, the construction and siting of solar farms could have a threatening impact...
Mariana Webb
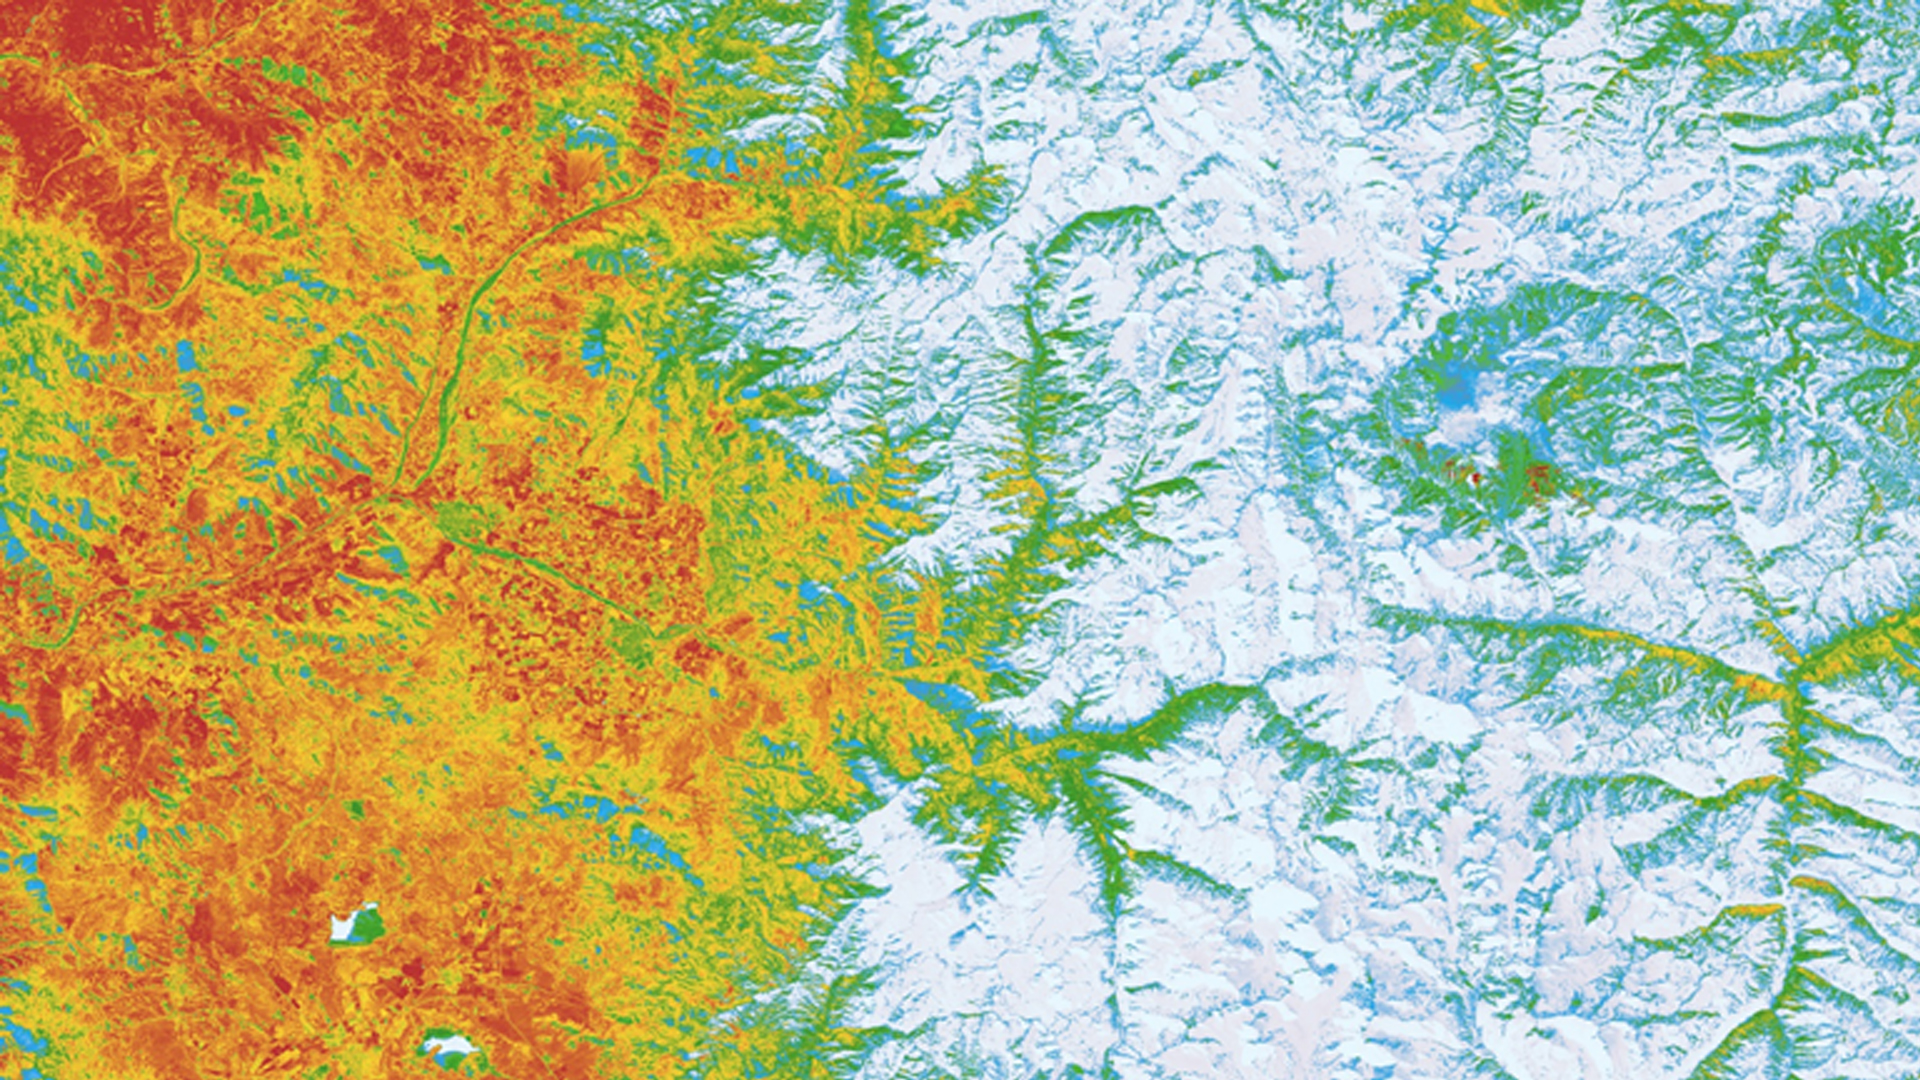
The Aconcagua basin of Central Chile, just north of the capital city of Santiago, is an arid region dominated by the Andes Mountains and heavily dependent on glaciers and seasonal meltwater for its water reserves. Due to the orographic nature of precipitation on the basin...
Hannah Besso
Cities around the globe are adopting clean energy technologies to ensure sustainable development and address the impacts of a changing climate. The City of Cleveland and Cuyahoga County in Ohio have committed to 100% renewable energy by 2035 and 2050...
Spencer Nelson
The City of Satellite Beach, Florida, has committed to supplying 100% of its energy use from renewable energy, primarily solar, by the year 2050. The team created a methodology for estimating rooftop solar power potential using a high-resolution Light Detection...