Displaying 811 - 820 of 882
![Landsat 8 OLI data processed into the median NDVI for 2016-2021 with an overlay showing deforestation that occurred during this time period in the Talladega National Forest. The deforestation layer is derived from Global Forest Watch's forest cover data, which uses the Landsat series, and was calculated as the difference between forested areas in 2016 and forested areas in 2021. Shades of green indicate the density of forest, while red areas indicate areas deforested in 2021.](/sites/default/files/styles/lis/public/2023-02/2022Fall_PUP_SoutheastUSClimate_WebsiteImage.jpeg.webp?itok=9thA-LxI)
Topic
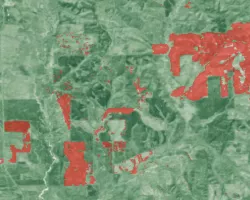
Southeast US Climate (Fall 2022) Team: Heidi Rogers (Project Lead), Mistaya Smith, Maggie Mason, Anish Holla Summary: Deforestation, a significant contributor to carbon emissions, is...
![Daytime land surface temperature for Wichita, Kansas summer 2017-2022, retrieved through Landsat 8 TIRS and Landsat 9 TIRS-2 surface temperature. Located in the northwest corner of the city, this image depicts higher temperatures through dark orange hues in developed areas, and lighter orange hues to blue colors where the temperature is lower. The land surface temperature was utilized to construct a heat vulnerability index for the city, looking into disproportionate impacts on underserved communities.](/sites/default/files/styles/lis/public/2023-02/2022Fall_VEJ_WichitaClimateII_WebsiteImage.png.webp?itok=oO4F6bs4)
Topic
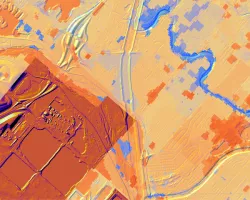
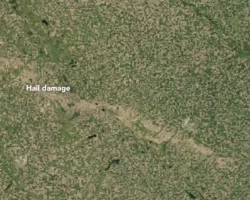
Wichita Climate II (Fall 2022) Team: Ritisha Ghosh (Project Lead), Richard Kirschner, Ria Mukherjee, Raina Monaghan Summary: Wichita, Kansas is experiencing a host of climate...
![Satellite imagery of a reservoir in Mexico with the ARSET logo](/sites/default/files/styles/lis/public/2023-03/Website_Header_v2_0.jpg.webp?itok=N28Z-tPD)
Training Type
Level
Advanced
Date
Mayo 08, 2023 - Mayo 11, 2023
![Eastern region of the Baa Atoll in the Republic of Maldives. The red indicates areas that would likely be flooded by 2100 according to the most extreme IPCC AR6 Shared Socioeconomic Pathway scenario, as identified through the NASA Sea Level Projection Tool. CoastalDEM, derived from NASA's SRTM sensor, provided elevation data. The base map image was taken in January 2023 by Planet Labs. Shades of yellow and green indicate shallow water and land surfaces. Includes copyrighted material of Planet Labs PBC. All](/sites/default/files/styles/lis/public/2023-04/2023Spring_ARC_MaldivesClimateII_WebsiteImage.jpg.webp?itok=U9qoVeWo)
Topic
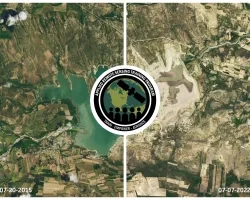
Maldives Climate II (Spring 2023) Team: Ben Dahan (Project Lead), Evan Barrett, Tiffany Hsu, Gabriel Halaweh Summary: The Republic of the Maldives is a low-lying...