Displaying 1 - 8 of 8
![Map displaying Oklahoma City Heat Vulnerability Index in 2020.](/sites/default/files/styles/lis/public/2023-09/Cheng_2020.png.webp?itok=cV1JbpSh)
Topic
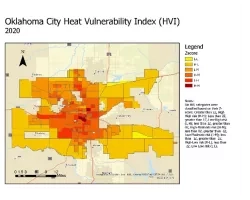
A spatial decision support system for identifying heat vulnerability based on a comprehensive energy budget model and multi-criteria decision analysis in Oklahoma City, OK Team...
![Map showing southeast Los Angeles urban heat exposure around community locations identified by Research Leadership Academy participants.](/sites/default/files/styles/lis/public/2024-01/Douglas_EEJ.jpg.webp?itok=X2Hz9n30)
Topic
In partnership with Communities for a Better Environment, a community-based organization leading the advancement of zero-emission technologies and green infrastructure in environmental justice communities, our...
![Census tract map of Corpus Christi and runoff factors.](/sites/default/files/styles/lis/public/2024-02/Zhang_Census-tract%20runoff%20factors%20in%20Corpus%20Christi_80NSSC22K1670.jpg.webp?itok=Z67hHJlZ)
Team: • Jim Lee (Texas A&M University – Corpus Christi), co-I • Yuxia Huang (Texas A&M University – Corpus Christi), co-I • Lapone Techapinyawat (Texas...
![Study area and percent poverty by census tract. The zip code and Tucson boundary are from Pima County GIS.](/sites/default/files/styles/lis/public/2024-02/Wolf%20Project%20Page%20Image.png.webp?itok=hRB1p_Q0)
Team Members: Theresa Foley (Sonora Environmental Research Institute), Palmira Henriquez (Sonora Environmental Research Institute), Flor Sandoval (Sonora Environmental Research Institute), Rachel Spitz (Sonora Environmental Research...
Team Members: Narcisa G. Pricope (University of North Carolina Wilmington and Mississippi State University), Leah Mayo (University of North Carolina Wilmington), Joanne Halls (University of...
![Maximum Temperature across Baltimore City, Summer 2022](/sites/default/files/styles/lis/public/2024-02/Smith%20Project%20Page%20Image.png.webp?itok=BrLk0hcA)
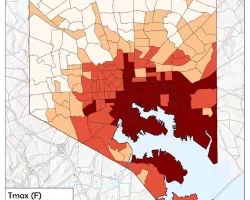
Team Members: Jaime Madrigano PhD, Co-investigator (Johns Hopkins University), Darryn Waugh PhD, Co-investigator (Johns Hopkins University), Benjamin Zaitchik PhD, Co-investigator (Johns Hopkins University), Bianca Corpuz...
![Thermal imagery of Denver bus stop in the afternoon displaying large variability in surface temperatures due to land cover types and shading. Tripods in center of image are recording wet and dry globe temperatures and windspeed. Combining fine-scale surface temperature data, with high-resolution land cover data, we can build a land cover regression to downscale Landsat thermal imagery for all metropolitan transit locations in Denver.](/sites/default/files/styles/lis/public/2024-04/Ibsen%20Project%20Page%20Image.png.webp?itok=C4igDYv8)
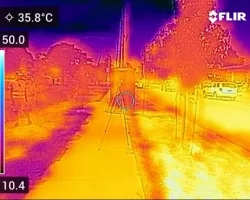
Team: Peter Ibsen (US Geological Survey), Priyanka DeSouza (UC Denver), Jay Diffendorfer (US Geological Survey), Travis Warziniak (US Forest Service), Cody Bingham (University of British...
![Land surface temperatures for study area (Cuyahoga County, Ohio), as derived from Landsat. Black lines show boundaries of census blocks. Blue dots show the greenspaces and census blocks where the on the ground tree surveys have been conducted, with one census block highlighted as an inset. Image Credit: Rob Moore (Cleveland State).](/sites/default/files/styles/lis/public/2024-05/Mueller%20Project%20Page%20Image_0.png.webp?itok=nYl76fWk)
Topic
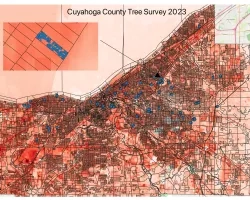
Team: Kevin Mueller (Cleveland State University), Brice Grunert (Cleveland State University), Thomas Hilde (Cleveland State University), Kaiguang Zhao (Ohio State University), Daniel Meaney (Cuyahoga County...