Displaying 31 - 40 of 81
![Predicted cheatgrass green-up imagery from Landsat 8 OLI data. This composite image of the western portion of the Mullen Fire Study Area is from June 2022. Shades of green and yellow indicate an earlier green-up time, while orange, brown, and white areas show later predicted green-up times. This data was used to create NDVI difference maps which will help managers predict when and where to apply treatments to limit the spread of cheatgrass.](/sites/default/files/styles/lis/public/2023-10/2023Sum_CO_SouthernWyomingEcoII_WebsiteImage.jpg.webp?itok=Ht2hUpEj)
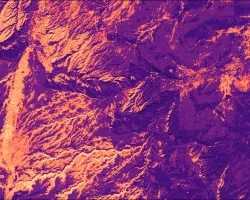
Southern Wyoming Ecological Conservation II (Summer 2023) Team: Bryan Graybill (Project Lead), Lillian Gordon, Estelle Lindrooth, Sarah Sathe Summary: Cheatgrass (Bromus tectorum) is an invasive...
![Annual max biomass calculated from 2021 daily Harmonized LandSat Sentinel-2 (HLS) dataset. Dark purple colors show low biomass while the bright orange show high biomass. Regions with high vegetation and tree canopy cover are shown in orange on the left of the image. High biomass values are of an interest to rangeland managers to help inform their grazing decisions based on which areas of the ranch produce the most biomass/vegetation.](/sites/default/files/styles/lis/public/2023-02/2022Fall_CO_EasternPlainsAgr_WebsiteImage.jpg.webp?itok=StO3rYYa)
Eastern Plains Agriculture (Fall 2022) Team: Jillian Joubert, Sarah Hettema, Deni Ranguelova, TR Ingram, Max Stewart Summary: Adaptive management on cattle ranches requires rangeland managers...
![](/sites/default/files/styles/lis/public/images/develop-legacy/2019/summer/images/2019Sum_MSFC_CentralAmericaTI_WebsiteImage.jpg.webp?itok=DWQOzdqL)
Topic
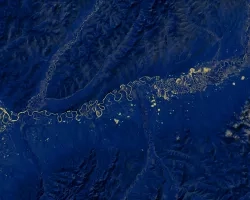
Central America is one of the world’s most vulnerable regions to natural disasters, including landslides and precipitation-driven flooding. In an effort to support disaster management...
![Normalized Difference Water Index (NDWI) to visualize drainage networks around the Unalakleet River in Alaska, calculated from an August 2021 Landsat 8 OLI image. Yellow represents standing or flowing water and potential flood zones, while the dark blue represents drier, upland regions. Unalakleet's climate resilience planning prioritizes relocation to upland regions while avoiding areas that have experienced significant permafrost degradation.](/sites/default/files/styles/lis/public/2023-10/2023Sum_GA_UnalakleetClimate_WebsiteImage.jpg.webp?itok=9m9RUwoB)
Unalakleet Climate (Summer 2023) Team: Ian Lee (Project Lead), Clara Maxwell, Daniel J. Marsden, M. Jaweed Nazary Summary: The coastal community of Unalakleet is currently...
![](/sites/default/files/styles/lis/public/images/develop-legacy/2020/spring/images/2020Spring_JPL_CentralValleyWater_WebsiteImage.jpg.webp?itok=7tG_qPN2)
Topic
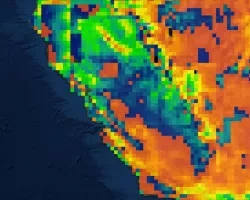
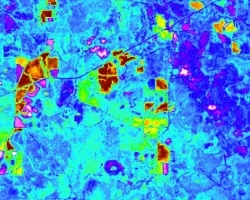
California’s Central Valley is one of the most productive agricultural areas in the world, producing approximately $20 billion in crops annually. The recent California droughts...
![](/sites/default/files/styles/lis/public/images/develop-legacy/2018/summer/images/2018Sum_LaRC_ColombiaEco.jpg.webp?itok=52ywG06n)
Topic
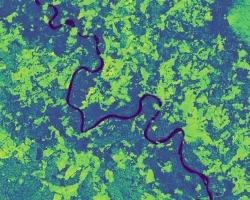
Colombia contains a variety of endemic species, making it one of the most biodiverse regions in the world. Due to a recent peace treaty between...
![](/sites/default/files/styles/lis/public/images/develop-legacy/2021/summer/images/2021Sum_ID_SouthwestWater_WebsiteImage.jpg.webp?itok=AgP7hBPB)
Topic
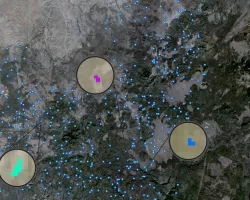
Due to increasingly frequent and severe drought conditions in the southwestern US, land managers and livestock producers need to monitor stock ponds with increasing regularity...
![NDWI-processed imagery from Landsat 8 Operational Land Imager data. This mosaicked image was taken from January to December 2021 of Jekyll Island, Georgia. NDWI contrasts the water features in a satellite image to its surroundings by measuring the moisture content. Low moisture content is shown in white, and high moisture content is shown in blue.](/sites/default/files/styles/lis/public/2023-02/2022Fall_GA_Disasters_WebsiteImage.png.webp?itok=_4Frkxe1)
Georgia Disasters (Fall 2022) Team: Isabella Chittumuri (Project Lead), Nancee Uniyal, Nathan Tesfayi, Shakirah Rogers Summary: In September 2017, Hurricane Irma made landfall in southern...
![NDVI over Mato Grosso, Brazil processed from March 2021 Landsat-8 OLI data. Calculated NDVI values correspond with colors shown to indicate plant health. High NDVI values (green to blue) indicate dense vegetation found in tropical and temperate forests or crops at their peak growth. Low values (yellow to red) depict barren land, water, and moisture-stressed vegetation. These data can support timely and efficient agricultural responses to ensure productive yields and food security.](/sites/default/files/styles/lis/public/2022-12/2022Sum_NC_MatoGrosso_WebsiteImage_FD.png.webp?itok=JJA3kKJi)
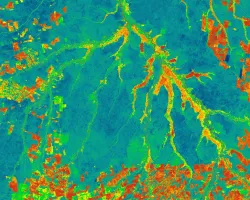
Mato Grosso Agriculture (Summer 2022) Team: Max Rock (Project Lead), Elijah Dalton, Aidan Harvey, Kate Reynolds Summary: Ranked as the fourth largest food producer in...
![](/sites/default/files/styles/lis/public/images/develop-legacy/2019/summer/images/2019Sum_MSFC_ConecuhNationalForestEco_WebsiteImage_2.jpg.webp?itok=X9VxH89Y)
Topic
The gopher frog (Lithobates capito) is an endangered species facing extinction within the next century due to loss and alteration of its habitat. With limited...