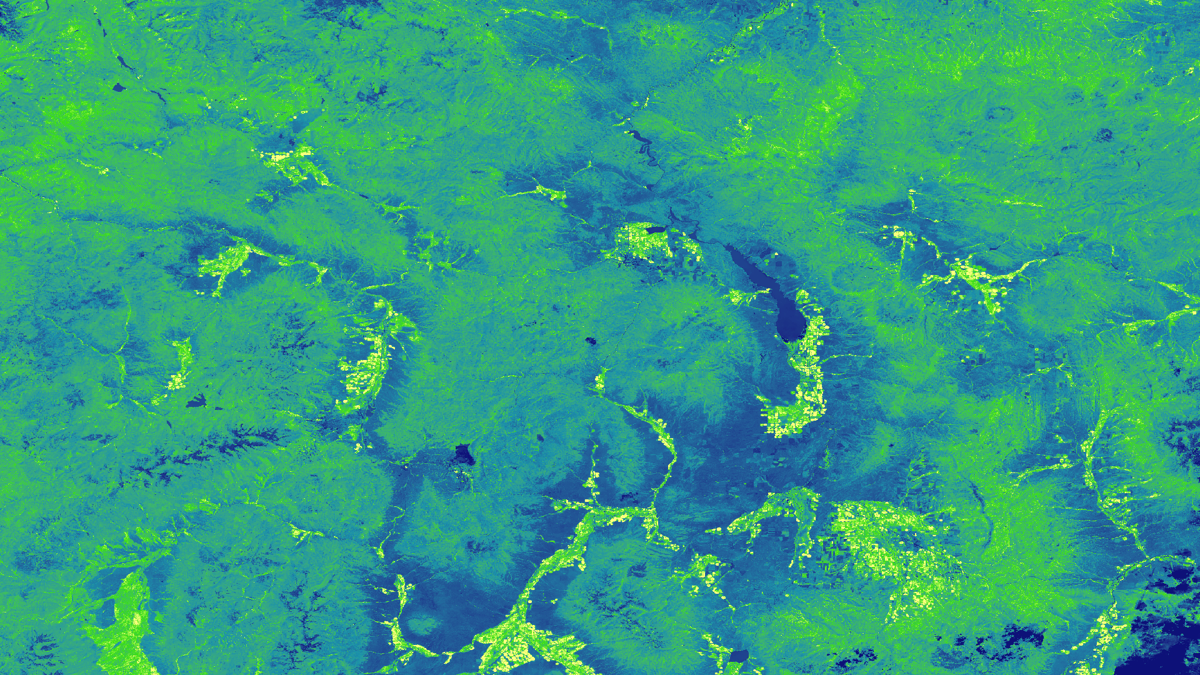
Principal Investigator

Eli Simonson

Imagen
Assessing and Assisting Monitoring Efforts of Water Clarity to Identify Potential Areas of Submerged Aquatic Vegetation (SAV) in the Chesapeake Bay

Submerged Aquatic Vegetation (SAV) is vitally important to the Chesapeake Bay, serving as one of the primary food sources for the organisms that inhabit the bay. This project evaluated the efficacy of remote sensing applications to monitor water quality parameters, specifically turbidity, to indicate areas...

Principal Investigator

Gavin Pirrie

Imagen
NDVI processed imagery from Suomi-NPP VIIRS in late June 2019 composited with elevation and aspect from the NED. The Henry Mountains in southern Utah are displayed. The lighter yellows and pinks indicate higher elevations and greater vegetation concentration where darker colors, including green and blue, indicate lower elevations and areas concentrated with less vegetation. Areas with higher vegetation indices indicate higher live fuel moisture content which aids decision-makers in allocating resources before and during wildfires.  Keywords: NDVI, aspect, elevation, live fuel moisture, Gavin Pirrie, Helena Bierly, Avery King, Katherine Mistick

The eastern Great Basin (EGB) extends throughout the states of Arizona, Colorado, Idaho, Utah, and Wyoming, covering approximately 411,000 km2. In recent years, wildfires in the EGB have increased in frequency and size, representing a growing concern for our partners...

Principal Investigator

Flavia Dias de Souza Moraes

Imagen
Assessing Changes in Cloud Dynamics in the Luquillo Tropical Montane Cloud Forest Using NASA Earth Observations and In Situ Measurements Following Defoliation from Hurricane Maria

The Luquillo Mountains in the El Yunque National Forest contain the most biologically diverse forest in the United States. It is a cloud forest rich in endemic species and its streams bring clean water to the people of Puerto Rico. This unique environment was exposed...

Principal Investigator

Dionne Blanks (Project Co-Lead)

Imagen
Assessing Changes in Vegetation and Marine Environments at the Isla del Coco Marine Reserve with Satellite Imagery

The Isla del Coco Marine Reserve, located off the coast of Costa Rica, is experiencing several environmental challenges including rising sea surface temperature (SST), coral reef bleaching, coastal erosion, and loss of cloud coverage above its cloud forest. These challenges not only threaten the well-being...

Principal Investigator

Sabine Nix

Imagen
NDWI (2013-2020) and supervised land cover classification (2020) from Landsat 8 OLI imagery, SRTM elevation, global HAND data, and FEMA 100 and 500 year floodplains combined into a flood risk map near the headwaters of the Cheat River in Parson’s West Virginia. High-risk flood areas are represented in dark purple, while low-risk areas are light yellow. High-risk areas indicate where local organizations can prioritize flood mitigation and response efforts.  Keywords: Landsat 8 OLI, Flood Risk, SRTM, NLCD, Supervised Classification, FEMA, Flood Extent

The Cheat River, primarily located in northeast West Virginia, experiences major flooding events that negatively impact nearby communities. Poor water quality due to acid mine drainage and excess sediment loads during flood events threaten the health of communities and numerous...

Principal Investigator

Brittany Greene

Imagen
Land surface temperature (LST) derived from September 2018 Landsat 8 TIRS data, processed with bands 4,5, and 10. This image was taken over southeastern Iowa around the Des Moines River. The darkest red values indicate higher temperatures around 40˚C while the darkest blue values indicate the lower temperatures around 24 ˚C. Higher temperatures indicate greater amounts of plant stress.

Iowa dedicates 92% of its land to agriculture, leaving the state economically and culturally vulnerable to drought. Current climate trends show increasing temperatures and decreasing precipitation levels, which are environmental factors that put stress on vegetation and force farmers to...

Principal Investigator

Karina Alvarez

Imagen
Turbidity calculated from Landsat 8 OLI imagery taken 01/23/2021 over Russian River, California. A turbidity algorithm was applied to visualize water quality and mask out land. In areas of water, red indicates high turbidity and blue indicates low turbidity. Land is displayed with a true color band combination (4, 3, 2) where dark blue indicates shadow. As turbidity can indicate poor water quality, visualization informs conservation agencies on estuary conditions.  Keywords: Image created by Roger Ly. Keywords: turbidity, water quality monitoring, California, estuary

Estuaries are vital ecosystems that serve important ecological functions. The Marine Life Protection Act aims to protect these ecosystems by establishing a network of marine protected areas (MPAs), in part by requiring regulatory agencies to monitor estuary extent and health...

Principal Investigator

Ahmed Baqai

Imagen
Landsat 8 OLI imagery from all of 2018, processed using Tasseled Cap Greenness to show changes in the range of vegetation. The map displays western Massachusetts, where the Connecticut River flows through Greenfield and Hadley. Darker shades indicate areas of low range of greenness, demonstrating little or no change in vegetation over 2018. Lighter areas indicate high change in vegetation. Dark areas may indicate the presence of water, which can inform users of local flooding.  Keywords: Tasseled Cap Greenness, Landsat OLI, flooding, Massachusetts, Ahmed Baqai, Rebecca Composto, E. Adelaide Gonzalez, Liana Stachowicz

North American beavers (Castor canadensis) are returning to Massachusetts after overhunting decimated their populations in the 1700s. Current regulations have allowed this species to recolonize, resulting in increasingly prevalent human-beaver conflicts. These ecosystem engineers can quickly change their environment through...

Principal Investigator

Paxton LaJoie

Imagen
NDVI-processed imagery from 2020 Landsat 8 OLI data of the greater Cincinnati, OH and Covington, KY area. Lighter blues show denser vegetation while darker blues depict highly urbanized areas. The darkest blue line represents the extent of the Ohio River. Urban areas lacking slope-stabilizing and run-off retaining vegetation are more susceptible to landslides and flooding.  Keywords: NDVI, landslide susceptibility, InVEST, urban flood mitigation

Landslides and flooding are reoccurring environmental hazards that lead to health risks and economic burdens in the urban areas of Cincinnati, Ohio and Covington, Kentucky. These communities share underlying natural and artificial conditions that make them vulnerable to these hazards...

Principal Investigator

Trista Brophy


The Charles River watershed intersects 35 municipalities within the Boston Metropolitan Area and has a population of 1.2 million, making it one of the most densely populated watersheds in New England. In recent years, the watershed has observed higher...