Displaying 651 - 660 of 728
![Soil organic carbon (SOC) is measured here for a depth of 0-5cm from Soil Moisture Active Passive from January 1, 2021 over Peru and Bolivia. SOC is visualized against combined MODIS landcover data for the year 2000 from Aqua and Terra. Shades of lighter pink indicate lower SOC content and darker shades of pink and purple indicate higher SOC content. Conservation International is interested in mapping areas of high SOC content for their conservation efforts.](/sites/default/files/styles/lis/public/2023-05/2023Spring_GSFC_Peru%26BoliviaClimate_WebsiteImage.jpg.webp?itok=RJ-8Cuuo)
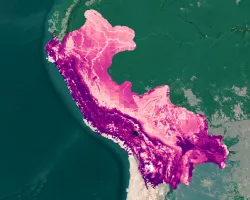
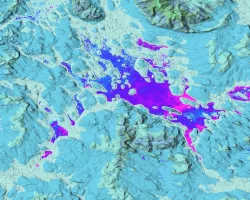
Peru & Bolivia Climate (2023 Spring) Team: Aarti Arora (Project Lead), Aaron Carr, Arina Fuqua, Haydee Portillo Summary: Irrecoverable carbon (IC) reserves contain large stores...
![Median land surface temperature (LST) image over Los Angeles from June to August 2022, as derived from Landsat 8 TIRS data. Higher temperatures are shown in red, while cooler temperatures are displayed in blue. LST data can help investigate the impacts of urban cooling initiatives and inform urban planning decisions to mitigate the impacts of heat within the city.](/sites/default/files/styles/lis/public/2023-05/2023Spring_JPL_LosAngelesUrban_WebsiteImage.png.webp?itok=1olFjNJd)
Topic
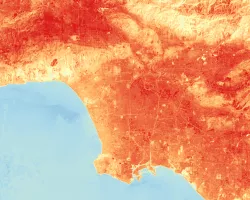
Los Angeles Urban Development (2023 Spring) Team: Leyla Namazie (Project Lead), Julie Gevorgian, Theodore Ross, Stephanie Hernandez Summary: Over the last several decades the city...
![Aerosol Optical Depth for a dust event on July 26th-27th, 2021, calculated with the MAIAC algorithm from Terra and Aqua MODIS satellite data. Great Salt Lake surface area, in blue, was derived from JRC Yearly Water Classification History and processed imagery from Landsat 5, 7, and 8. The map depicts regions that are most impacted by dust surrounding the Great Salt Lake. Red and Yellow represent high dust levels within Northern Utah.](/sites/default/files/styles/lis/public/2023-05/2023Spring_VEJ_GreatSaltLakeHAQ_WebImage.jpg.webp?itok=T6r5Pogy)
Topic
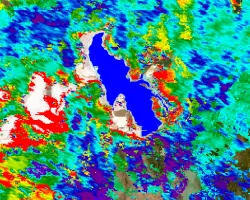
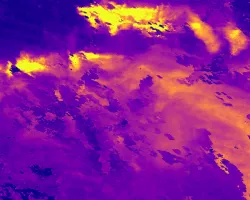
Great Salt Lake Health and Air Quality (2023 Spring) Team: Piper Christian (Project Lead), Fiona Summers, Yoana Vargas Magana, Andrea Delgado Summary: Water flow into...
![Urban heat island effect in New York City, New York calculated using Landsat 8 TIRS imagery from May 2020-21. Red and orange areas depict where the effect is most severe and bus routes are overlayed in white. Areas where bus routes intersect with high heat exposure can be prioritized for bus shelters and community engagement.](/sites/default/files/styles/lis/public/2023-05/2023Spring_VEJ_NewYorkCityTI_WebsiteImage.jpg.webp?itok=UnKpDwG2)
Topic
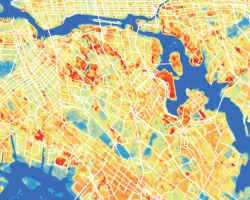
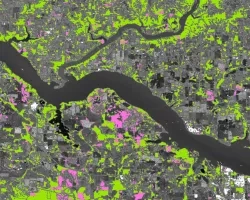
New York City Transportation and Infrastructure (2023 Spring) Team: Thomas Schindelman (Project Lead), Emily Culling, Gianna Méndez Germán, Janna Chapman Summary: New York City, the...
![This image shows the mixed environments near the American Falls Reservoir throughout the year, blended using 2022 summer and winter NDVI false-color composites derived from Landsat 8 OLI and overlaid by a hillshade from SRTM. The white color indicates snowpack in the mountain wilderness, the primary water resource for agriculture and habitats near the reservoir. Bright red denotes marshes and irrigated farms, essential resources for wildlife animals and humans living in Southern Idaho.](/sites/default/files/styles/lis/public/2023-05/2023Spring_ID_IDEco_WebsiteImage.jpg.webp?itok=omiCUyxc)
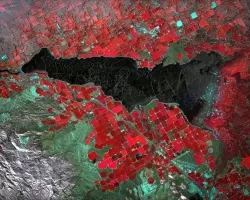
Idaho Ecological Conservation (2023 Spring) Team: Preethi Malur Balaji (Project Lead), Talissa Cota, Kangsan Lee, Melissa McNally Summary: Management Area in Bingham County, Idaho, has...
![The satellite imagery is a Sentinel-1 Ground Range Detection C-SAR image from July 2nd, 2021, taken over the Sudd Wetland located in South Sudan. The image shows the 'VV' backscatter values, which correlate to vertical transmission and vertical reception from the C-SAR instrument and are used to classify wetland inundation extent. Low 'VV' values (blue) represent areas covered by open waters & inundated land areas and high 'VV' values (yellow) represent dry land areas.](/sites/default/files/styles/lis/public/2023-05/2023Spring_JPL_WETWater_WebsiteImage.jpg.webp?itok=UViLBf_D)
Topic
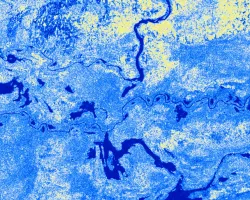
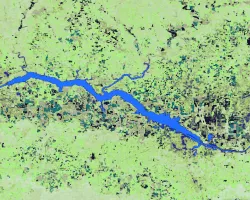
WET Water Resources (2023 Spring) Team: Lori Berberian (Project Lead), Kaely Harris, Mitch Porter, Emma Waugh Summary: Wetland ecosystems are annually or seasonally wet transition...
![Aerosol optical depth concentration from MODIS, captured on August 16, 2020, during the fire season. Dark purples hues indicate normal atmospheric conditions, while orange and yellow hues show high concentrations of aerosols, suggesting the presence of smoke and particulate matter following a fire event. MODIS aerosol optical depth can be used as a proxy for PM2.5 pollution, increasing decision makers’ capacities to monitor and address the negative effects of wildfire smoke plumes on residential areas.](/sites/default/files/styles/lis/public/2023-05/2023Spring_LaRC_ColoradoSpringsHAQ_WebImage.png.webp?itok=rNvnSpEC)
Topic
Colorado Springs Health and Air Quality (2023 Spring) Team: Olivia Etherton, Jeanette Moritz, Joshua Stokes, Ephrata Yohannes Summary: The City of Colorado Springs, situated in...
![Turbidity calculated from a 5/11/2022 Landsat 8 OLI scene. The dark blue, purple, and pink pixels indicate low to high levels of turbidity respectively in Lake Winnipesaukee, New Hampshire and surrounding water bodies. This is layered over an SRTM DEM dataset, acquired 2/11/2000 and published 9/23/2014, showing varying elevations. More turbid waters are less suitable for loon habitats and are thus of interest to monitor loon preservation.](/sites/default/files/styles/lis/public/2023-05/2023Spring_MA_NHEco_WebsiteImage.jpg.webp?itok=Ub8tlSpD)
New Hampshire Ecological Conservation (2023 Spring) Team: Jane Zugarek (Project Lead), Madison Arndt, Jessica Gray, Amelia Untiedt Summary: Bioindicator species monitoring allows researchers to infer...
![The green areas show stable forest in NW Alabama classified by both National Land Cover Dataset (2016-2019) and Landscape Change Monitoring System(2016-2021), and the pink areas are areas where forest cover loss was sensed by NLCD, LCMS, LandTrendr (2016-2021), and Global Forest Watch (2016-2021). These datasets and the basemap were made with Landsat 5 Thematic Mapper, Landsat 7 Enhanced Thematic Mapper Plus, and Landsat 8 Operational Land Imager.](/sites/default/files/styles/lis/public/2023-05/2023Spring_MSFC_SoutheastUSClimateII_WebsiteImage.jpg.webp?itok=3mAADCnc)
Southeast US Climate II (2023 Spring) Team: Cassie Ferrante (Project Lead), Katherine Scott, James Karroum, Cate Lull Summary: The balancing of atmospheric CO2 sources and...
![The data for this image comes from NASA satellite Landsat 8 Operational Land Imager. Normalized Difference Vegetation Index and Cropland Data Layers were used to create the image. The black, brown, and bright green specks represent the different crops growing near Wheeler Lake Watershed in North Alabama. NDVI and cropland data can be used to predict and evaluate the effects of flash drought on agricultural crops.](/sites/default/files/styles/lis/public/2023-05/2023Spring_MSFC_SoutheastUSAg_WebsiteImage.jpg.webp?itok=zZsHeQGk)
Topic
Southeast US Agriculture (2023 Spring) Team: Kindrea Gibbons (Project Lead), Michaela Gooch, Quinton Deppert, Casey Mills Summary: A flash drought refers to the rapid onset...