Displaying 191 - 200 of 728
![The difference in Aerosol Optical Depth (AOD) between ozone spike days in summer 2018 and 2020 in Seiling, Oklahoma. AOD measures particles distributed within a column of air and can help predict tropospheric ozone spikes and inform regulatory organizations. Data derived from Terra and Aqua MODIS with 2020 Landsat 8 imagery as a base map. Yellow represents the greatest difference in AOD and purple represents the least difference, with green in the middle. Areas with negative values were removed.](/sites/default/files/styles/lis/public/2022-03/2021Fall_JPL_OklahomaHealthAndAirQuality_WebsiteImage.jpg.webp?itok=PR2zL79Y)
Oklahoma Heath & Air Quality (Fall 2021) Team: Carolina Rosales (Project Lead), Robert Alward, Kjirsten Coleman, Katherine Howell, and Vanessa Machuca Summary: Tropospheric ozone (O3)...
![Mean annual solar energy potential per building footprint in kilowatts, created by using MERRA-2 and CERES FlashFlux Earth observations processed by NASA POWER for a 30-year period from 1990 to 2020. Projected over a 3-inch Digital Surface Model of Montgomery County, MD. Brighter colors represent higher areas of solar potential while darker colors visualize less exposure to solar irradiance. Building footprints with high solar potential indicate areas where solar panels could be installed to generate high e](/sites/default/files/styles/lis/public/2022-03/2021Fall_LaRC_WashingtonDC%26MarylandEnergy_WebsiteImage_FD.jpg.webp?itok=EkgSK9hu)
Topic
Washington DC & Maryland Energy (Fall 2021) Team: Edward Cronin (Project Lead), Ashley Fernando, Jarret James, and Rupa Kurinchi-Vendhan Summary: In line with the Sustainable...
![Oversampled nitrogen dioxide (NO2) atmospheric column data from select months (May – September) in 2019 derived from the OMI sensor aboard the NASA Aura satellite. The darker purple colors reflect lower concentrations of NO2 in our study region, but as the color scale moves towards brighter yellow it represents high concentrations of NO2. Assessing the NO2 gas distribution, in addition to other gases, can aid project partners in identifying hotspots of emissions.](/sites/default/files/styles/lis/public/2022-03/2021Fall_LaRC_SoutheastMichiganNorthernOhioHealthandAirQuality_WebsiteImage.png.webp?itok=-X50Y6mw)
Southeast Michigan Health & Air Quality (Fall 2021) Team: Mariam Moeen (Project Lead), Helen Turvene, Yuan Lin, and Albert Kodua Summary: Pollutants resulting from industrial...
![Processed imagery using 2020 Landsat 8 OLI data showing turbidity. Fire Island, a barrier island located in New York, is displayed on January 21, 2020. Shades of red indicates more turbidity and shades of blue indicate less turbidity, while black indicates land. Lower turbidity indicates areas with less sediment movement.](/sites/default/files/styles/lis/public/2022-04/2021Fall_MA_FireIslandWater_WebsiteImage_1.png.webp?itok=6Qx7-qJW)
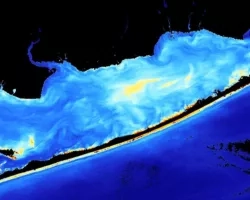
Fire Island Water Resources (Fall 2021) Team: Kelly Young (Project Lead), Tyler Albrethsen, Yuhe Chang, Brenna Hatch, and Lisa Tanh Summary: Fire Island National Seashore...
![NDVI-processed imagery using Landsat 8 OLI data from June 1 to November 31, 2021. Showing Punakha, Bhutan, vegetative areas are represented by green while black depicts non-vegetative areas. Bhutan is located in the Himalayas with altitude ranging from 550 ft. to 23,000 ft., resulting in vast diversity of both ecosystem and agricultural products. Examining vegetation area help in developing a crop mask and remotely sensed data collection protocol for rice in Bhutan.](/sites/default/files/styles/lis/public/2022-03/2021Fall_MSFC_BhutanAg_WebsiteImage.png.webp?itok=z2epU4rN)
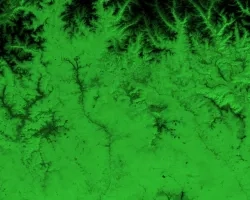
Bhutan Agriculture (Fall 2021) Team: Yeshey Seldon (Project Lead), Kusal Khandal, Sherab Dolma, and Wangdrak Dorji Summary: Rice cultivation in Bhutan has been increasingly threatened...
![Landsat 8 OLI derived MNDWI imagery mosaicked from October 17, 2020, to December 2, 2020. Located near the Río Patuca (Patuca River) in Ahuas, Honduras, permanent water and flood is represented as bright red and orange while blue depicts other land cover types and clouds. Examining floods from disasters like Hurricanes Eta and Iota helps decision makers improve mitigation and response efforts.](/sites/default/files/styles/lis/public/2022-03/2021Fall_MSFC_CentralAmericaDisasters_WebsiteImage.png.webp?itok=pweSILBO)
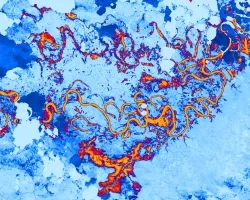
Central America Disasters (Fall 2021) Team: Caroline Williams (Project Lead), Lauren Carey, Maria De Los Santos, Deanna Fanelli, and Payton Ireland Summary: In November 2020...
![NDTI-processed imagery using 1999-2021 Landsat 7 ETM+ and Landsat 8 OLI data, processed with SHARQ and ORCAA. Displayed is an East-oriented view of St. Joseph Peninsula off the Florida panhandle. Brighter shades of pink indicate greater change in turbidity levels post-Hurricane Michael, while shades of purple represent lower turbidity change. This increase in sediment post-hurricane indicates disturbed aquatic vegetation due to extreme storm events.](/sites/default/files/styles/lis/public/2022-03/2021Fall_MSFC_StJosephPeninsulaDisasters_WebsiteImage.png.webp?itok=zl4XgGUp)
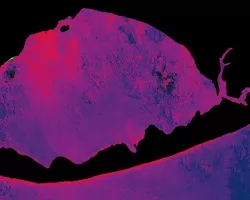
St. Joseph Peninsula Disasters (Fall 2021) Team: Erica Kriner (Project Lead), Paige Aldenberg, James Byrne, Brianne Kendall, and Nicholas Roberge Summary: T.H. Stone Memorial St...
![Terra MODIS-processed imagery using version 6 MOD16A2, calculated by averaging monthly evapotranspiration data from 2001 to 2020. This image includes several central Midwestern states along the Great Lakes. The lighter green areas indicate high levels of evapotranspiration affecting the water budget and health of agriculture while the purple areas represent no data values consistent of urban landscapes with impervious surfaces or large bodies of water.](/sites/default/files/styles/lis/public/2022-03/2021Fall_NC_MidwestWaterResources_RawWebsiteImage_RD.jpg.webp?itok=Q6pTpnRi)
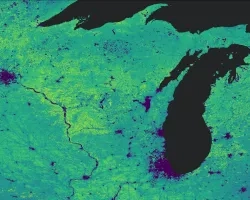
Midwest Water Resource (Fall 2021) Team: Emma Myrick (Project Lead), Erica Barth-Naftilan, Erin Shives, and Alec Solberg Summary: Evapotranspiration (ET) is a climatic variable critical...
Applied Sciences
Capacity Building
Disasters
Ecological Conservation
Agriculture
Health & Air Quality
Water Resources