Displaying 1 - 10 of 26
![Normalized Difference Moisture Index (NDMI) processed 2021 Landsat 8 OLI imagery over land and Sentinel-2 MSI over ocean, ranging from yellow (low) to blue (high), for Hilo, Hawaii. Overlayed with four-day rainfall accumulation cells in blue acquired during Hurricane Lane (Aug 22-25, 2018) from CHIRPS Daily. NDMI monitors water content of leaves and is useful for classifying land cover. Impervious surfaces and areas that have received excessive historical rainfall are susceptible to future flood events.](/sites/default/files/styles/lis/public/2022-03/2021Fall_AZ_HawaiiIslandDisasters_WebsiteImage_1440.png.webp?itok=UF3NMIoI)
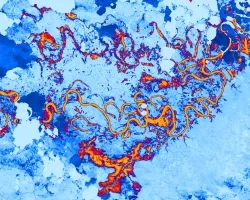
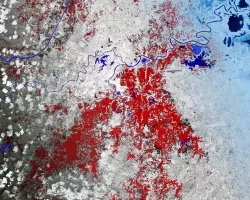
Hawai‘i Island Disasters (Fall 2021) Team: Garren Kalter (Project Lead), Rose Eichelmann, Sanketa Kadam, Erin Azuma, and Anna Mikkelsen Summary: As the County of Hawai‘i...
![Landsat 8 OLI derived MNDWI imagery mosaicked from October 17, 2020, to December 2, 2020. Located near the Río Patuca (Patuca River) in Ahuas, Honduras, permanent water and flood is represented as bright red and orange while blue depicts other land cover types and clouds. Examining floods from disasters like Hurricanes Eta and Iota helps decision makers improve mitigation and response efforts.](/sites/default/files/styles/lis/public/2022-03/2021Fall_MSFC_CentralAmericaDisasters_WebsiteImage.png.webp?itok=pweSILBO)
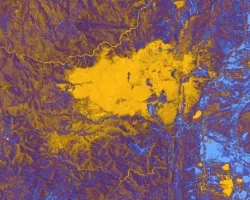
Central America Disasters (Fall 2021) Team: Caroline Williams (Project Lead), Lauren Carey, Maria De Los Santos, Deanna Fanelli, and Payton Ireland Summary: In November 2020...
![NDTI-processed imagery using 1999-2021 Landsat 7 ETM+ and Landsat 8 OLI data, processed with SHARQ and ORCAA. Displayed is an East-oriented view of St. Joseph Peninsula off the Florida panhandle. Brighter shades of pink indicate greater change in turbidity levels post-Hurricane Michael, while shades of purple represent lower turbidity change. This increase in sediment post-hurricane indicates disturbed aquatic vegetation due to extreme storm events.](/sites/default/files/styles/lis/public/2022-03/2021Fall_MSFC_StJosephPeninsulaDisasters_WebsiteImage.png.webp?itok=zl4XgGUp)
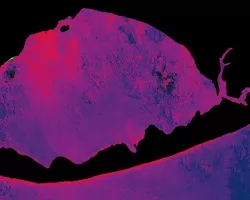
St. Joseph Peninsula Disasters (Fall 2021) Team: Erica Kriner (Project Lead), Paige Aldenberg, James Byrne, Brianne Kendall, and Nicholas Roberge Summary: T.H. Stone Memorial St...
Applied Sciences
DEVELOP
VALUABLES
Capacity Building
Disasters
Health & Air Quality
Water Resources
![2022 Spring AZ Phoenix Climate Website Image](/sites/default/files/styles/lis/public/2022-06/2022Spring_AZ_PhoenixClimate_WebsiteImage_v2.png.webp?itok=UX2zeyTY)
Topic
Phoenix Climate (Spring 2022) Team: Alison Bautista (Project Lead), Haley Stuckmeyer, Gloria Liu, Ben Schafermeyer Summary: Phoenix, Arizona is the hottest city in the United...
![2022 Spring CO Boulder County Disasters Website Image](/sites/default/files/styles/lis/public/2022-06/2022Spring_CO_BoulderCountyDisasters_WebsiteImage.png.webp?itok=1X2GgkIw)
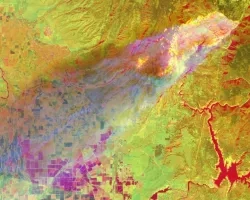
Boulder County Disasters (Spring 2022) Team: Sarah Hettema (Project Lead), Jennifer Rogers, Ibuki Sugiura, Erin Twaddell Summary: In recent years, record-breaking wildfire activities in the...
![2022 Spring JPL Chili Disasters Website Image](/sites/default/files/styles/lis/public/2022-06/2022Spring_JPL_ChileDisasters_WebsiteImage_v4.png.webp?itok=SUHWg_vy)
Chile Disasters (Spring 2022) Team: Maria De Los Santos (Project Lead), Cooper Campbell, Karen Alvarez, Hannah Ferriby Summary: Wildfires in Chile in the last decade...
![2022 Spring PUP Mexico Disasters Website Image](/sites/default/files/styles/lis/public/2022-06/2022Spring_PUP_MexicoDisasters_WebsiteImage_v2.png.webp?itok=3ZfxI279)
Mexico Disasters (Spring 2022) Team: Philip Casey (Project Lead), John Willis, Sean Nelsen, Zachary Silberman Summary: In this project, NASA DEVELOP partnered with Mexico’s National...
![2022 Spring VEJ Needs Assessment Disasters Website Image](/sites/default/files/styles/lis/public/2022-06/2022Spring_VEJ_NeedsAssessmentDisasters_WebsiteImage_v2.png.webp?itok=Sk4jzWW0)
Environmental Justice Needs Assessment for Disasters (Spring 2022) Team: Julianne Liu (Project Lead), Emma Cooper, Natasha Johnson-Griffin, Keegan Kessler Summary: Natural disasters pose an increasing...
![Present day Island of Hawai'i coastal flood risk, with higher risk indicated in dark blue, was modeled to aid the County of Hawai'i in their shoreline setback plan. Sea Surface Temperature Anomaly (SSTA) data from 2022 GHRSST MODIS indicate low temperatures in the East (red) to high in the West (orange). Inland, high probability locations of wetlands are shown in bright yellow and will aid in climate adaptation planning. ](/sites/default/files/styles/lis/public/2022-11/2022Sum_AZ_HawaiiClimate_WebsiteImage_0.jpg.webp?itok=k16qFZYS)
Topic
Hawai'i Island Climate (Summer 2022) Team: Lisa Tanh (Project Lead), Ian Lee, Connor Racette, Matilda Anokye Summary: Climate-induced sea level rise poses a risk to...