Displaying 11 - 20 of 35
![2022 Spring MA Padre Island Water Resources Website Image](/sites/default/files/styles/lis/public/2022-06/2022Spring_MA_PadreIslandWater_WebsiteImage.png.webp?itok=N-Fc0Plr)
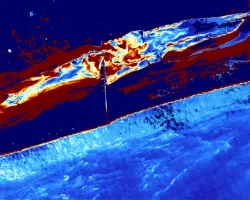
Padre Island Water Resources (Spring 2022) Team: Lisa Tanh (Project Lead), Yuhe Chang, Rachel Lazzaro, Cameron Reimer Summary: Land loss along Padre Island National Seashore...
![2022 Spring MSFC Okefenokee Water Resources Website Image](/sites/default/files/styles/lis/public/2022-06/2022Spring_MSFC_OkefenokeeWaterResources_WebsiteImage_v2.png.webp?itok=aAUGYAb3)
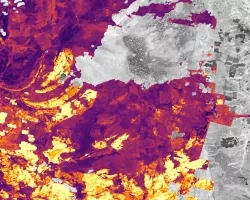
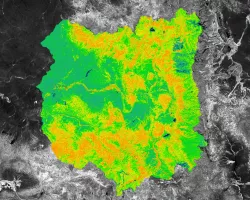
Okefenokee Water Resources (Spring 2022) Team: Brianne Kendall (Project Lead), Kyle Steen, Hailey Schmidt, Laramie Plott Summary: The Okefenokee Swamp is a vital ecosystem known...
![2022 Spring NCEI Midwest Water Resources Website Image](/sites/default/files/styles/lis/public/2022-06/2022Spring_NCEI_MidwestWaterResources_WebsiteImage_v2.png.webp?itok=rHGmOSsl)
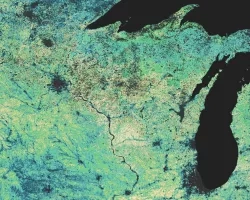
Midwest Water Resources II (Spring 2022) Team: Addison Pletcher (Project Lead), Alec Solberg, Erin Shives, Max Rock Summary: Seasonal water variability in the midwestern United...
![Water quality times series regression for the year 2020 using Landsat 8 ETM+ data of Aquatic Preserves in Florida. Dark Green represents the amplitude of Chlorophyll-A levels, DEM model overlayed on top represents Submerged Aquatic Vegetation. This imagery was used to help determine water quality for mangroves in 2020.](/sites/default/files/styles/lis/public/2022-11/2022Sum_ARC_NewYorkEco_WebsiteImage_v3_final.png.webp?itok=p6D_OUc0)
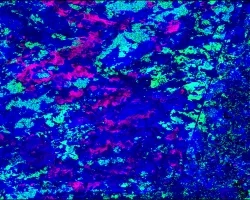
Florida Water Resources (Summer 2022) Team: Samuel Perrello (Project Lead), Kyle Stark, Koya Oki, Emily Heltzel Summary: Since their first sightings in the U.S. in...
![Aqua MODIS-derived nighttime land surface temperature climate normal for 2002–2022 across the southeastern portion of Organ Pipe Cactus National Monument. Shades of green and blue indicate lower mean nighttime temperatures while shades of orange and red indicate higher temperatures. Tinajas in areas with higher (red) nighttime temperatures are at risk of drying out. This data will help park managers prioritize conservation in identified areas as warming and drying trends continue across the western Sonoran](/sites/default/files/styles/lis/public/2022-11/2022Sum_NC_WesternSonoranDesertWater_WebsiteImage.jpg.webp?itok=Y6HvO1u9)
Western Sonoran Water Resources (Summer 2022) Team: Anne Britton (Project Lead), Deirdre An, Seamus Geraty, Charles Nixon Summary: Ephemeral freshwater rock pools, known as tinajas...
![Summer 2022 Yampa Water Resources](/sites/default/files/styles/lis/public/2022-11/2022Sum_CO_YampaWater_WebsiteImage.jpg.webp?itok=1omwELNy)
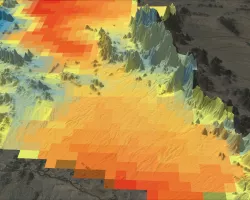
Yampa Water Resources (Summer 2022) Team: Samrin Sauda (Project Lead), Ethan Gates, Erin Weitzel, Morgan Guttman Summary: The Upper Yampa River Watershed (UYRW), located in...
![Summer 2022 Puget Sound Water Resources](/sites/default/files/styles/lis/public/2022-11/2022Sum_CO_PugetSoundWater_WebsiteImage_V2.jpg.webp?itok=mMOCVh-6)
Puget Sound Water Resources (Summer 2022) Team: Mike Hitchner (Project Lead), Lily Oliver, Sofia Fall, Lyndsay Zemanek Summary: Bull kelp (Nereocystis luetkeana) is a critical...
![Enhanced Wetland Classification of the Slave River Delta, NWT, Canada using Landsat 8 OLI imagery from June through August 2021. Most of the colors represent different categories of wetland. Many of the darker green areas represent areas where wetlands have transitioned to dryer forests or shrubs in recent decades.](/sites/default/files/styles/lis/public/2022-12/2022Sum_MA_GreatSlaveLakeWater_WebsiteImage.png.webp?itok=JnQr2WJ-)
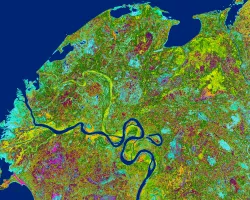
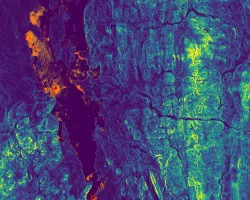
Mapping Long-Term Changes in the Hydroecology of the Slave River Delta Using NASA Earth Observations
Great Slave Lake Water Resources (Summer 2022) Team: Yuhe Chang (Project Lead), Virgil Alfred, Ethan McIntosh, Catherine Shea Summary: Indigenous communities around the Great Slave...
![Top layer: NDTI processed imagery of Lake Champlain derived from Landsat 8 TOA data (5/1/21 - 9/30/21). Bright orange and red represent areas of greater turbidity, which often corresponds to algal presence, whilst dark areas indicate low turbidity. Bottom layer: Slope imagery from SRTM (last updated 11/2018) of the Lake Champlain Watershed. Yellow shows areas with higher slopes, which have a greater risk of phosphorus runoff, while blue shows areas with a lesser slope.](/sites/default/files/styles/lis/public/2022-12/2022Sum_MSFC_LakeChamplainWater_WebsiteImage.png.webp?itok=WnLYkj9z)
Lake Champlain Water Resources (Summer 2022) Team: Brianne Kendall (Project Lead), Laramie Plott, Ian Turner, Aaron Carr Summary: Lake Champlain provides clean drinking water for...
![This image of the Chesapeake Bay is derived from NASA Landsat 7 ETM+ and Landsat 8 OLI imagery. It represents median Normalized Difference Turbidity Index (NDTI) turbidity levels from January 2020 through June 2022. Yellow and orange areas indicate higher turbidity levels. This imagery can be used to determine areas of the bay in which turbidity poses a threat to water quality.](/sites/default/files/styles/lis/public/2022-12/2022Sum_PUP_ChesapeakeBayWater_WebsiteImage.png.webp?itok=tBWfMYEk)
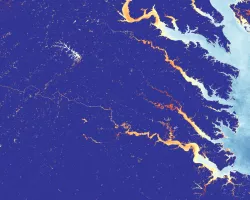
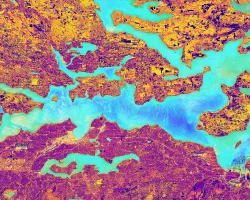
Chesapeake Bay Water Resources (Summer 2022) Team: Katherine Hahn, Julia Atayi, Julia Portmann, Abigail Sgan Summary: An increase in total suspended sediment (TSS) concentrations and...