Displaying 41 - 50 of 89
![2022 Spring PUP UHEAT Urban Development Website Image](/sites/default/files/styles/lis/public/2022-06/2022Spring_PUP_UHEATUrban_WebsiteImage_v2.png.webp?itok=aEsXqOPp)
UHEAT Urban Development (Spring 2022) Team: Akshay Agrawal (Project Lead), Myung Sik Cho, Zainab Farid, Vanessa Machuca Summary: Extreme heat is a leading weather-related cause...
![2022 Spring VEJ Needs Assessment Disasters Website Image](/sites/default/files/styles/lis/public/2022-06/2022Spring_VEJ_NeedsAssessmentDisasters_WebsiteImage_v2.png.webp?itok=Sk4jzWW0)
Environmental Justice Needs Assessment for Disasters (Spring 2022) Team: Julianne Liu (Project Lead), Emma Cooper, Natasha Johnson-Griffin, Keegan Kessler Summary: Natural disasters pose an increasing...
![2022 Spring VEJ Needs Assessment Health AQ Website Image](/sites/default/files/styles/lis/public/2022-06/2022Spring_VEJ_NeedsAssessmentHealthAQ_WebsiteImage_v4.png.webp?itok=J-RFJY8B)
Environmental Justice Needs Assessment for Health & Air Quality (Spring 2022) Team: Elizabeth Duran (Project Lead), Paige Aldenberg, Sadie Murray, Thomas Schindelman Summary: Health and...
![NDVI time series regression for the year 2021 using Landsat 8 ETM+ data within the Adirondack Park in upstate New York. Red represents the amplitude of the regression, green represents the phase of the regression, and blue represents the median NDVI. This imagery was used to help determine where ash trees are present.](/sites/default/files/styles/lis/public/2022-11/2022Sum_ARC_FloridaWaterResources_WebsiteImage_V2_final.jpg.webp?itok=raU6PLrX)
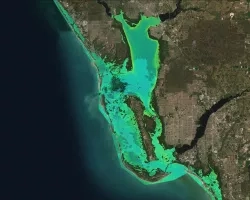
FLORIDA DISASTERS (Summer 2022) Team: Liam Megraw, Stefanie Dimayuga Mendoza, Samantha Kelly, Jesse Carlson Summary: Intensifying weather events, sea level rise, and extensive coastal development...
![Water quality times series regression for the year 2020 using Landsat 8 ETM+ data of Aquatic Preserves in Florida. Dark Green represents the amplitude of Chlorophyll-A levels, DEM model overlayed on top represents Submerged Aquatic Vegetation. This imagery was used to help determine water quality for mangroves in 2020.](/sites/default/files/styles/lis/public/2022-11/2022Sum_ARC_NewYorkEco_WebsiteImage_v3_final.png.webp?itok=p6D_OUc0)
Florida Water Resources (Summer 2022) Team: Samuel Perrello (Project Lead), Kyle Stark, Koya Oki, Emily Heltzel Summary: Since their first sightings in the U.S. in...
![Present day Island of Hawai'i coastal flood risk, with higher risk indicated in dark blue, was modeled to aid the County of Hawai'i in their shoreline setback plan. Sea Surface Temperature Anomaly (SSTA) data from 2022 GHRSST MODIS indicate low temperatures in the East (red) to high in the West (orange). Inland, high probability locations of wetlands are shown in bright yellow and will aid in climate adaptation planning. ](/sites/default/files/styles/lis/public/2022-11/2022Sum_AZ_HawaiiClimate_WebsiteImage_0.jpg.webp?itok=k16qFZYS)
Topic
Hawai'i Island Climate (Summer 2022) Team: Lisa Tanh (Project Lead), Ian Lee, Connor Racette, Matilda Anokye Summary: Climate-induced sea level rise poses a risk to...
![A remote sensing scene of wildfire extent in the Black Hills in South Dakota](/sites/default/files/styles/lis/public/2022-11/2022Sum_CO_BlackHillsWildfire_WebsiteImage.jpg.webp?itok=3SvKdSkf)
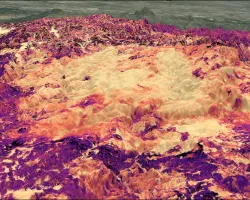
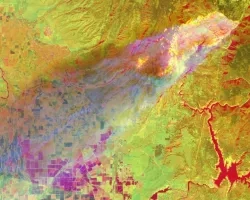
Black Hills Wildfires (Summer 2022) Team: Casey Menick (Project Lead), Haley Stuckmeyer, Heidi Rogers, Yeshey Seldon Summary: The 2000 Jasper Fire in the Black Hills...
![Forest cover and land surface temperature (LST) around Maine's Penobscot River during Summer 2021. The shades of green distinguish between evergreen (dark) and deciduous (light) forest which were classified using Landsat 8 OLI imagery. The purple gradient corresponds to LST derived from Terra MODIS where the warmest areas, including Bangor, are white. Changing land use and warming temperatures along Maine’s rivers are associated with reducing juvenile Atlantic salmon (Salmo salar) survivorship.](/sites/default/files/styles/lis/public/2022-11/2022Sum_GSFC_MaineEcoIII_WebsiteImage.jpg.webp?itok=EiYDdUqO)
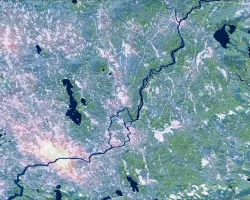
Maine Ecological Forecasting III (Summer 2022) Team: Jonathan Falciani (Project Lead), Colin Hogan, Linda Mitchell, Makario Sarsozo Summary: Shifting patterns in land use and land...
![Aqua MODIS-derived nighttime land surface temperature climate normal for 2002–2022 across the southeastern portion of Organ Pipe Cactus National Monument. Shades of green and blue indicate lower mean nighttime temperatures while shades of orange and red indicate higher temperatures. Tinajas in areas with higher (red) nighttime temperatures are at risk of drying out. This data will help park managers prioritize conservation in identified areas as warming and drying trends continue across the western Sonoran](/sites/default/files/styles/lis/public/2022-11/2022Sum_NC_WesternSonoranDesertWater_WebsiteImage.jpg.webp?itok=Y6HvO1u9)
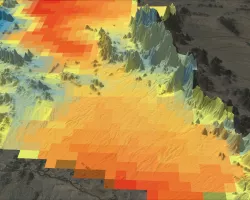
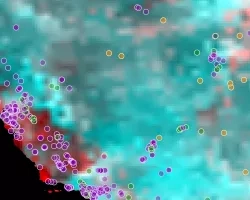
Western Sonoran Water Resources (Summer 2022) Team: Anne Britton (Project Lead), Deirdre An, Seamus Geraty, Charles Nixon Summary: Ephemeral freshwater rock pools, known as tinajas...
![2010 – 2021 NDWI-processed imagery of the greater Kansas City, Kansas region. This image combines Landsat 5, 7, and 8 highlighting dry areas in yellow through orange. Areas classified as water are identifiable in aqua blue. Areas of darker blue are considered wet but include cityscape. A major problem for urban flooding identification is the mixture of cityscape in wet areas, making it important for further investigation and data processing.](/sites/default/files/styles/lis/public/2022-11/2022Sum_MA_KansasCityDisasters_WebsiteImage.jpg.webp?itok=WCOEqekJ)
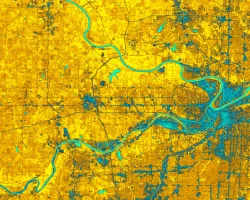
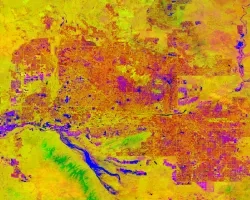
Kansas City Disasters (Summer 2022) Team: M. René Castillo, Hadwynne Gross, Eric Sjöstedt, Raychell Velez Summary: Pluvial flooding, over-saturated ground, and poor drainage systems disproportionately...