Displaying 301 - 310 of 314
![Kernel density distributions of census tract-level cooling degree days from May through September 2013 in Fahrenheit by race/ethnicity across the climate regions of New York State. Cooling degree days are calculated with a threshold of 65°. White = Non-Hispanic White, Hispanic = Hispanic/Latino of any race, Black = Non-Hispanic Black, Asian = Non-Hispanic Asian.](/sites/default/files/styles/lis/public/2023-10/Carrion%20Project%20Page%20Image.png.webp?itok=yyxxauFg)
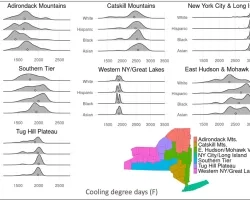
Identifying temperature disparities, energy insecurity, and social vulnerability for energy justice in New York State Team: Daniel Carrión (Yale School of Public Health), Anna Stouffer...
![Normalized Difference Water Index (NDWI) to visualize drainage networks around the Unalakleet River in Alaska, calculated from an August 2021 Landsat 8 OLI image. Yellow represents standing or flowing water and potential flood zones, while the dark blue represents drier, upland regions. Unalakleet's climate resilience planning prioritizes relocation to upland regions while avoiding areas that have experienced significant permafrost degradation.](/sites/default/files/styles/lis/public/2023-10/2023Sum_GA_UnalakleetClimate_WebsiteImage.jpg.webp?itok=9m9RUwoB)
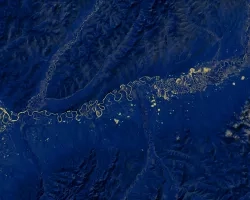
Unalakleet Climate (Summer 2023) Team: Ian Lee (Project Lead), Clara Maxwell, Daniel J. Marsden, M. Jaweed Nazary Summary: The coastal community of Unalakleet is currently...
![Runoff retention values in Richmond, VA estimated by the InVEST Urban Flood Risk Mitigation Model for a June 2, 2018, extreme rainfall event measured by GPM IMERG. Dark blue areas have high runoff retention capacity and absorbed more of the rainfall during the storm; light green areas absorbed less rainfall during the storm, increasing the likelihood of pluvial flooding. Pluvial flood risk maps help inform community planners’ efforts to protect vulnerable populations.](/sites/default/files/styles/lis/public/2023-11/2023Sum_LaRC_RichmondDisasters_WebsiteImage.jpg.webp?itok=17L81iXz)
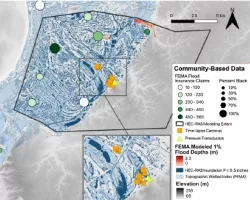
Richmond Disasters (Summer 2023) Team: Kaylee Tanner (Project Lead), Brodie Thiele, Trinity Johnson, Maggie Lincoln Summary: Pluvial flooding is the most frequent and widespread type...
![Census tract map of Corpus Christi and runoff factors.](/sites/default/files/styles/lis/public/2024-02/Zhang_Census-tract%20runoff%20factors%20in%20Corpus%20Christi_80NSSC22K1670.jpg.webp?itok=Z67hHJlZ)
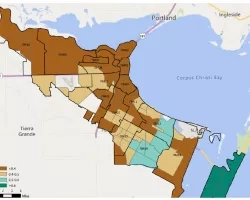
Team: • Jim Lee (Texas A&M University – Corpus Christi), co-I • Yuxia Huang (Texas A&M University – Corpus Christi), co-I • Lapone Techapinyawat (Texas...
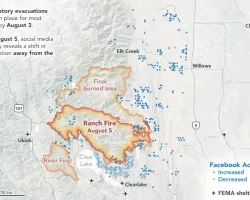
Team Members: Miriam Marlier (University of California, Los Angeles), Claire Schollaert (University of Washington), Diane Garcia-Gonzales (University of California, Los Angeles), Michael Jerret (University of...
![Map of Centreville, IL, and surrounding communities of the American Bottom. Circle area reflects the percent of Black residents in each community. Circle color indicates the number of FEMA flood insurance claims by community. FEMA 100-year flood modeled inundation depths overlain in red, FEMA-reported topographic wetted index reported in light blue. Preliminary HEC-RAS model results, calibrated using community-based monitoring (orange squares for cameras, yellow triangles for pressure transducers) for a 0.5](/sites/default/files/styles/lis/public/2024-02/Masteller%20Project%20Page%20Image.png.webp?itok=e8-AMIVJ)
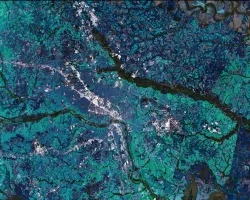
Team Members: Claire Masteller (Washington University), Jose Constantine (Williams College), Hossein Hosseiny (Washington Univeristy in St. Louis) Executive Summary: Low-income and minority communities are often...
Team Members: Narcisa G. Pricope (University of North Carolina Wilmington and Mississippi State University), Leah Mayo (University of North Carolina Wilmington), Joanne Halls (University of...