Displaying 151 - 160 of 162
![NDMI-index imagery from Landsat 8 OLI and SRTM data, taken on August 30, 2022. The image showcases vegetation water content in the northern part of Capitol Reef National Park. Blue regions indicate vegetation with higher moisture content, vital in semi-arid environments. In contrast, red and yellow regions suggest less hydrated vegetation. This image offers valuable insights into moisture dynamics in arid regions like Capitol Reef.](/sites/default/files/styles/lis/public/2024-01/2023Sum_ID_CapitolReefEco_WebsiteImage.jpg.webp?itok=nnyT7FVy)
Capitol Reef Ecological Conservation (Summer 2023) Team: Vanchy Li (Project Lead), Evgeny Mazko, Kyleigh Kowalski, Drew Comin Summary: Capitol Reef National Park (CARE) reached out...
![Normalized Difference Vegetation Index (NDVI) of the Savannah River Estuary in Georgia calculated from an October 2022 image taken by NASA's Landsat 8 OLI sensor. Low NDVI values, including water, are represented in blue, while high NDVI values, showing areas of higher vegetation, are in green. Saltwater intrusion into coastal soils is impacting vegetation health in this area, causing tree die-off and the formation of ghost forests.](/sites/default/files/styles/lis/public/2024-01/2023Sum_JPL_SECoastEco_WebImage.jpg.webp?itok=r2tt6Mye)
Southeast Coast Ecological Conservation (Summer 2023) Team: Emma Cheriegate (Project Lead), Eleri Griffiths, Quintin Munoz, Vivienne von Welczeck Summary: Shallow aquifers along the southeastern US...
![Lake Anna NDCI calculated using Sentinel-2 MSI images overlaying surface temperature imagery processed from Landsat 8 OLI data from May to September of 2021. Surface temperature is represented by shades of blue and green. Within the body of the lake, chlorophyll concentrations are represented on a gradient scale from purple to yellow, with yellow indicating highest concentrations. Higher temperatures can increase chlorophyll concentrations and are therefore of interest for Harmful Algal Blooms in Lake Anna.](/sites/default/files/styles/lis/public/2024-01/2023Sum_LaRC_LakeAnnaWater_WebsiteImage_v3.jpg.webp?itok=yv0lTk6B)
Topic
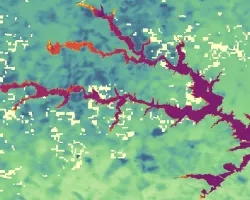
Lake Anna Water Resources (Summer 2023) Team: Olivia Etherton (Project Lead), Caroline Bahun, Alexander Krest, Justin Wilder Summary: Lake Anna is a man-made reservoir and...
![Magnitude of largest model break in Continuous Change Detection Algorithm harmonic regression model, indicative of clearcut logging in the Oregon coast range forests. Imagery from Landsat 4-5 TM, Landsat 7 ETM+, and Landsat 8-9 OLI from across the study period 2000-2021 over standard hill shade. Patches of blue show clear cut areas with lavender then yellow indicating higher magnitude. Green areas represent forests untouched during the study period.](/sites/default/files/styles/lis/public/2024-01/2023Sum_MA_OregonCoastRangeEco_websiteImage.jpg.webp?itok=sGJs5DSB)
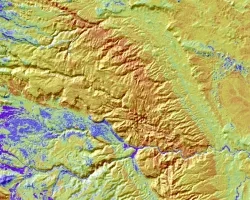
Oregon Coast Range Ecological Conservation (Summer 2023) Team: Emily French (Project Lead), Uma Edulbehram, Sarah Hughes, Madison Arndt Summary: Logging operations are widespread across the...
![Daytime average land surface temperature over June 2022 from ECOSTRESS, an instrument on the ISS. Warm colors highlight the City of Huntsville, which is surrounded by central North Alabama. In both color gradients, darker colors represent higher temperatures. The Tennessee River, together with Wheeler Lake (left) and Lake Guntersville (right), appear black. Surface temperature is one factor that can help the local government decide where to focus tree-planting efforts to mitigate urban heat.](/sites/default/files/styles/lis/public/2024-01/2023Sum_MSFC_HuntsvilleUrbanII_WebsiteImage.png.webp?itok=4ZkWXUeU)
Topic
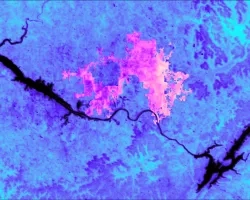
Huntsville Urban Development II (Summer 2023) Team: James Karroum (Project Lead); Awroni Bhaduri, Kindrea Gibbons, Natalie O'Kraski Summary: Huntsville, Alabama has seen a boom in...
![Average aerosol optical depth (AOD) for the months of May and June in 2015 in Oregon and Washington, derived from MODIS data. Orange represents higher aerosol concentrations whereas purple represents areas with lower aerosol concentrations. The AOD averages show higher observed AOD along the coasts of Oregon and Washington.](/sites/default/files/styles/lis/public/2024-01/2023Sum_NC_PacificNorthWestHAQ_WebsiteImage.jpg.webp?itok=CKJ1vDx_)
Topic
Pacific Northwest Health & Air Quality (Summer 2023) Team: Abby Sgan (Project Lead), Greta Bolinger, Tallis Monteiro, Cristina Villalobos-Heredia, Taylor West Summary: Recent studies have...
![Impervious surface imagery derived from Landsat 9 OLI-2 data. This composite was captured over the Finger Lakes region between April and October of 2022. Blue hues indicate dense vegetation while yellow hues indicate impervious areas. Areas in green indicate agricultural fields of interest to NGOs in the region that aim to prevent the conversion of agricultural lands to urban development.](/sites/default/files/styles/lis/public/2024-01/2023Sum_PUP_NewYorkEco_WebsiteImage.jpg.webp?itok=gjo4ogVR)
New York Ecological Conservation (Summer 2023) Team: Sam Schulteis (Project Lead), Sam Haas, Stephanie Willsey, Oliver Wilson Summary: Farmland provides ecosystems and communities with services...
![Normalized difference vegetation index (NDVI) calculated from Landsat 8 OLI showing land and aquatic vegetation around the Kankakee River in northeast Illinois on June 9, 2022. For land, dark blue represents high vegetation while light blue represents low vegetation. For water, light orange represents lack of aquatic vegetation, while purple represents the presence of aquatic vegetation. The image shows where along the Kankakee River aquatic vegetation exists.](/sites/default/files/styles/lis/public/2024-01/2023Sum_PUP_KankakeeWater_WebsiteImage.png.webp?itok=9byn7Wpt)
Topic
Kankakee Water Resources (Summer 2023) Team: Marisa Smedsrud (Project Lead); Hayden Hoffmeister; Oluwatosin Orimolade; Barira Rashid Summary: In recent years, unpredictable grassing events have occurred...
![NDVI-processed image from Landsat 8 OLI June 2022 data. Black and magenta indicates Portland's built landscape, with the bright magenta depicting the highest concentrations of impervious surfaces. In light pink, the Willamette River dissects the city with surrounding green vegetation. The NDVI conveys areas with high urban build-up with a lack of access to greenspace, illustrating lived experiences of urban heat and contributing to Depave's knowledge of areas that are in most need of depaving.](/sites/default/files/styles/lis/public/2024-01/2023Sum_VEJ_PortlandUrban_WebsiteImage.png.webp?itok=hUDAucTE)
Topic
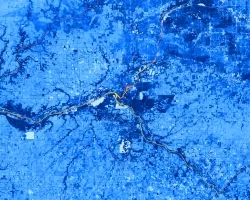
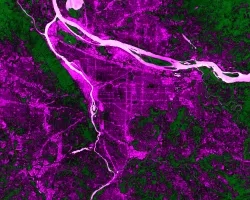
Portland Urban Development (Summer 2023) Team: Keegan Kessler (Project Lead), Hadwynne Gross, Jordan Larson, Adam Nayak Summary: Urban heat is a pressing concern in Portland...
![2022 imagery of 95th percentile Aerosol Optical Depth (AOD) data from Terra/Aqua MODIS mapped against social vulnerability data from the EPA's EJScreen within the San Joaquin Valley's census tracts. Pink indicates higher levels of at-risk populations, and blue indicates higher levels of AOD. Darker shades of blue and purple indicate an overlap of high levels of air pollution and high at-risk population.](/sites/default/files/styles/lis/public/2024-01/2023Sum_VEJ_SanJoaquinValleyHAQ_WebsiteImage.png.webp?itok=RWE-BbSo)
Topic
San Joaquin Valley Health & Air Quality (Summer 2023) Team: Jonathan Szeto (Project Lead), Jasper Beardslee, Piper Christian, Bethany MacCarter, Alma Quintero Summary: Little Manila...