SUMMARY
Date: Jan. 15, 2022
Type: Volcanoes, Tsunamis
Region: Oceania, Tonga
Info & Resources:
- View Products on the NASA Disasters Mapping Portal
- NASA Disasters program resources for volcanoes
- NASA Disasters program resources for tsunamis
- Analysis and imagery from NASA Earth Observatory
- Updates from the Pacific Disaster Center
- Damage Proxy Maps from the Earth Observatory of Singapore and the NASA JPL ARIA Program
- S02 Monitoring Gallery from the NASA Atmospheric Chemistry and Dynamics Laboratory
- VIIRS and OMPS data from the NASA Direct Readout Laboratory
Update Feb. 17, 2022
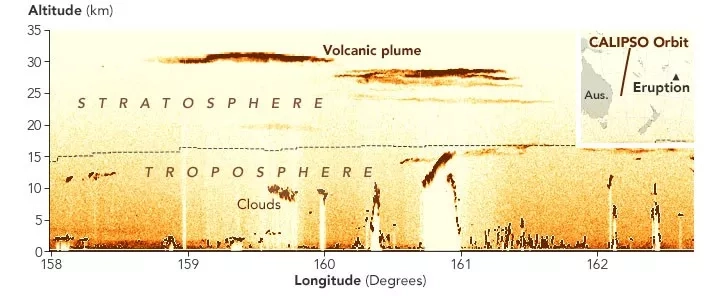
Scientists at NASA’s Langley Research Center analyzed data from NOAA’s Geostationary Operational Environmental Satellite 17 (GOES-17) and the Japanese Aerospace Exploration Agency’s (JAXA) Himawari-8 to calculate that the plume from the Jan.15 volcanic eruption rose to 58 kilometers (36 miles) at its highest point, making it likely the highest volcanic plume in the satellite record.
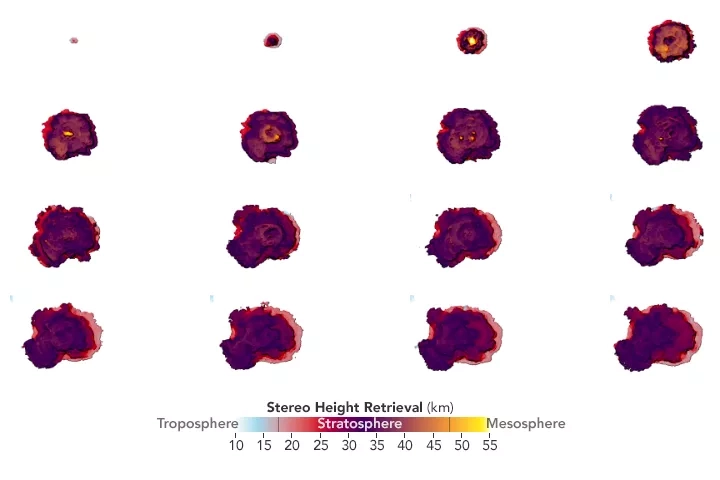
“The intensity of this event far exceeds that of any storm cloud I have ever studied,” said Kristopher Bedka, an atmospheric scientist at NASA Langley who specializes in studying extreme storms. “We are fortunate that it was viewed so well by our latest generation of geostationary satellites and we can use this data in innovative ways to document its evolution.” Bedka is also principal investigator for the NASA ROSES A.37 project "Hail Storm Risk Assessment Using Space-Borne Remote Sensing Observations and Reanalysis Data".
Read the full story at NASA Earth Observatory: Tonga Volcano Plume Reached the Mesosphere
Update Feb. 4, 2022
The powerful underwater volcanic eruption that blanketed the island nation of Tonga with ash and sent tsunami waves across the world also caused ripples in Earth’s ionosphere, according to measurements from the Global Differential GPS System (GDGPS) managed by NASA’s Jet Propulsion Laboratory in Southern California.
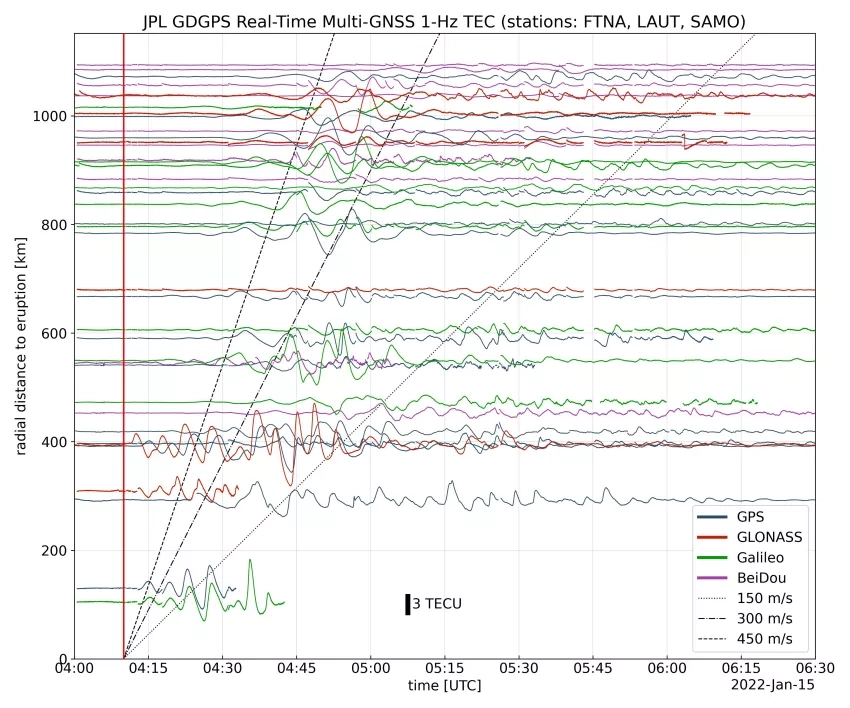
Read the full article: Tonga Eruption Sent Ripples Through Earth’s Ionosphere
Update Jan. 26, 2022
NASA's Disasters program is continuing efforts to monitor the impacts of the volcanic eruption that brought damaging tsunami waves and ashfall to the island nation of Tonga. Now that communications with the island have been restored, the team is in touch with representatives from the Tonga Ministry of Lands and Natural Resources, who have requested assistance with obtaining data for earthquake land movement, sea level, and bathymetric data on the volcano.
New datasets have been added to the NASA Disasters Mapping Portal to support the event, including new amplitude Damage Proxy Maps and sulfur dioxide (SO2) emissions data from the Ozone Mapping and Profile Suite (OMPS) instrument.
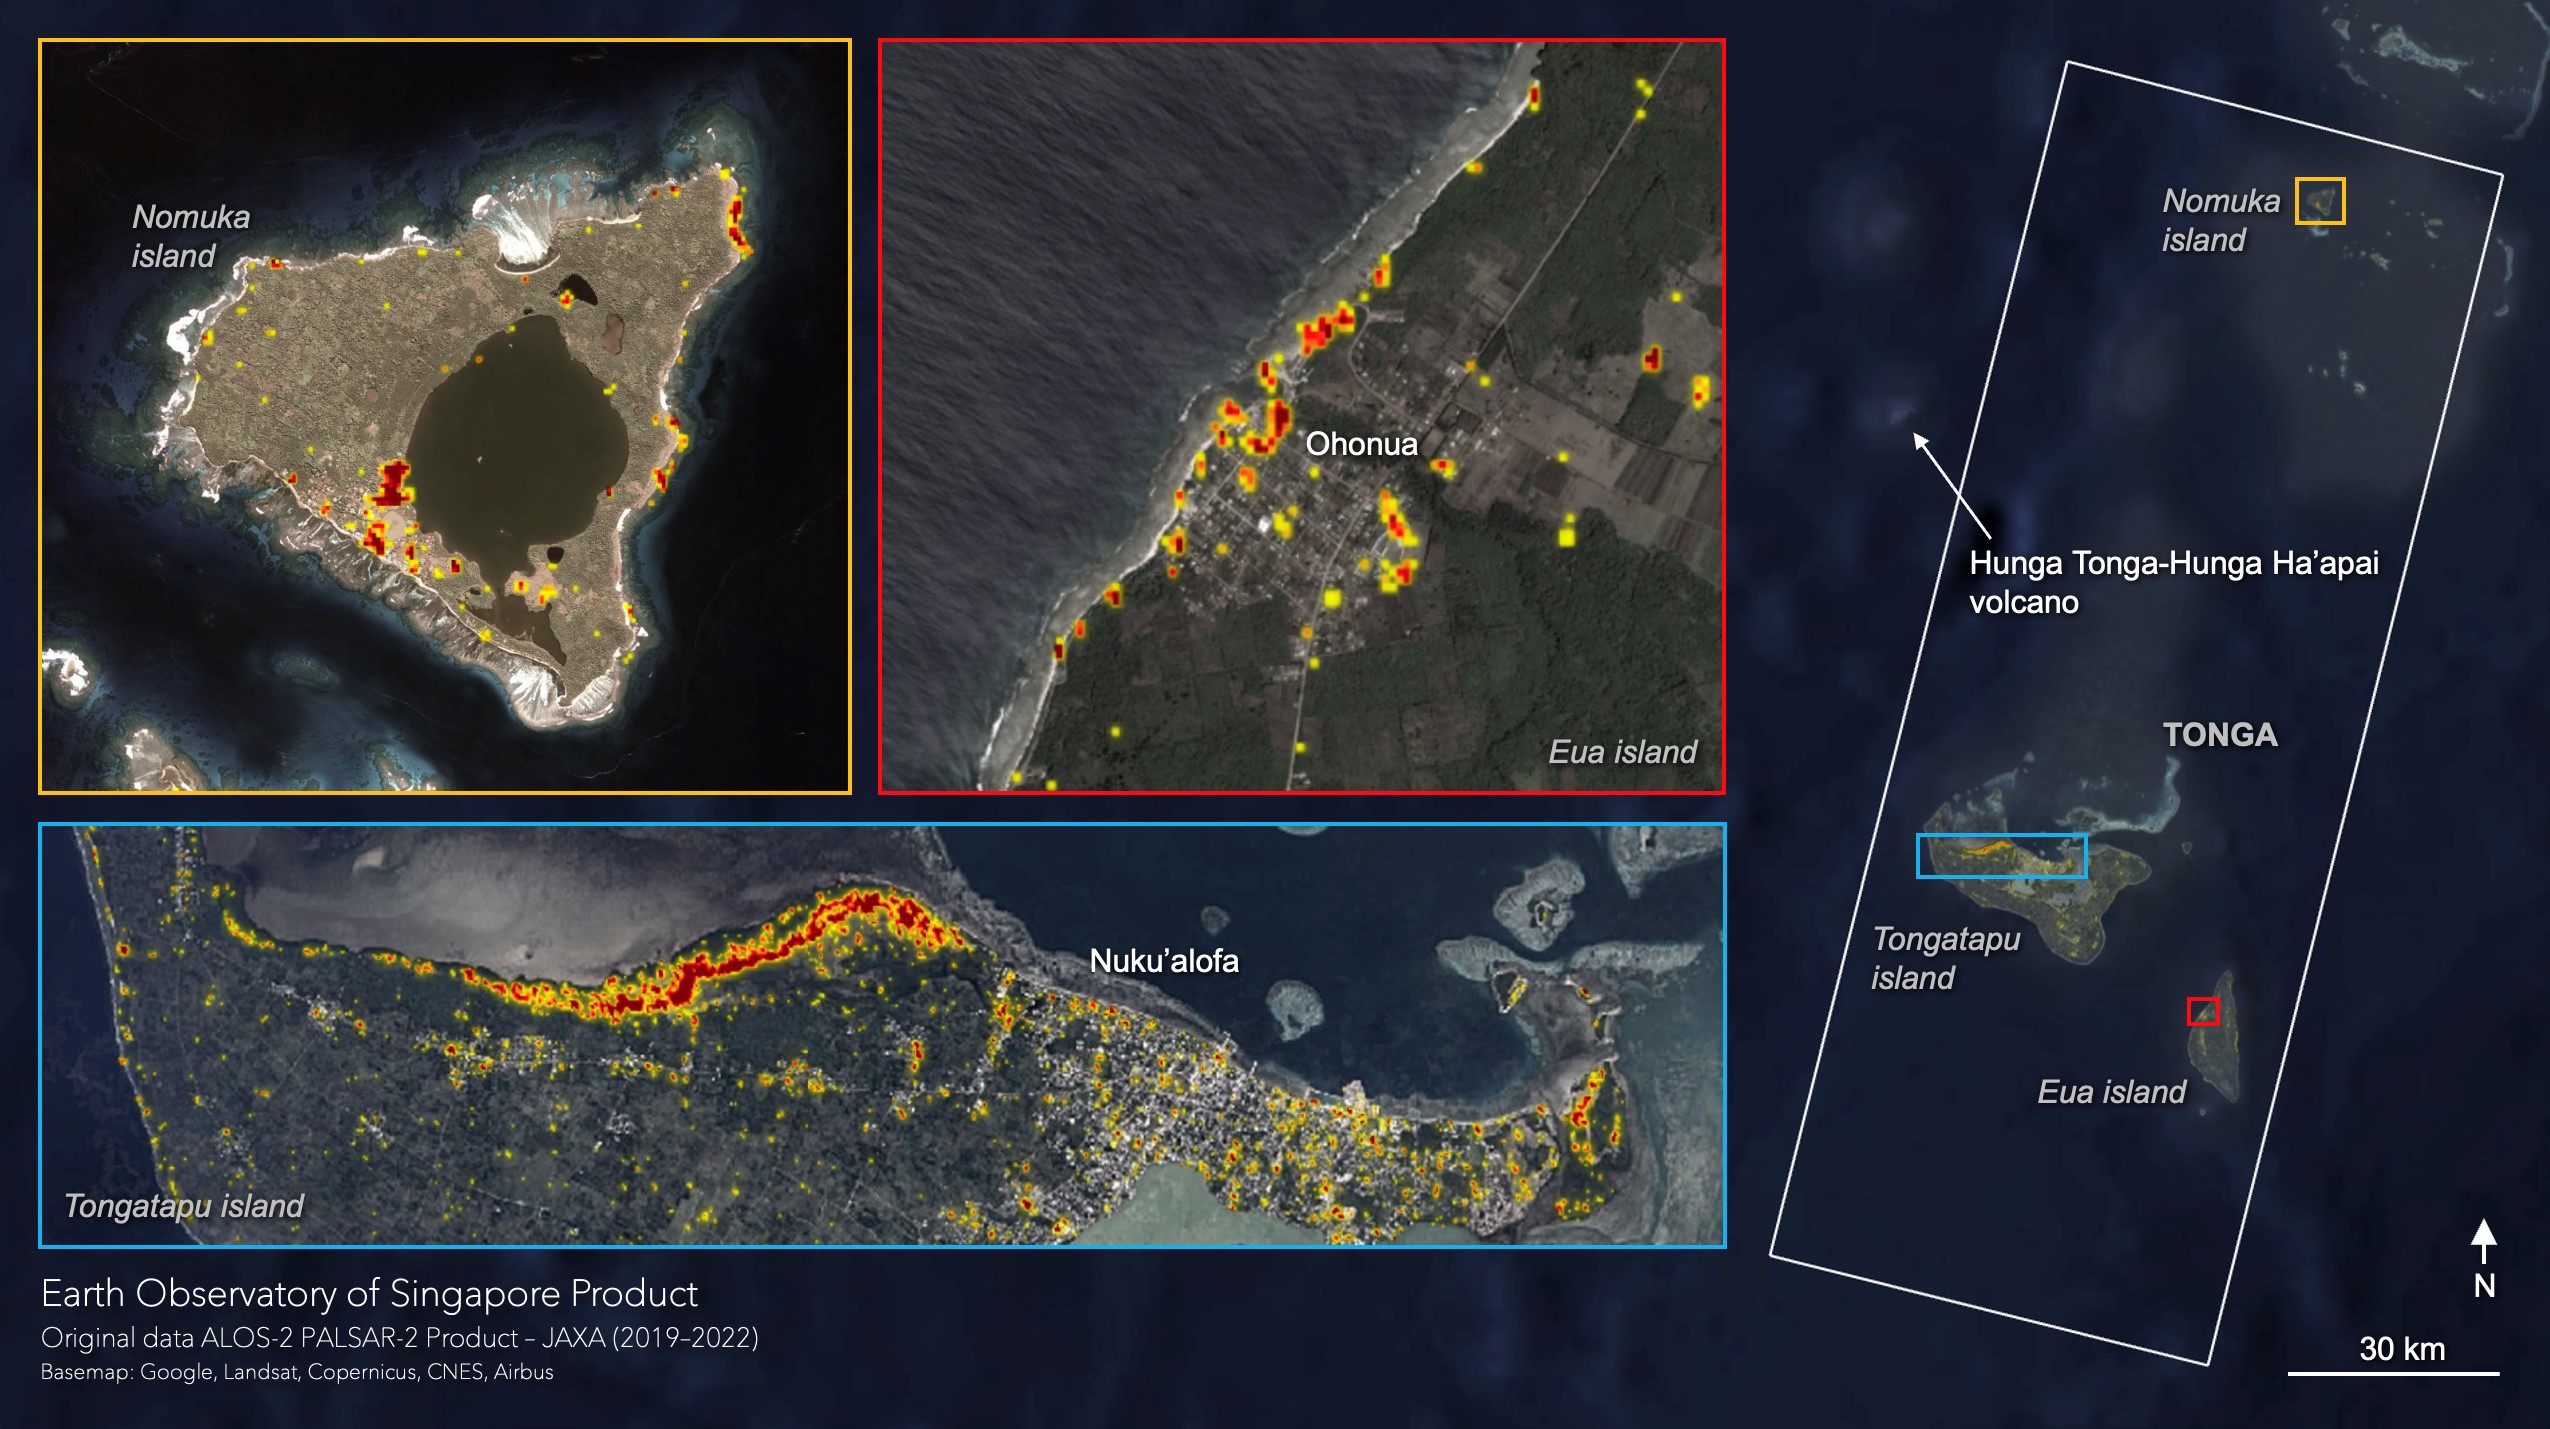
The above Damage Proxy Map (DPM) shows likely damaged buildings and other structures from the tsunami waves that struck the islands after the explosive eruption of Hunga Tonga Hunga Ha-apai. Tongatapu is the most populated island in Tonga and home to Tonga's capital, Nukuʻalofa, which sustained significant damage from the tsunami waves. This map was derived from synthetic aperture radar (SAR) imagery acquired by the Japan Aerospace Exploration Agency (JAXA) ALOS-2 satellites before (Mar, 9, 2019, Mar. 7, 2020) and after (Jan. 22, 2022) the event. The large white polygon indicates the coverage area, and each pixel of damage detection measures about 30 meters across. More significant surface change is depicted as the color varies from yellow to red. Preliminary validation was done by comparing with high-resolution optical imagery. This damage proxy map should be used as a guide to identify damaged areas, and may be less reliable over vegetated areas.
Update Jan. 21, 2022
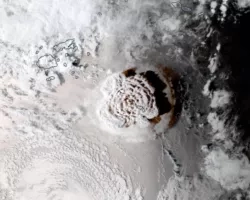
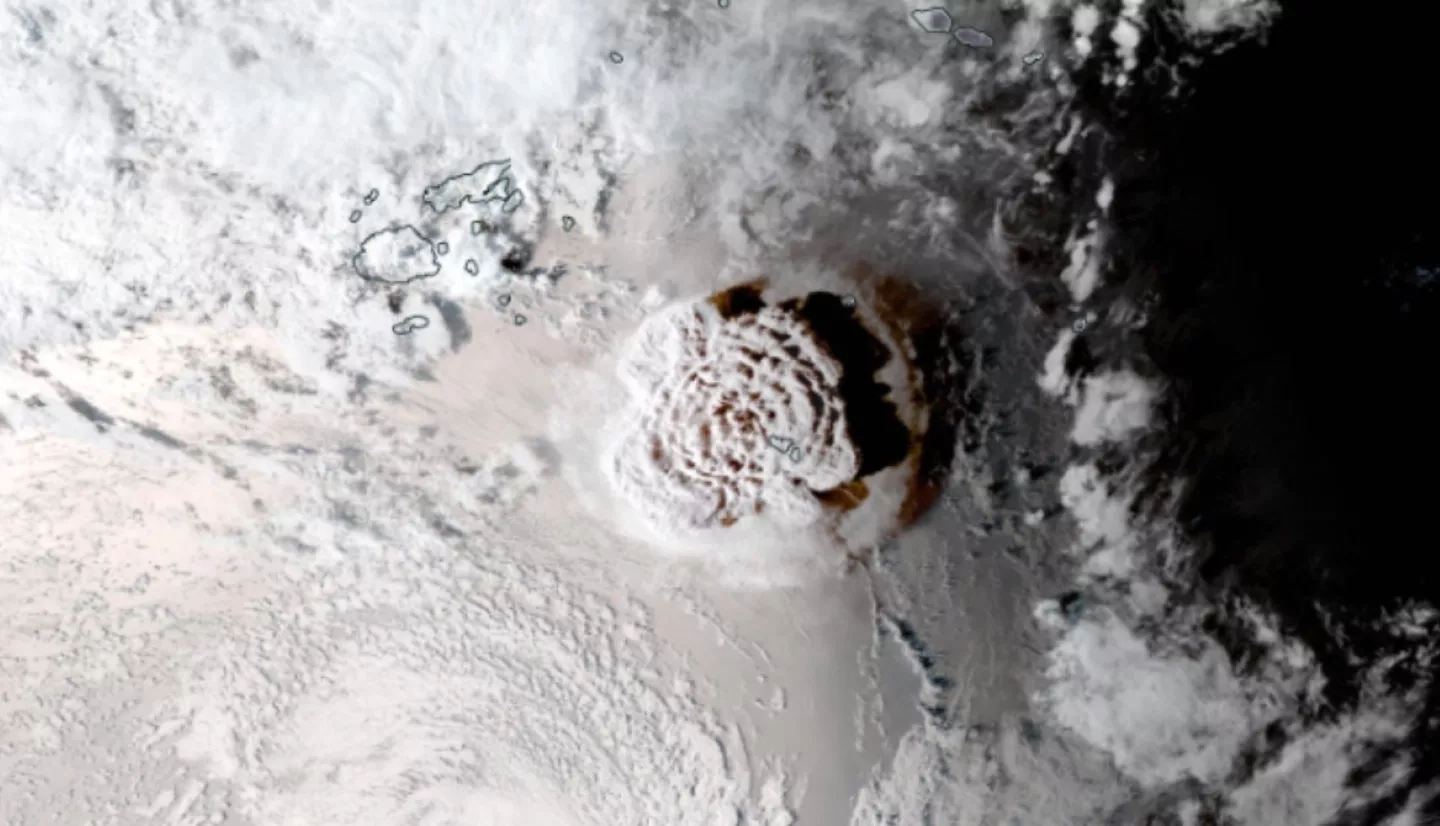
On Jan. 15, 2022, a powerful explosive eruption from the underwater volcano Hunga Tonga Hunga Ha-apai lofted volcanic ash and gas high into the stratosphere and sent atmospheric shockwaves and tsunami waves around the world. The eruption brought powerful tsunami waves and heavy ashfall to islands in the nation of Tonga, severely damaging coastal communities. The explosion or related effects have also severed undersea communications cables, and Tonga airports were shut down for several days due to ashfall, making the ongoing damage assessment and relief efforts difficult. UNITAR activated the International Disasters Charter was activated on behalf of the United Nations Office for the Coordination of Humanitarian Affairs (OCHA) Regional Office for Asia and the Pacific.
In addition to damaging communities in Tonga, the tsunami waves traveled across the Pacific Ocean, causing surges in Hawaii, Japan, and the western coasts of North and South America. Although the tsunami waves were only several feet high, they carry significant force and powerful currents that are much more damaging than typical ocean waves.
Multiple Earth-observing satellites from NASA and other space agencies observed the eruption, providing valuable data on the strength of the eruption, the ash and gas released into the atmosphere, and the impacts from the tsunami waves. Astronauts aboard the International Space Station were also able to observe and photograph the enormous ash cloud from the eruption. With an umbrella cloud about 500 kilometers (300 miles) in diameter at its maximum extent, this is one of the largest volcanic eruptions of the satellite era, comparable to 1991’s powerful Mt. Pinatubo eruption.
Ash from Saturday’s underwater volcanic eruption in the remote Pacific nation of Tonga made its way thousands of feet into the atmosphere & was visible from @Space_Station. During a pass over New Zealand on Sunday, Kayla Barron opened the window & saw the effects of the eruption. pic.twitter.com/6DWgSKVGr6
— NASA Astronauts (@NASA_Astronauts) January 19, 2022
NASA’s Earth Applied Sciences Disasters program area has activated to support risk reduction and recovery efforts for the eruption with Earth-observing data and analysis. The program is supporting stakeholders from NOAA and the World Central Kitchen, providing data and analysis to assist damage mapping for the communities in Tonga. NASA researchers are also gathering satellite data to analyze impacts from the oil spill in Peru caused by the tsunami. The Disasters team is making data available to stakeholders on the NASA Disasters Mapping Portal, including high-resolution optical imagery from Planet Labs’ satellites and sulfur dioxide (SO2) emissions data from the Ozone Mapping and Profiler Suite (OMPS) instrument.
The Earth Observatory of Singapore, supported by NASA’s Advanced Rapid Imaging and Analysis (ARIA) program, NASA’s Jet Propulsion Laboratory (JPL), and the NASA ROSES A.37 research project “Global Rapid Damage Mapping System with Spaceborne SAR Data,” generated Damage Proxy Maps (DPM’s) of the region to aid in identifying the damage to buildings, infrastructure and vegetation.
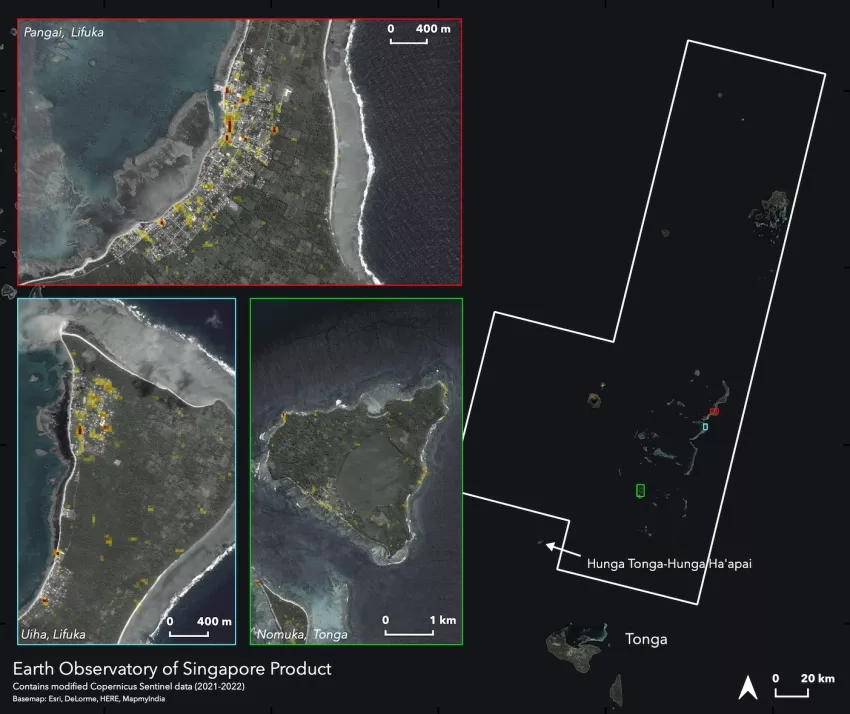
The above DPM was derived from synthetic aperture radar (SAR) images acquired by European Space Agency (ESA) Copernicus Sentinel-1 satellites on Sept. 17, 2021, and Jan. 15, 2022. The large white polygon indicates the coverage area. Each pixel of damage detection measures about 30 meters across. More significant surface change is depicted as the color varies from yellow to red. Preliminary validation was done by high-resolution optical imagery comparison. This damage proxy map can be used as guidance to identify damaged areas but may be less reliable over vegetated or flooded areas. A lack of colored pixels over vegetated areas does not necessarily indicate a lack of damage.
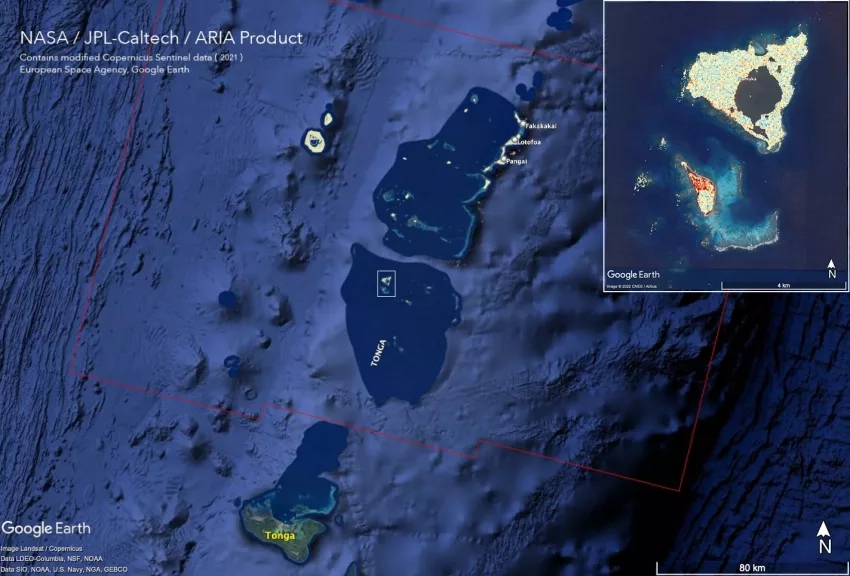
The above DPMa was derived from synthetic aperture radar (SAR) images acquired by European Space Agency (ESA) Copernicus Sentinel-1 satellites on Dec. 10, 2021, Dec. 22, 2021, Jan. 3, 2022, and Jan. 15, 2022, and uses radar amplitude instead of the interferometric coherence that was used to generate the previous DPM. This technique is sensitive to vegetation damage as well as damage to buildings and infrastructure. The image covers an area of approximately 95 by 80 miles (150 by 130 kilometers) for the central part of Tonga. More significant surface change is depicted as the color varies from pale yellow to red. Preliminary validation was done by comparing the map with the media reports and other images. This DPM from radar amplitudes should be used as guidance to identify damaged or flooded areas and large-scale changes in shorelines and is most reliable over vegetated areas where trees or buildings were replaced by water or smooth sand. Areas of low radar reflection were masked out, so this version of the radar change map does not provide information on the Hunga Tonga-Hunga Ha'apai islands.
Related Impact