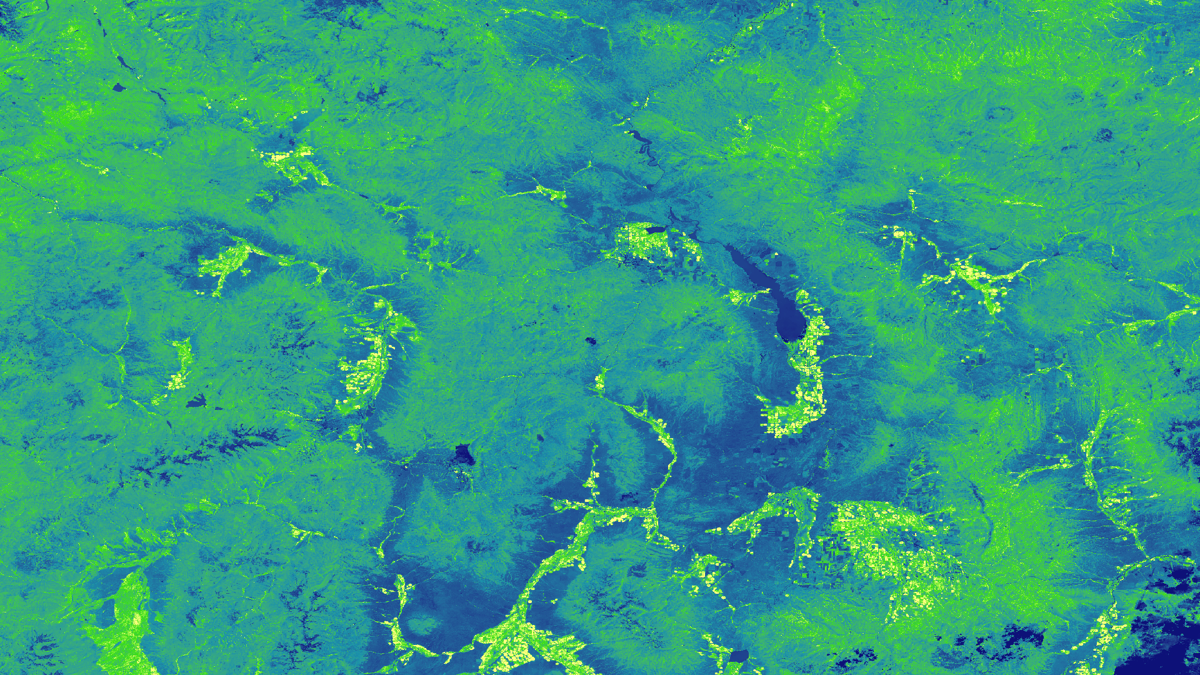
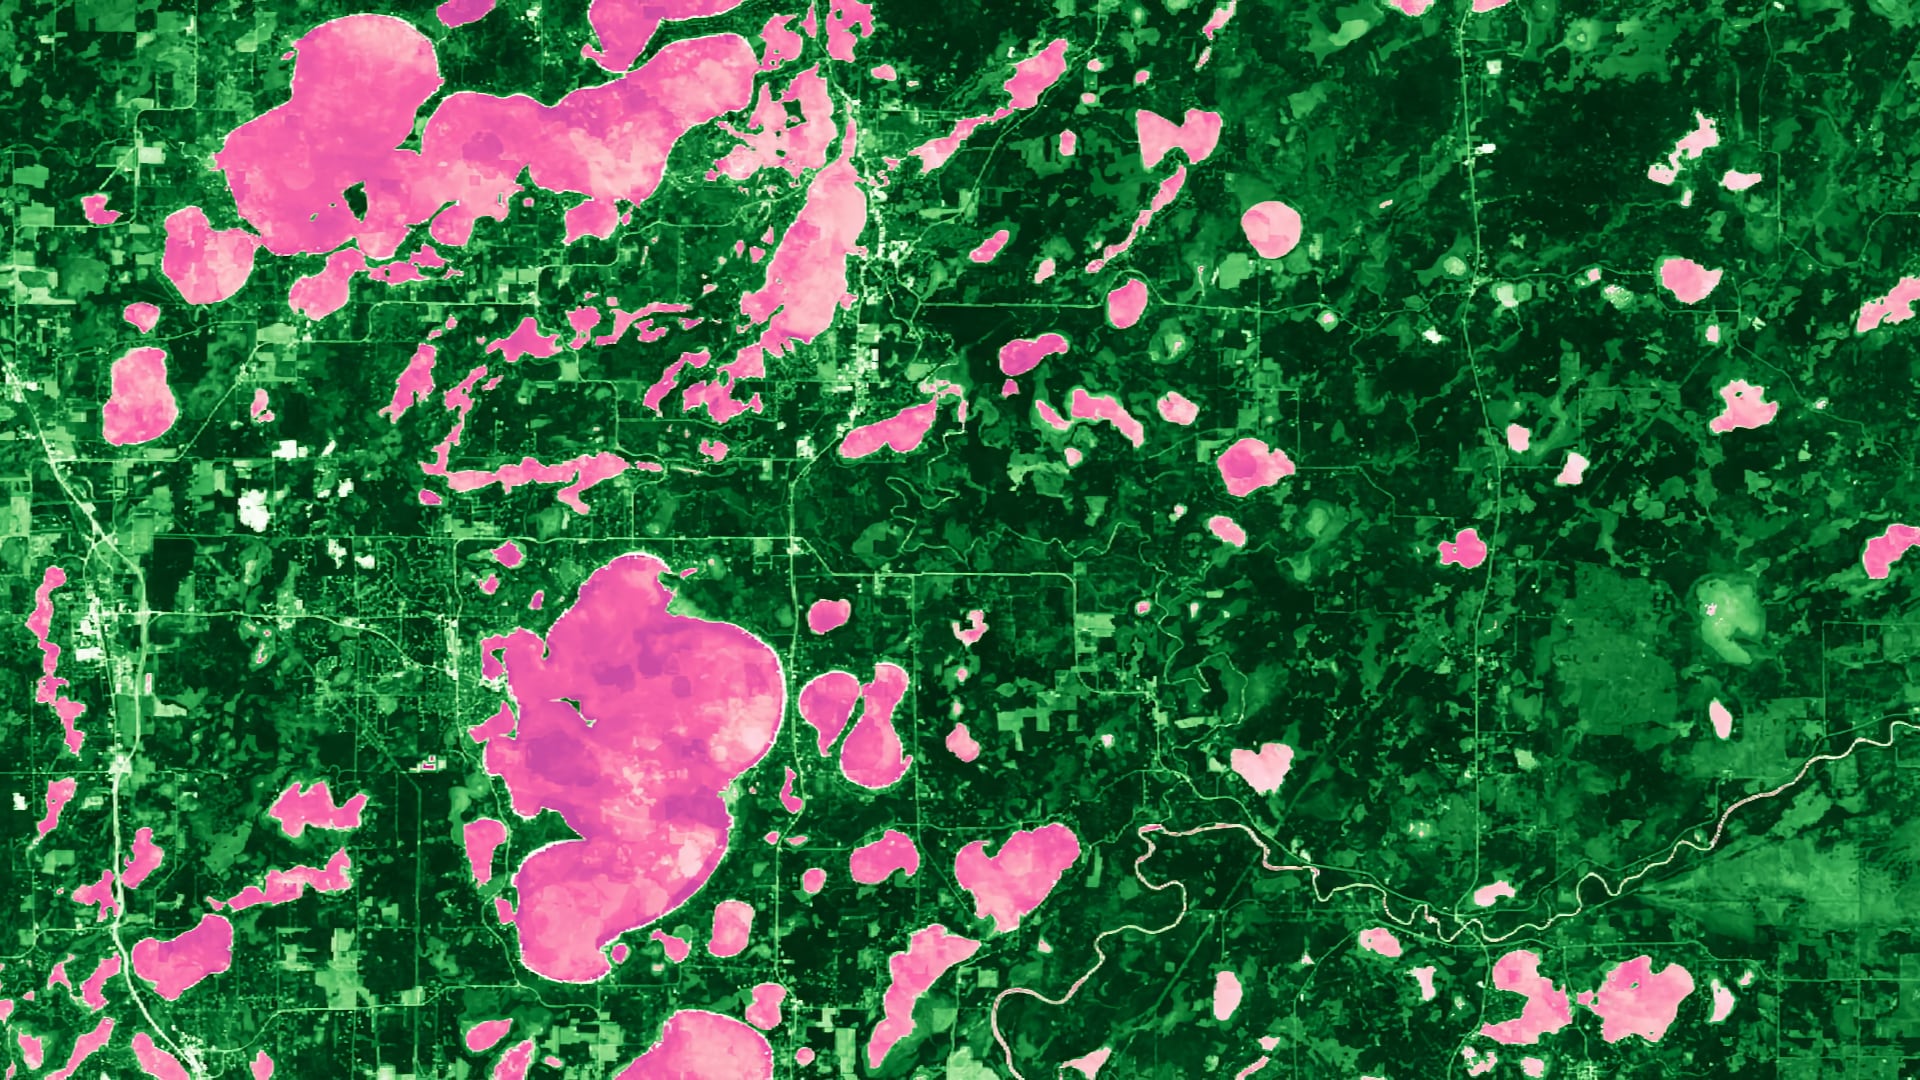
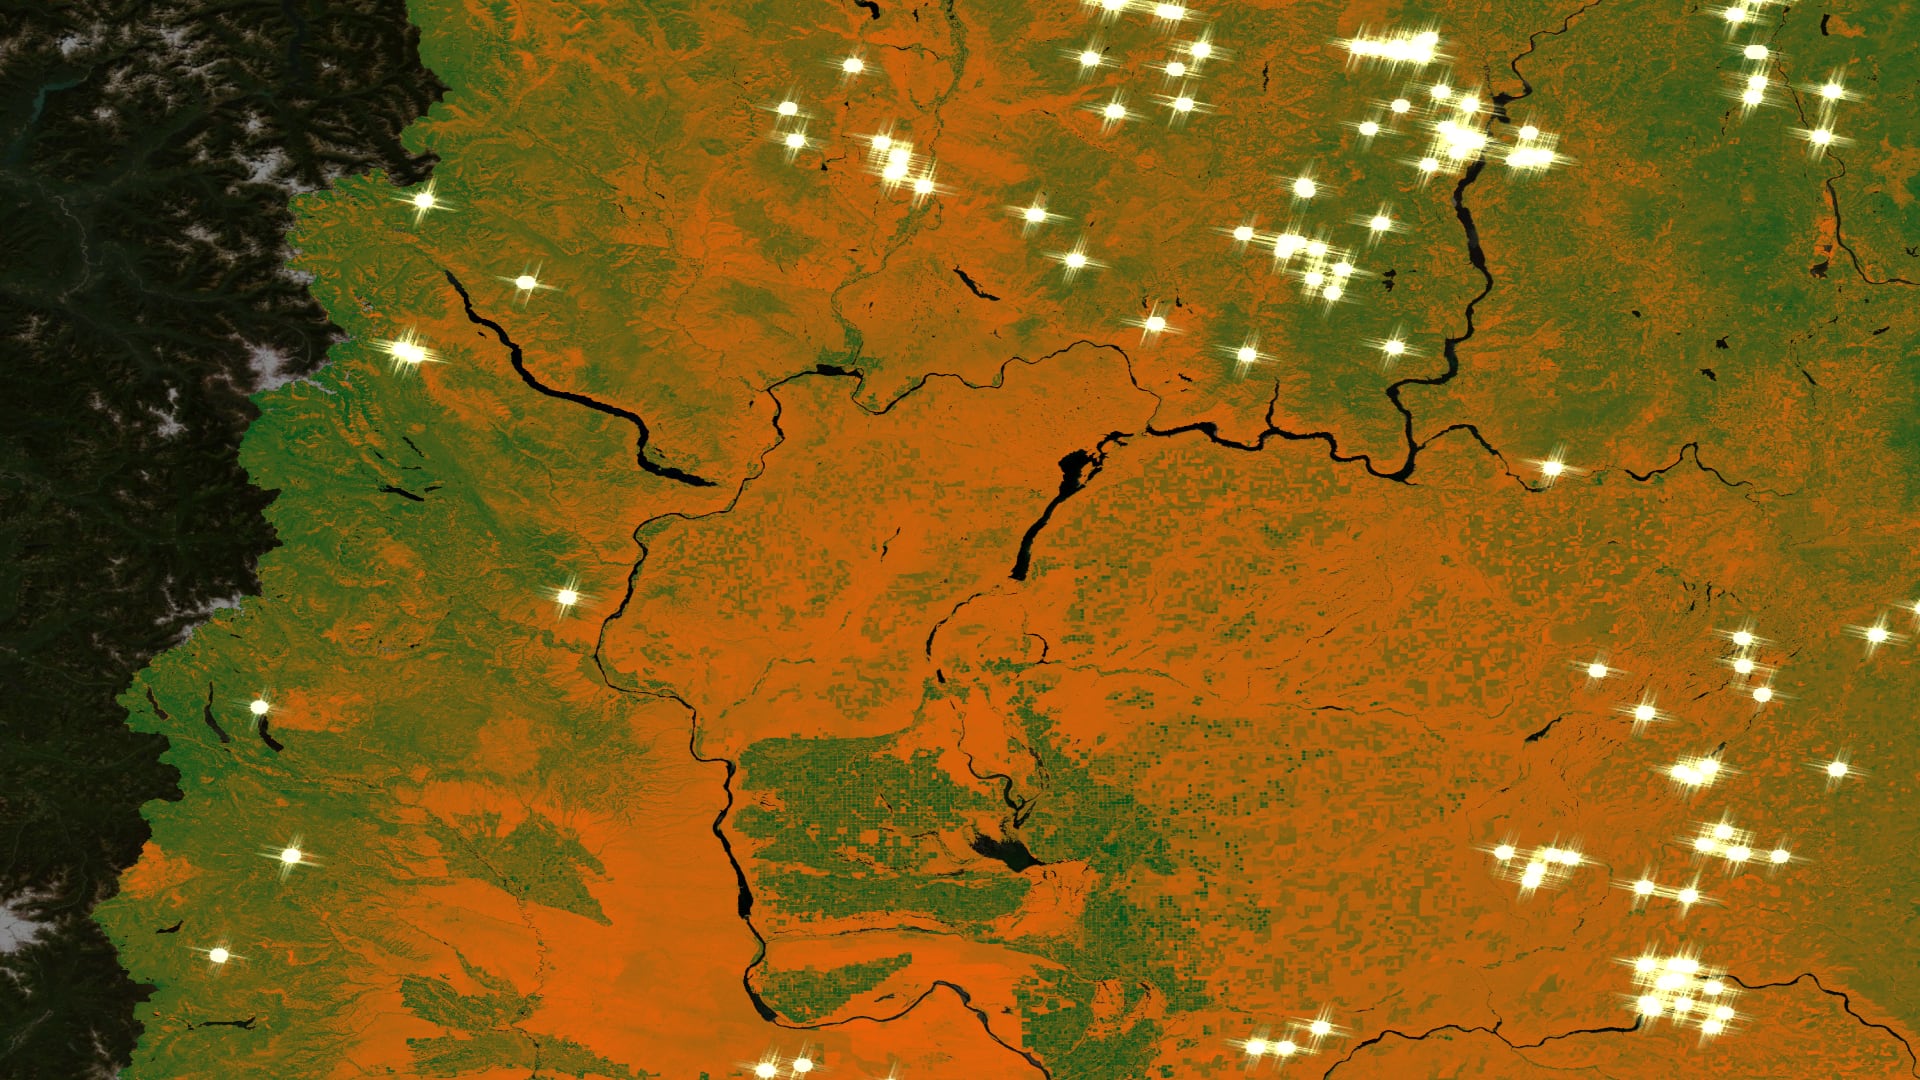
Principal Investigator

Kimberly Johnson

Imagen
Improving Detection of Land Use Change in Habitat Conservation Plan Areas Using NASA Earth Observations and a Landscape Anomaly Detection Tool

The US Fish and Wildlife Service (USFWS) monitors and approves the creation of Habitat Conservation Plan (HCP) areas under the Endangered Species Act (ESA). Habitat Conservation Plans allow economic development in areas that have threatened and endangered species with the agreement that the developer provides...

Principal Investigator

Brian Lee

Imagen
Improving Flood Extent Mapping Using the Coastal Storm Modeling System (CoSMoS) Tool with NASA Earth Observations and UAVSAR within Southern California

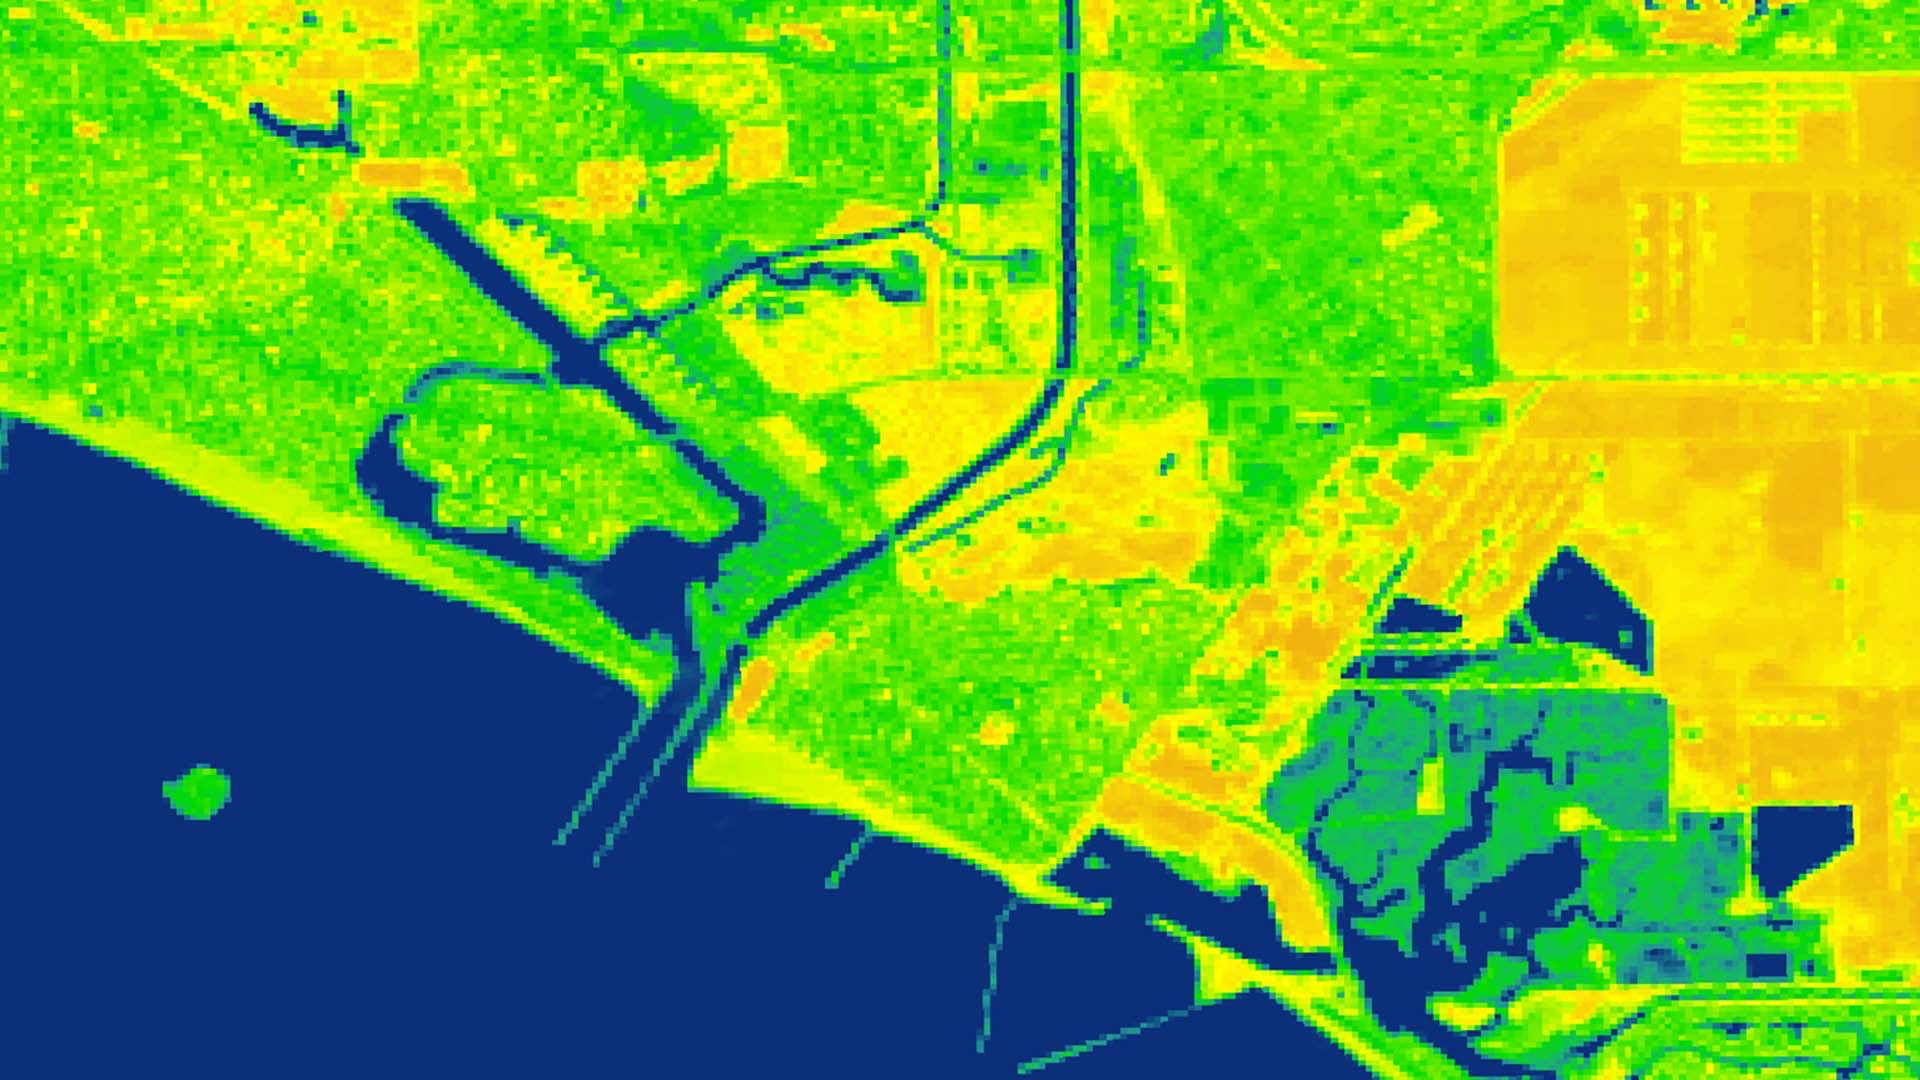
The Southern California coast, from Point Conception to the Tijuana River wetland, has become more sensitive to flooding as king tides have increased in magnitude. These king tides are thought to be intensifying due to numerous environmental factors such as storm surges, strong winds, and...

Principal Investigator

Alex Matacchieri

Imagen
Improving Water Quality Monitoring and Management in the San Francisco Bay-Delta Utilizing NASA Earth Observations in Association with the Delta Smelt

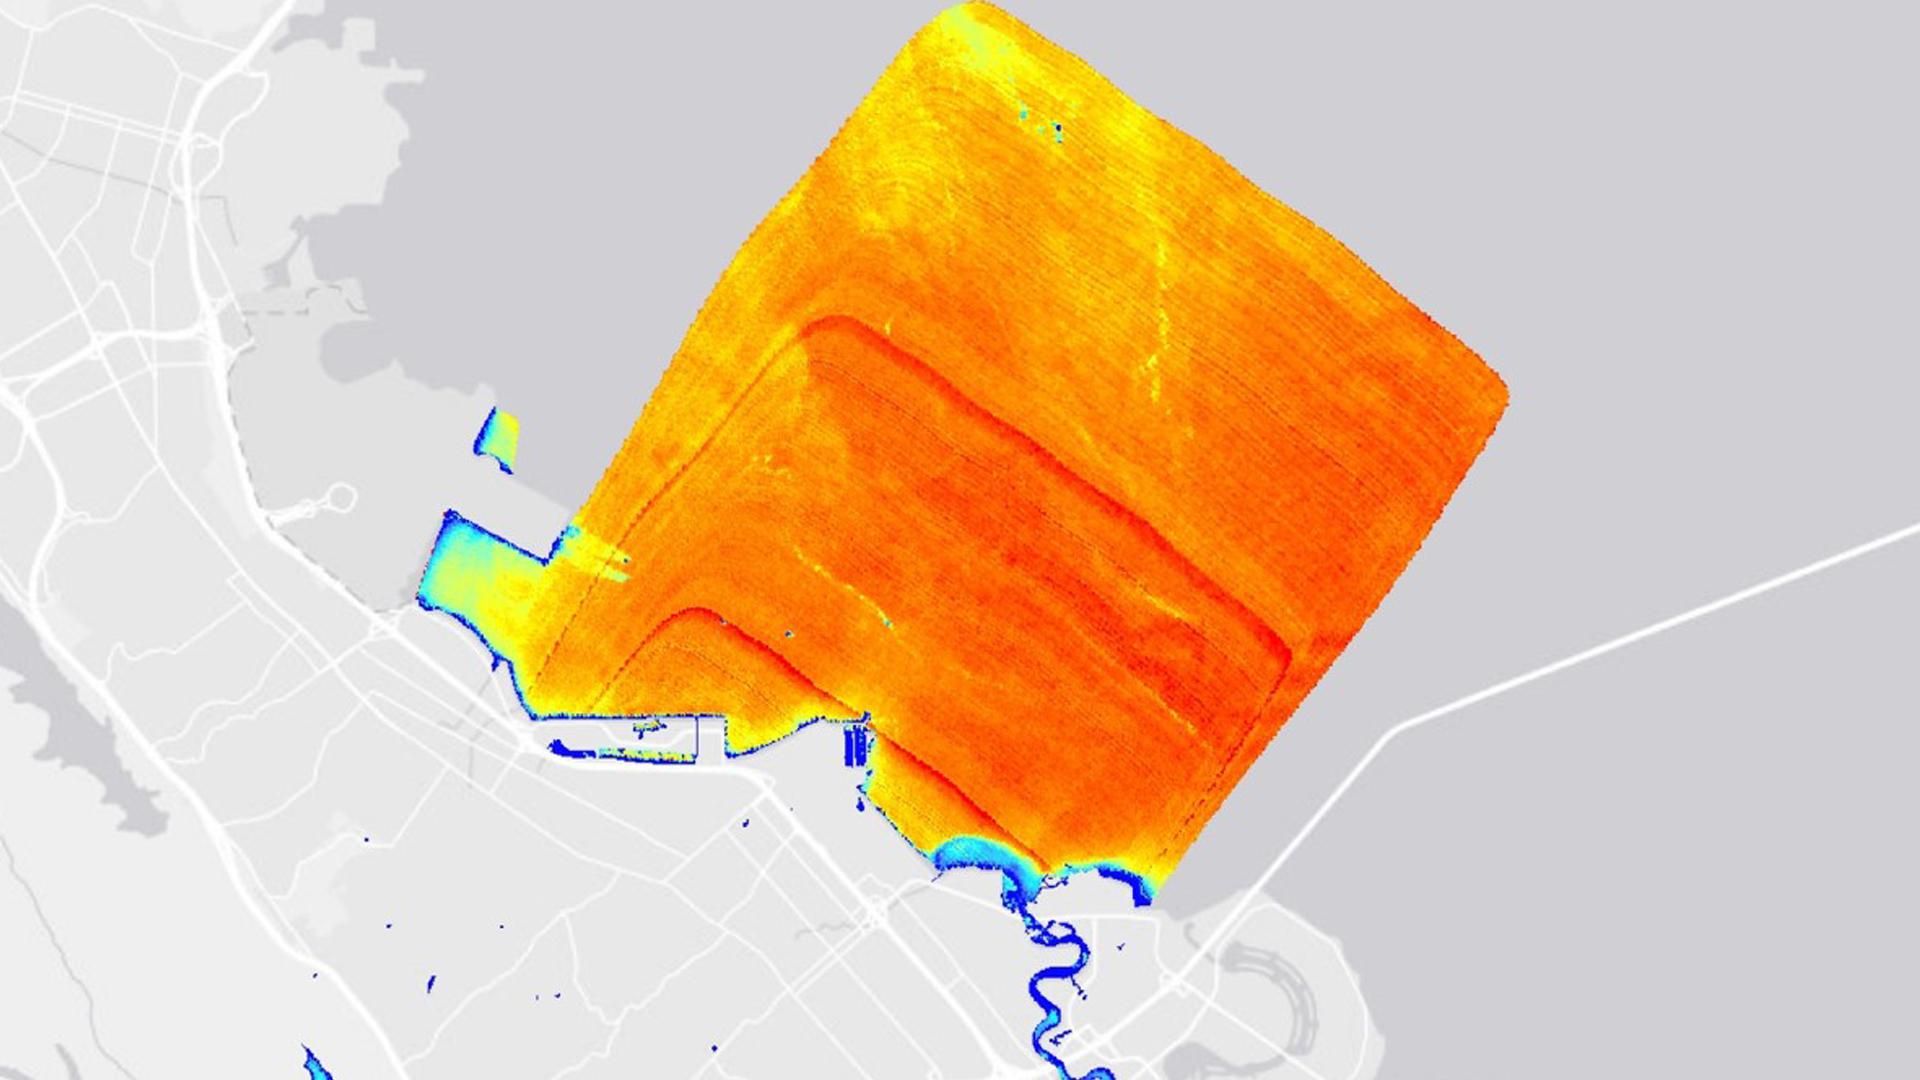
Water quality plays a critical role in California's freshwater supply and environmental health in the San Francisco Bay-Delta. While there are measures in place to protect human and environmental health from poor water quality conditions, implementation of these measures is frequently reliant on physical water...

Principal Investigator

Erica O’Connor

Imagen
This is a 2018 Landsat 8 OLI image of Minnesota processed to show Modified Normalized Difference Water Index (MNDWI) and Normalized Difference Vegetation Index (NDVI) values displayed with pink and green color ramps, respectively. Dark pink shades indicate areas very inundated with water; lighter pink shades are less inundated. Dark green shades are healthy vegetation and lighter shades are less healthy. Focusing on areas that contain wetlands is important for stakeholders to maintain inventory accuracy.

Wetlands are a critical feature of our landscape for the ecological services they provide, including protecting water quality, providing habitat to rare species, mitigating erosion, and providing opportunities for recreation. Despite this, wetlands are facing increasing threats from a variety...

Principal Investigator

Jeremy Rapp

Imagen
Incorporating NASA Earth Observations into an Assessment Tool to Identify Correlations Between Factors Associated with Bee Health

Honey bees (Apis mellifera) are a vital component to global agriculture, however, over recent decades their populations have been declining. Honey bees provide pollination services to more than 90% of the leading 107 global crop types, and without them it is estimated that...

Principal Investigator

Lauren Lad

Imagen
NDVI-processed imagery using data from Suomi-NPP VIIRS on May 1st, 2019 with an overtop of hillshade with vertical exaggeration of 10x. The Uinta National Forest and part of the Manti-La Sal National Forest, located south of the Great Salt Lake, are displayed. Lighter shades of green and blue indicate poor health of vegetation or no vegetation. Shades of brown indicate mildly health vegetation. Shades of dark blue and dark green indicate good to strong health of vegetation. Focusing on areas with bright hues of green as well as terrain, emergency response teams will be aware of potential future fire ignition sites in this area and predict resource allocation.  Keywords: NDVI, eastern Great Basin, VIIRS

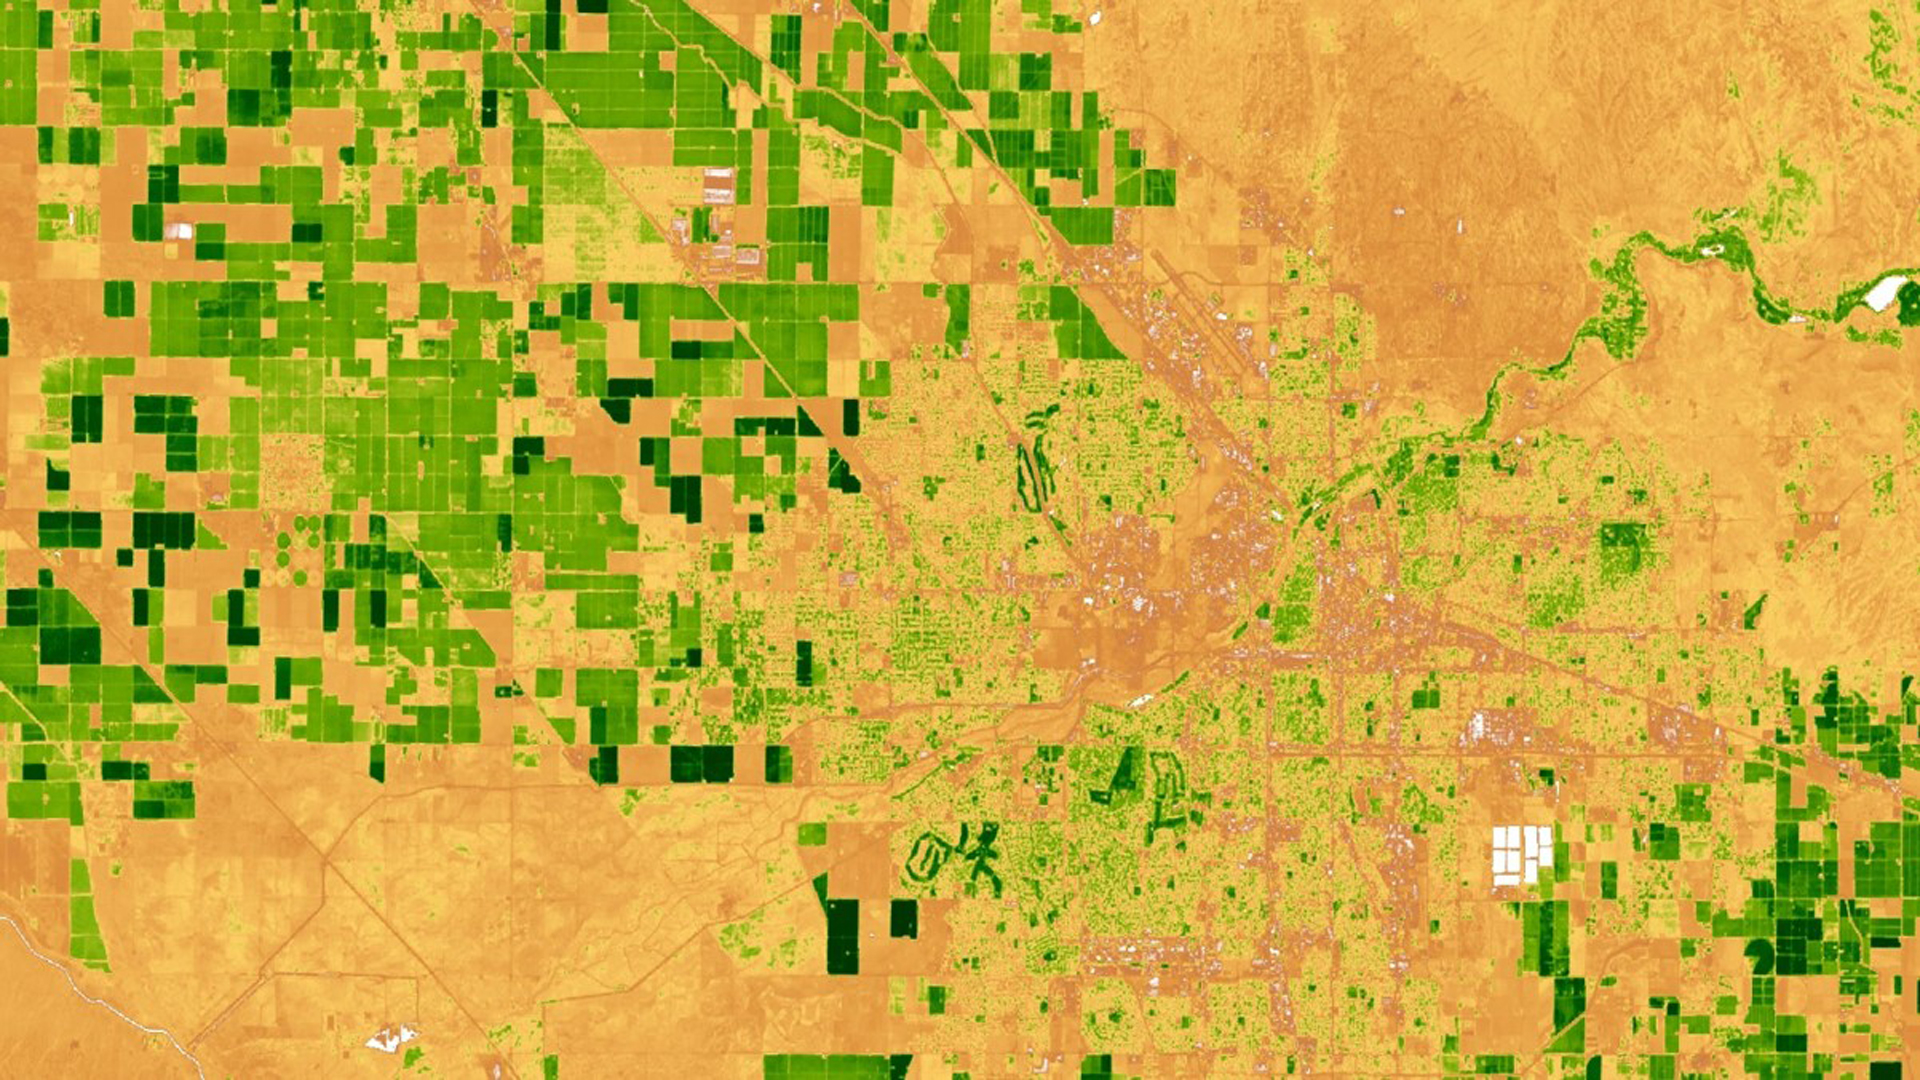
The eastern Great Basin (EGB) covers approximately 411,000 km2 within the states of Arizona, Colorado, Idaho, Utah, and Wyoming. Since the 1950s, wildfires have increased in both frequency and size within the EGB and neighboring states. Partners at the Bureau...

Principal Investigator

Garrett McGurk

 
Imagen
Integrating NASA Earth Observations into the Google Earth Engine Platform to Enhance Drought Monitoring in Chile

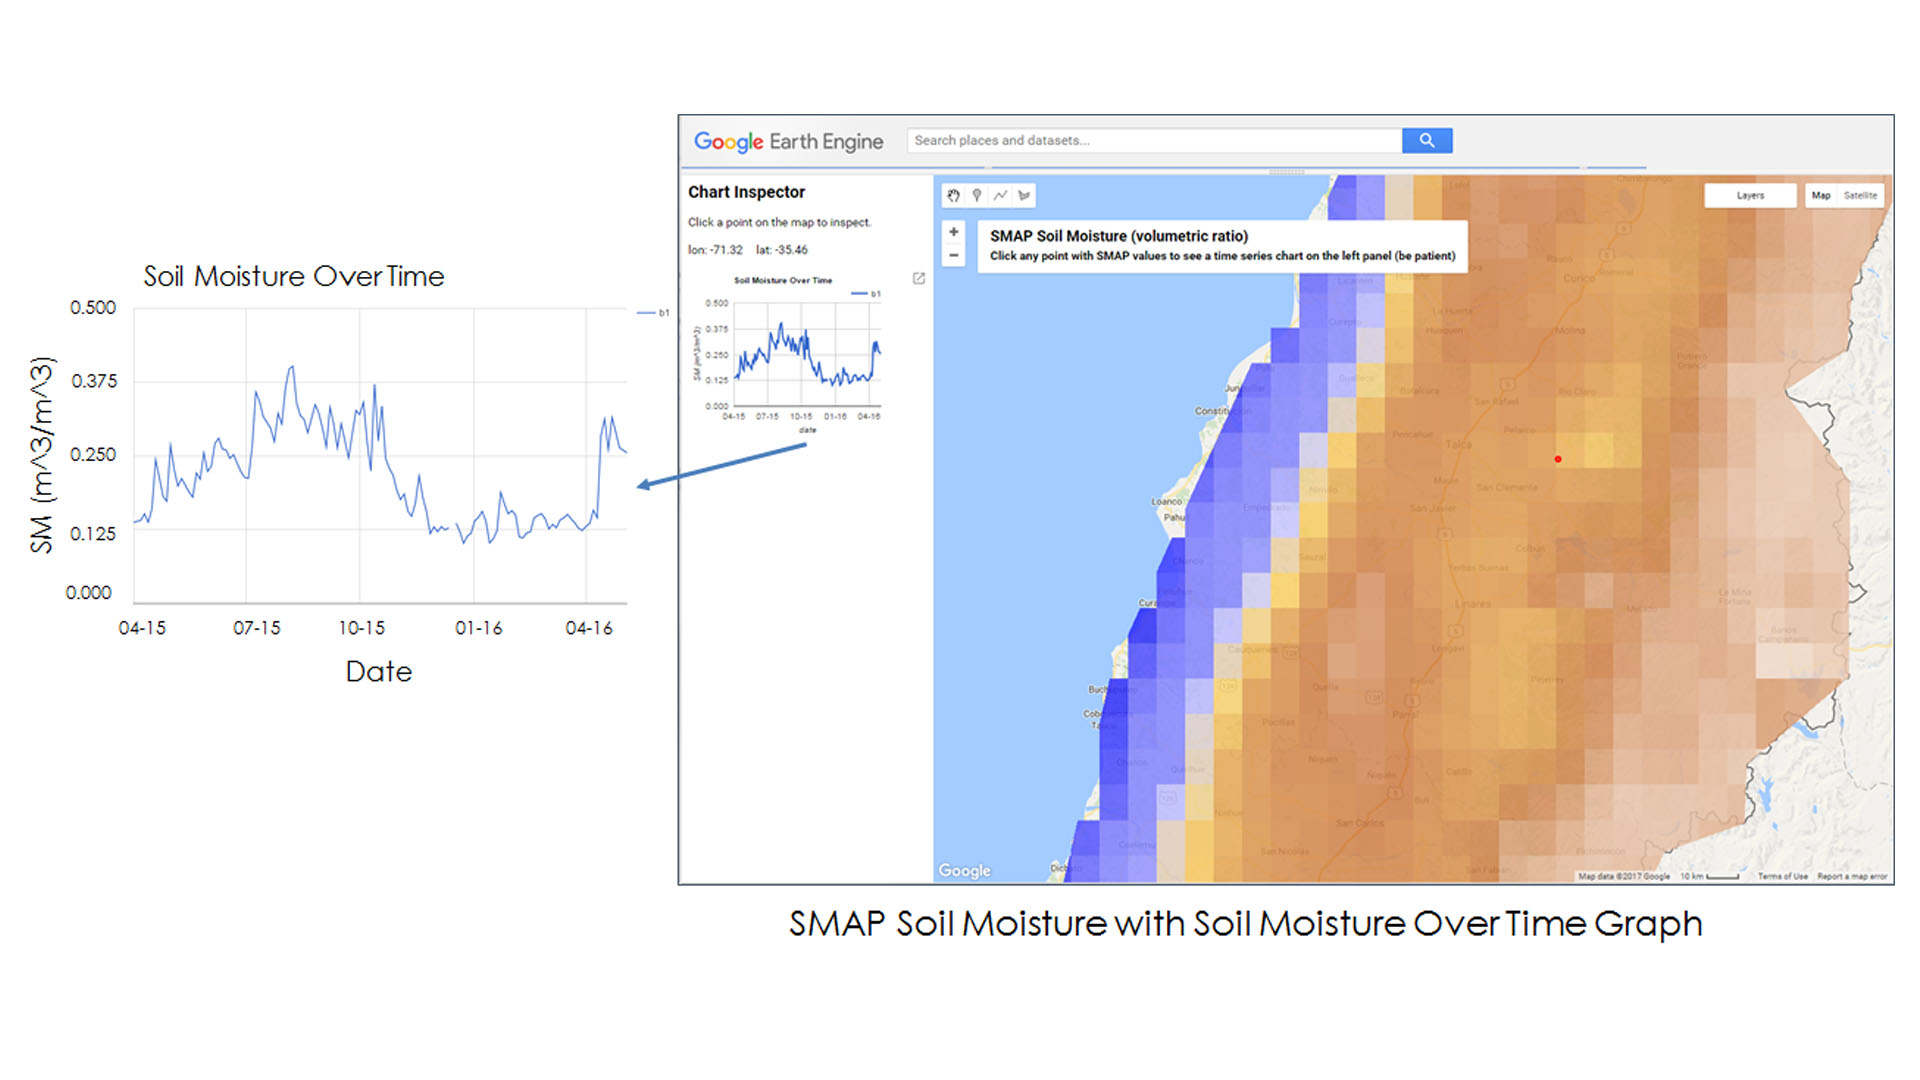
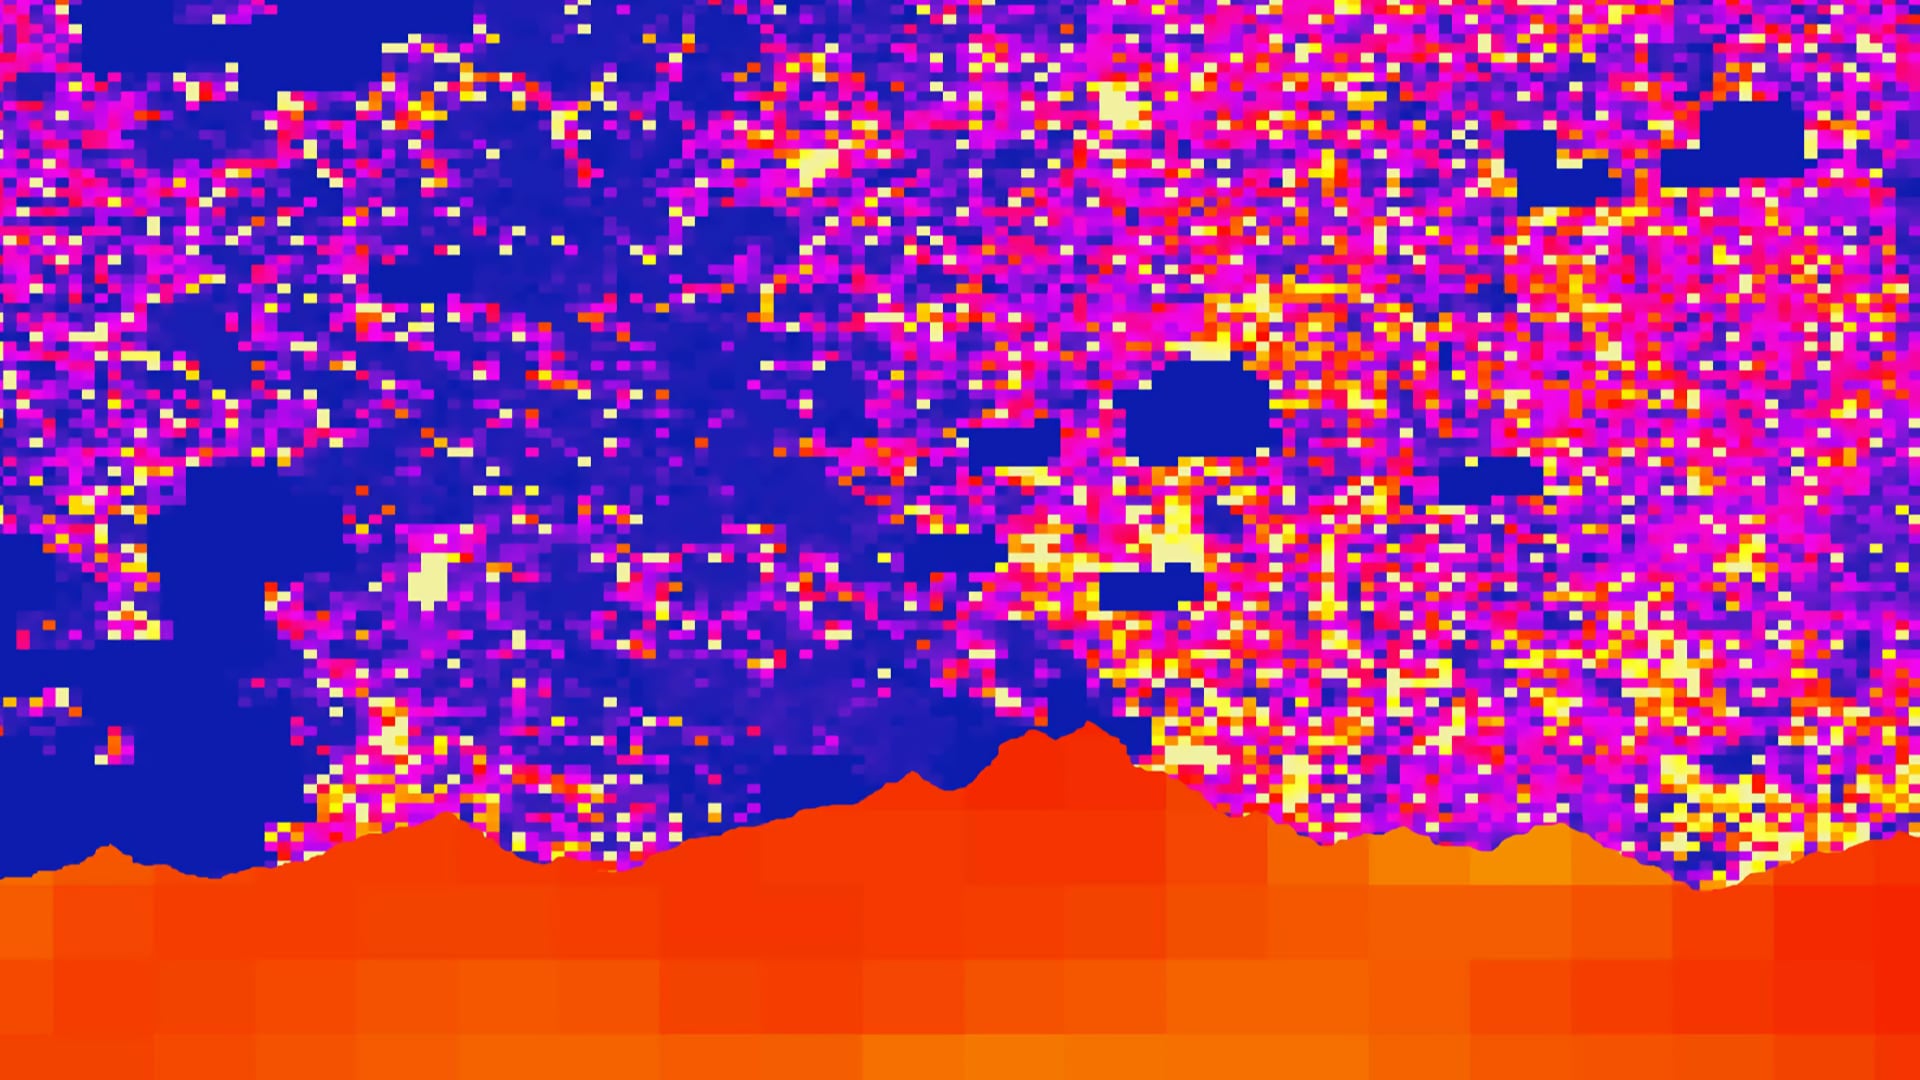
Chile is characterized by extreme climate variability ranging from the arid Atacama Desert, one of the driest places on earth, to the extremely wet Lake District that averages 2,535 mm of annual rainfall. In recent years, Chile has experienced abnormal climate conditions as record...

Principal Investigator

Ani Matevosian

Imagen
This image displays a portion of Eastern Washington State, on the leeward side of the Cascade Mountains. Lightning point data, derived from the ISS Lightning Image Sensor for the year 2018 is overlaid upon 2018 Landsat 8-OLI imagery processed for a Normalized Difference Moisture Index, for the May-October fire season. Sparks symbolize the point coordinates of lightning strikes. The red-orange color shows dry vegetation, while the forest green represents vegetation with a higher moisture content.  Keywords: Amelia Zaino, Ani Matevosian, Amy Kennedy, Evan Bradish, lightning, wildfires, Eastern Washington, vegetation moisture. Background map layer, credit: Esri, DigitalGlobe, GeoEye, Earthstar Geographics, CNES/Airbus DS, USDA, USGS, AeroGRID, IGN, and the GIS User Community

According to the Washington Department of Natural Resources, roughly 36% of large fires in the state since 2010 were caused by lightning. General trends also show a greater increase in the number of lightning-ignited fires over the last three decades...

Principal Investigator

Christine Evans

Imagen
Integrating NASA Earth Observations to Monitor Thunderstorms and Assess Lightning Exposure and Risk in the Hindu-Kush Himalayan Region

Intense thunderstorms throughout the Hindu-Kush Himalayan (HKH) region have resulted in an upsurge of lightning-related deaths due to an increase in population. Partnering with the NASA Global Hydrology Resource Center Distributed Active Archive Center, NASA SERVIR Science Coordination Office, Bangladesh Meteorological Department (BMD), Nepal Department...

Principal Investigator

Elizabeth Stapleton 

Imagen
Land use classification imagery using 2020 Landsat 8 OLI data, blended with a false color band combination (6,5,4), with the highway system overlayed in dark blue. Pictured is the Madre de Dios region of Peru, centered around the La Pampa illegal mining site. The light green indicates areas of gold mining, areas in pink represent wetlands, and areas in yellow represent forest cover. Tracking land use change allows agencies to understand where deforestation is occurring.  Keywords: Nelson Huffaker, Oliver Nguyen, Elizabeth Stapleton, Ariel Calle, Nataly Chacon

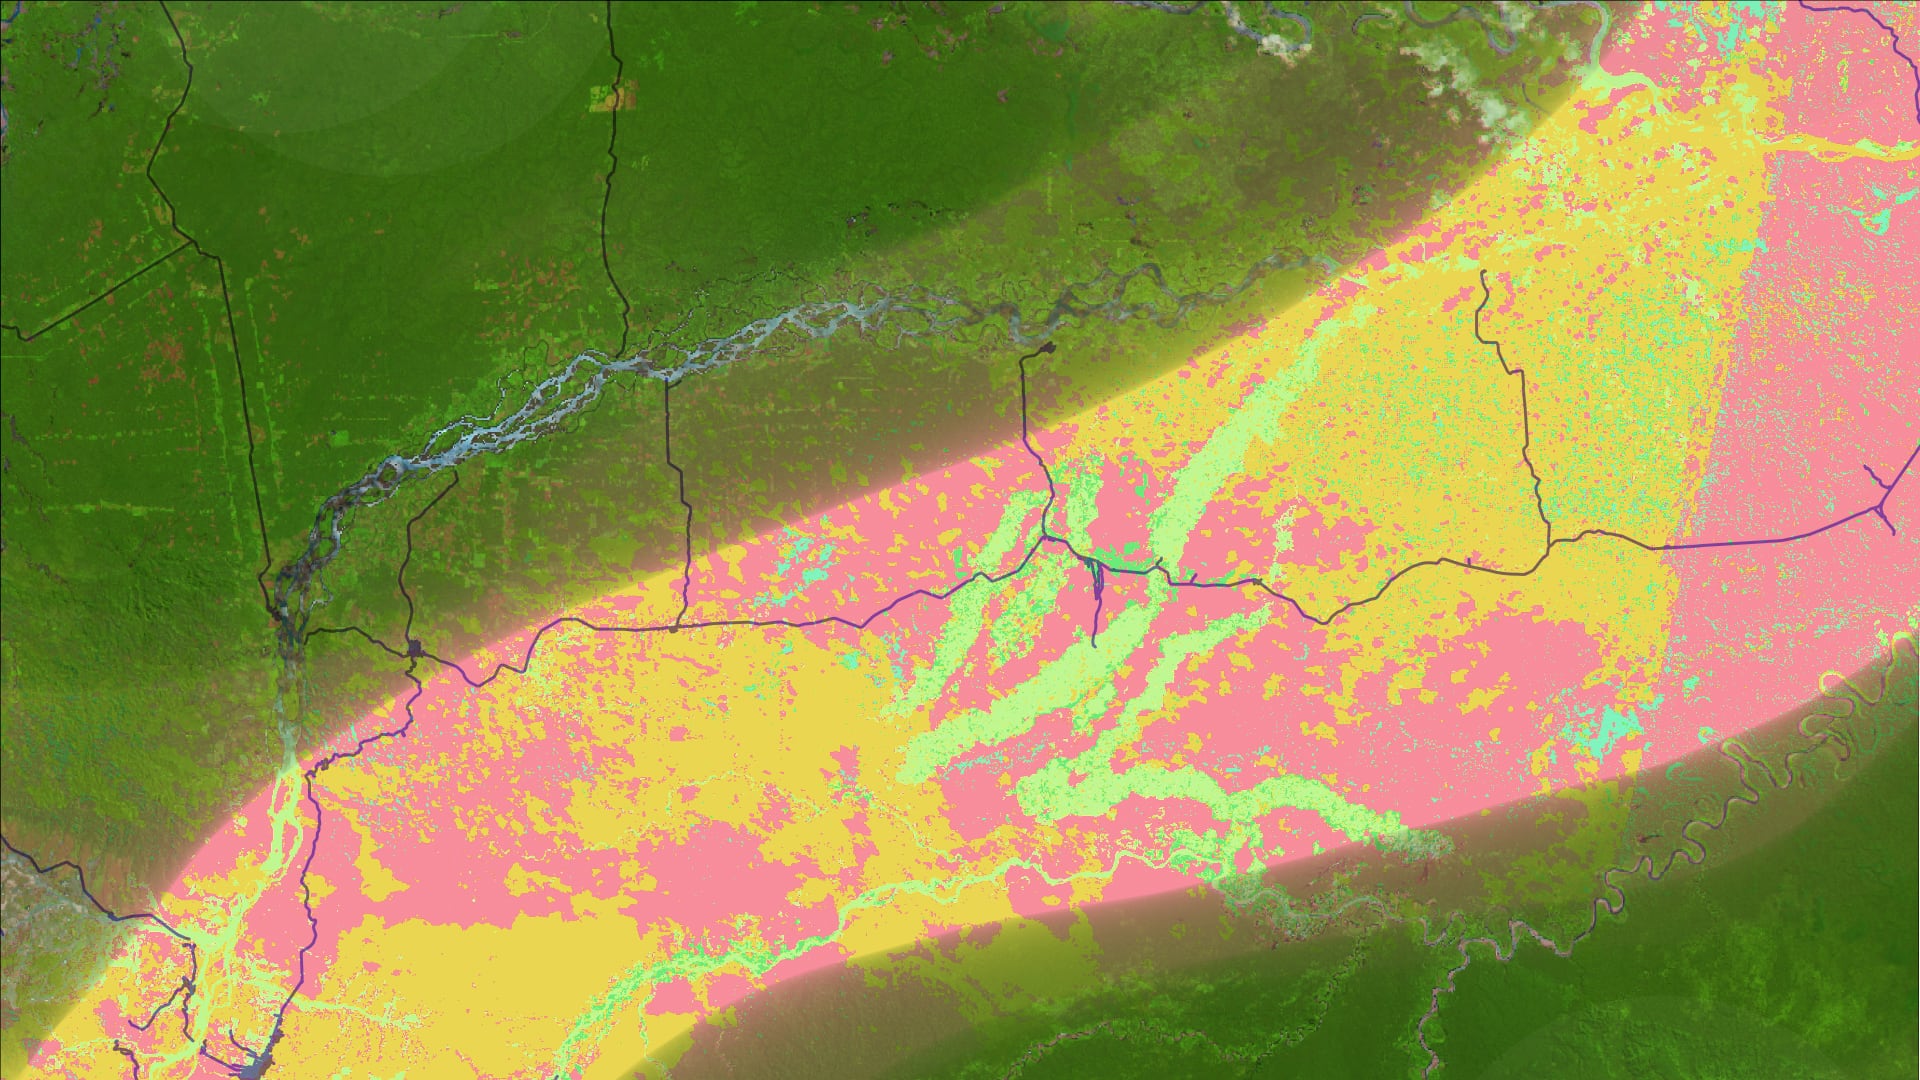
In the Madre de Dios region of the Peruvian Amazon, forests are being cleared for mining, timber harvesting, road construction, and hydroelectric dam development. These rapid land use changes are increasing human presence in previously sparsely-populated areas, disrupting ecosystems and increasing the...