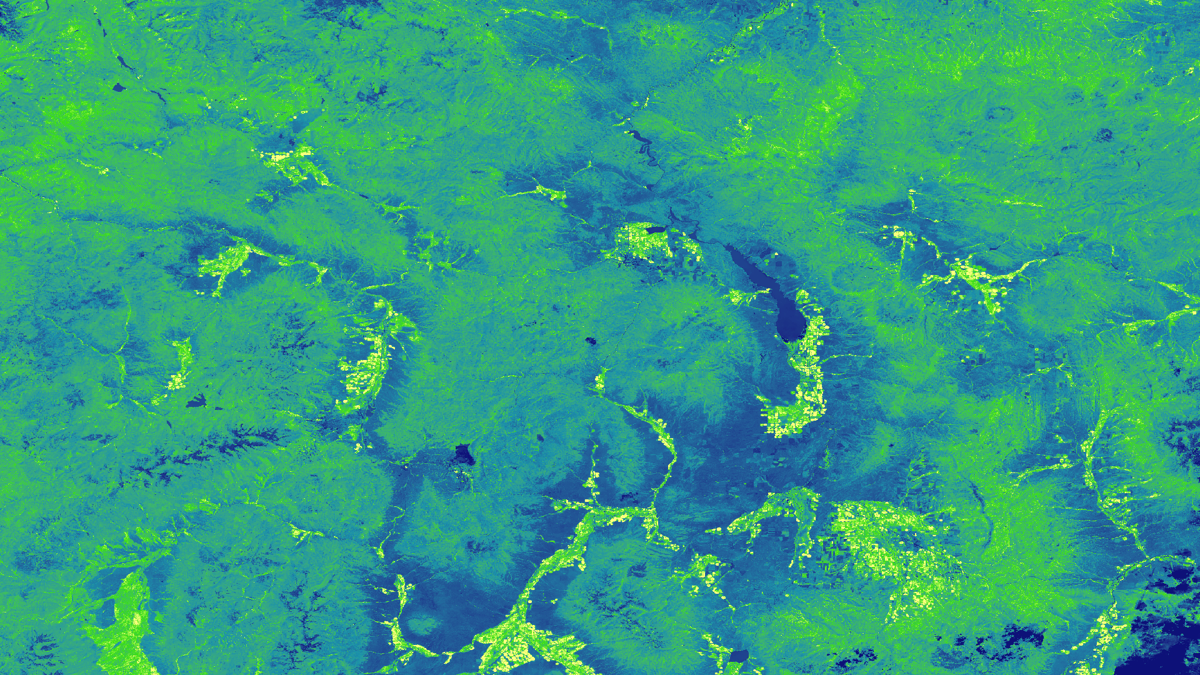
Principal Investigator

Genevieve Clow

Imagen
Normalized Difference Water Index (NDWI) derived from a Landsat 8 OLI composite image, using data from September to November 2018. Water is shown in blue, and the driest regions are in pink. This image displays the man-made mining pools in northern Chile’s Atacama Desert. Looking at how NDWI has changed over time will increase understanding of mining impacts and assist in water resource management.

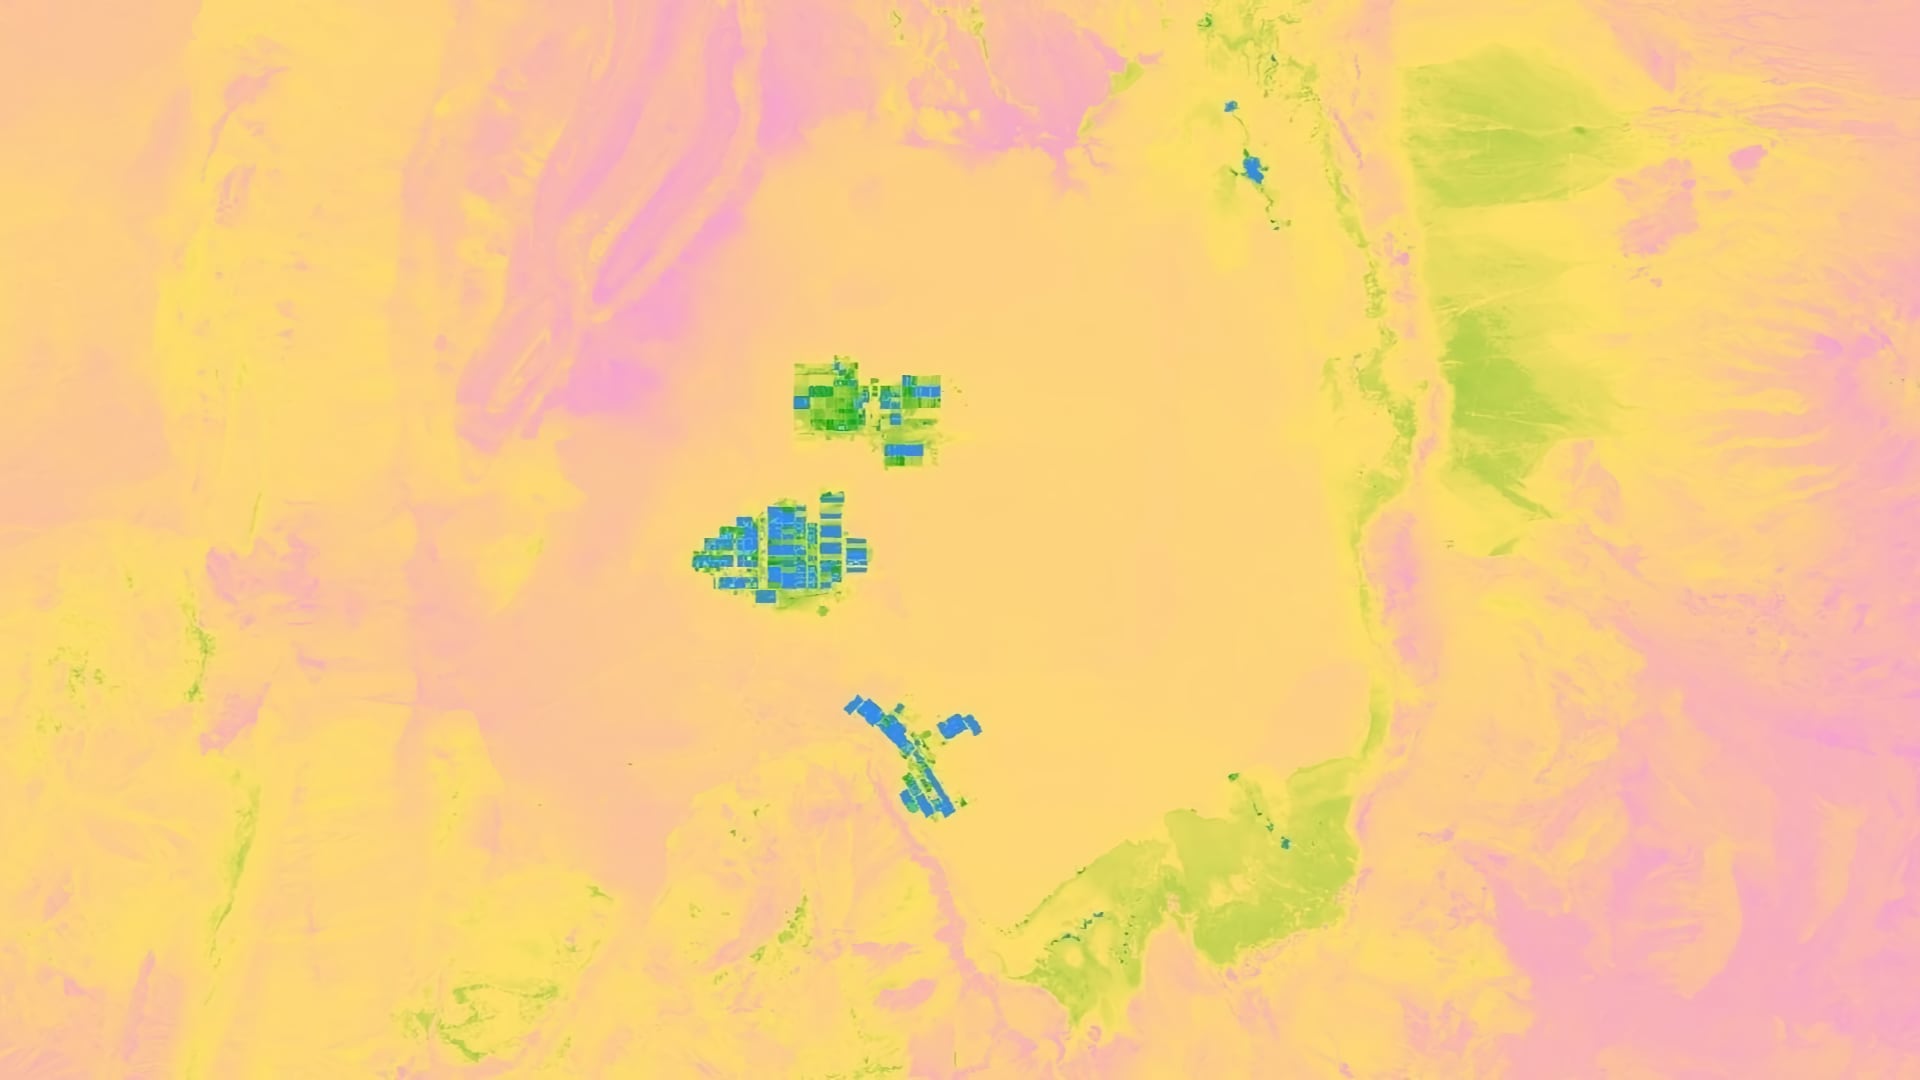
Saline systems, consisting of salt flats, ponds, and marshes, provide vital water resources to northern Chile’s Atacama Desert, one of the driest regions in the world. Mining is extensive in the Atacama, which contains 30% of the world’s lithium reserves and...

Principal Investigator

Arev Markarian

Imagen
Terrestrial NDVI change map of West Maui, Hawai’i, using a Landsat 4/5 TM composite (1989, 1990, 1991) and Landsat 8 OLI composite (2017, 2018), joined with a false-color marine turbidity image from February 10th, 2014, Landsat 8 OLI data.  On land, light shades indicate NDVI decreases while darker shades show NDVI increases. In the water, brown denotes high turbidity. Better understanding the trends in land use and water quality will help partners develop watershed management plans.  Keywords: Landsat 4 and 5 TM, Landsat 8 OLI, NDVI, Turbidity, LULCC, Watershed

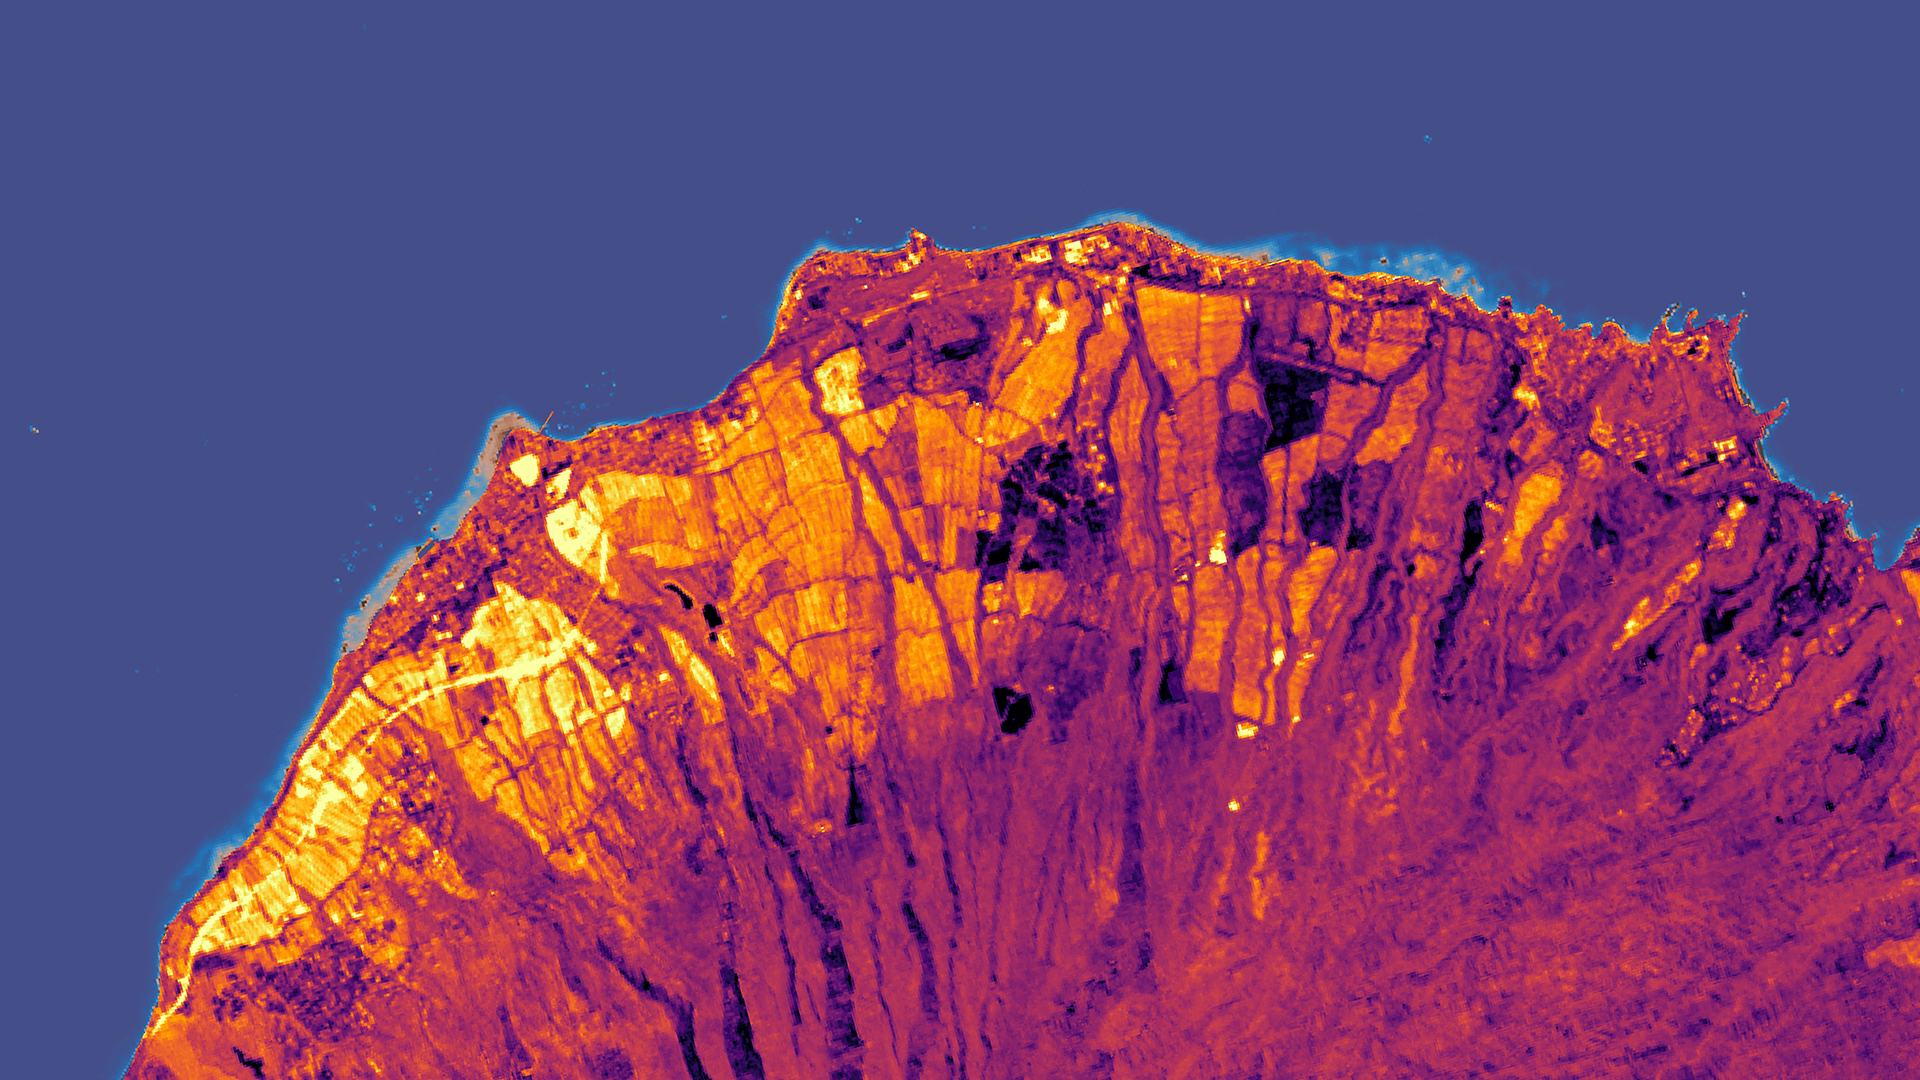
West Maui is at risk of losing ecosystem services provided by coral reefs due to land-based sources of pollution (LBSP). In 2011, The US Coral Reef Task Force (USCRTF) identified Wahikuli, Honokōwai, Kahana, Honokahua, and Honolua as priority watersheds in...

Principal Investigator

Brooke Adams

Imagen
Monitoring the Spread of Invasive Grasses and the Impacts on Grassland Management Practices in the Great Plains Using NASA Earth Observations and NOAA Climate Data Records

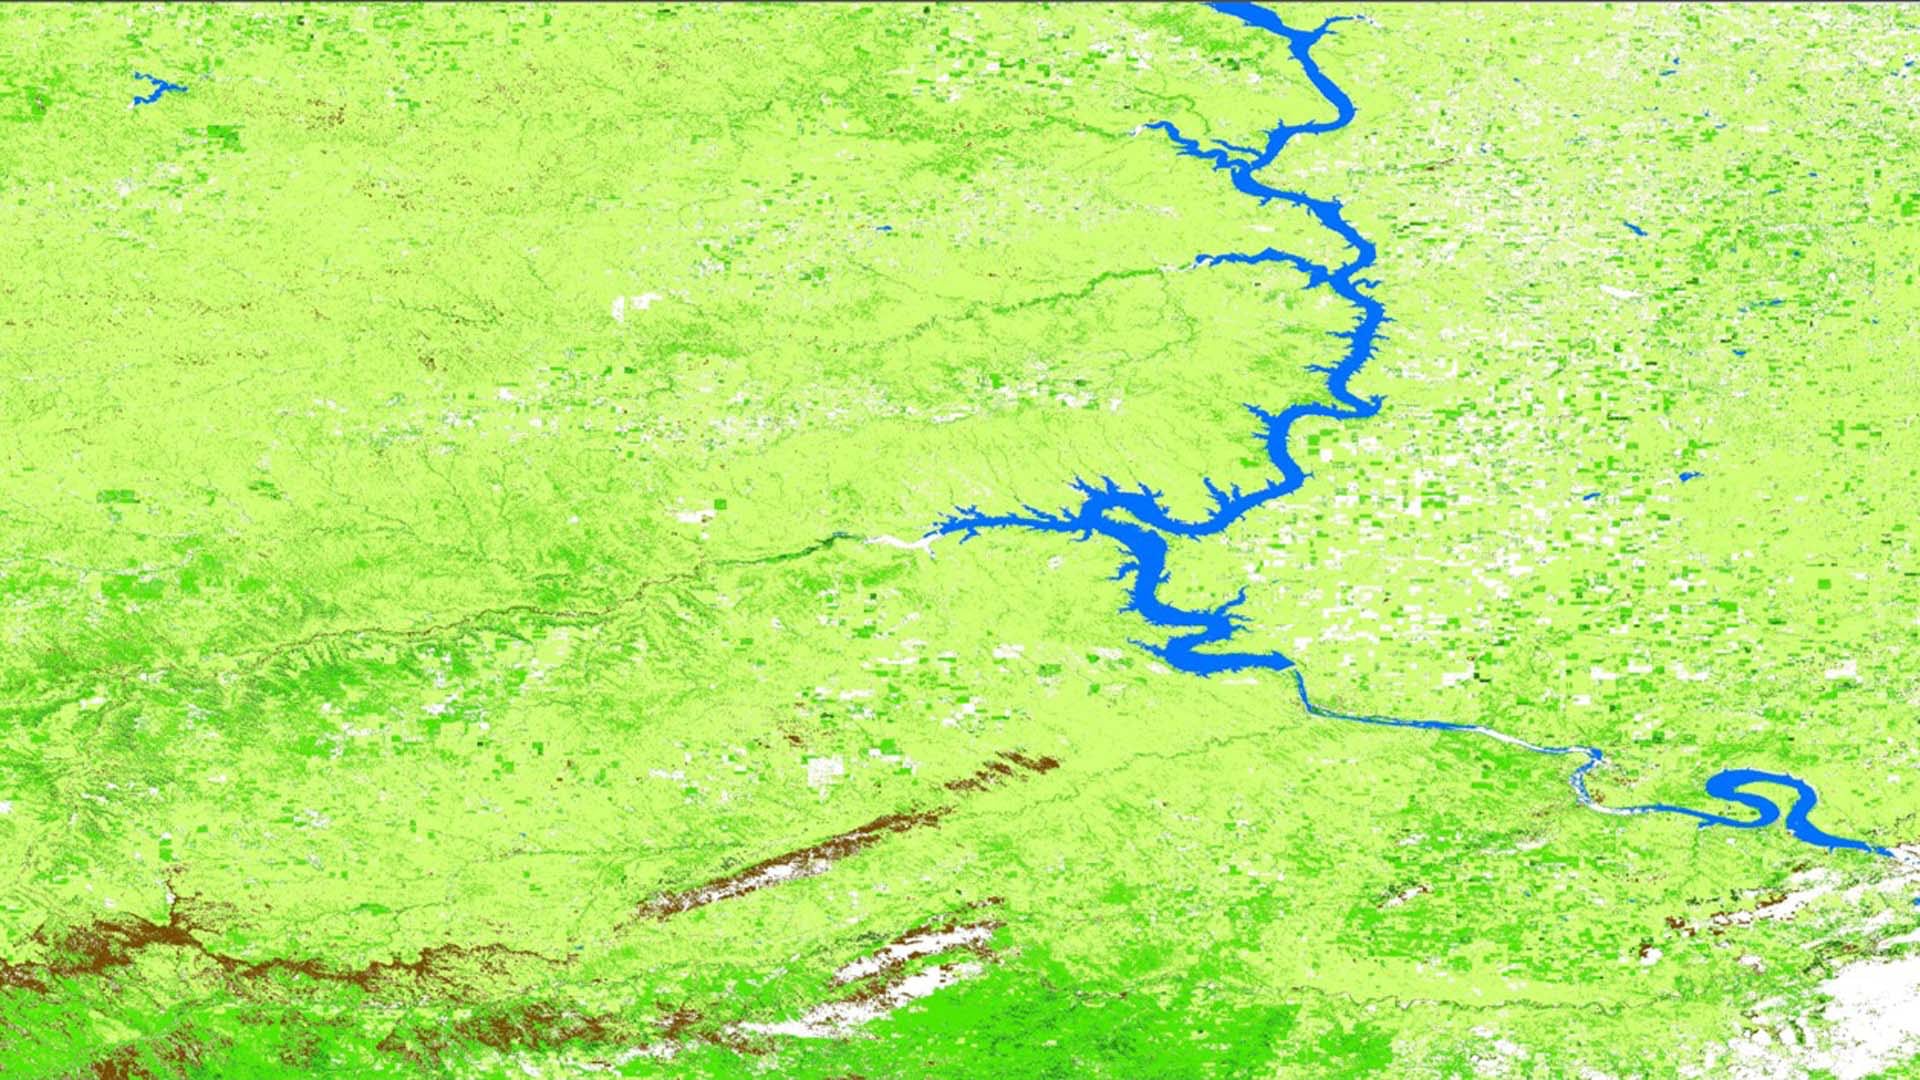
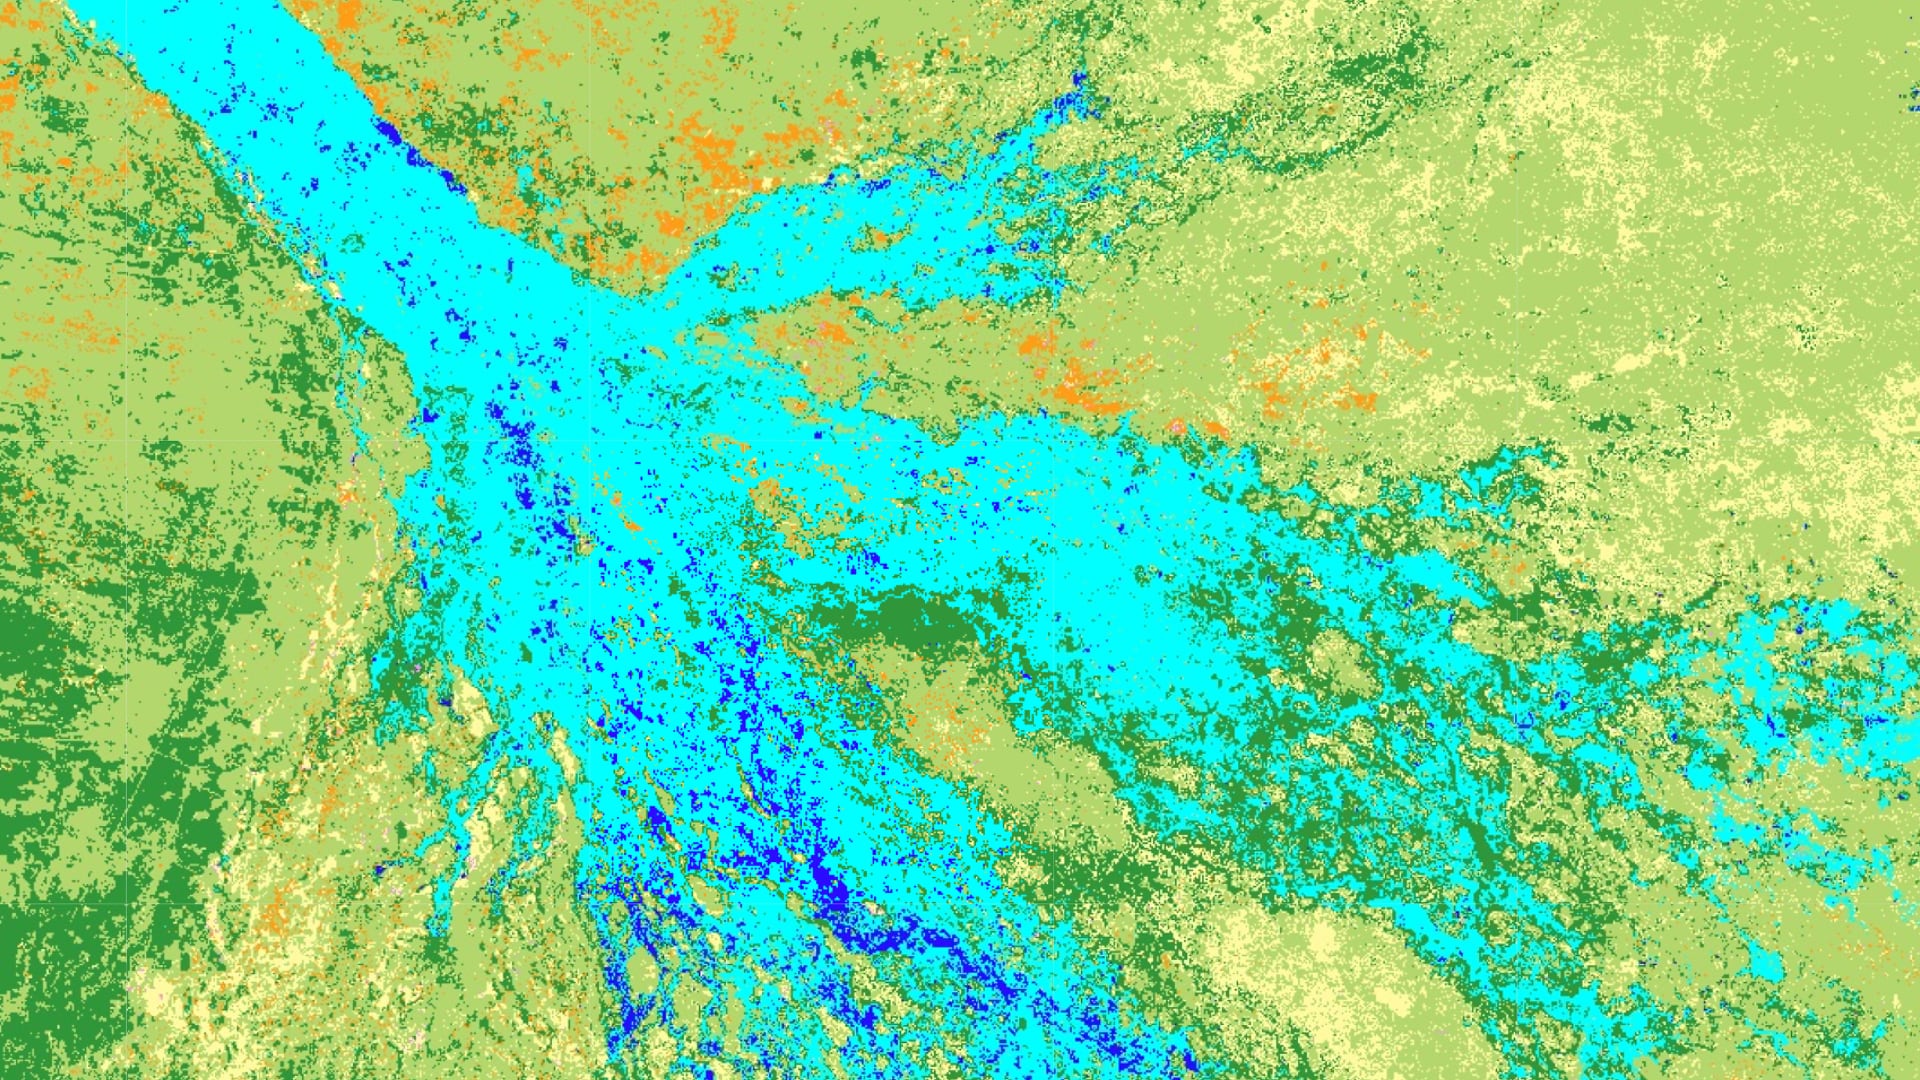
Invasive grass species, specifically B. tectorum (cheatgrass), B. japonicus (japanese brome), and Melilotus (sweet clover), have expanded out of the Great Basin and into the western Great Plains of the United States. Increased development and land use in western South Dakota have provided a gateway...

Principal Investigator

Madison Murphy

Imagen
Monitoring the Urban Heat Island Effect on the Health of Residents in the New Orleans, Louisiana Metropolitan Area with Landsat and MODIS Land Surface Temperature Products

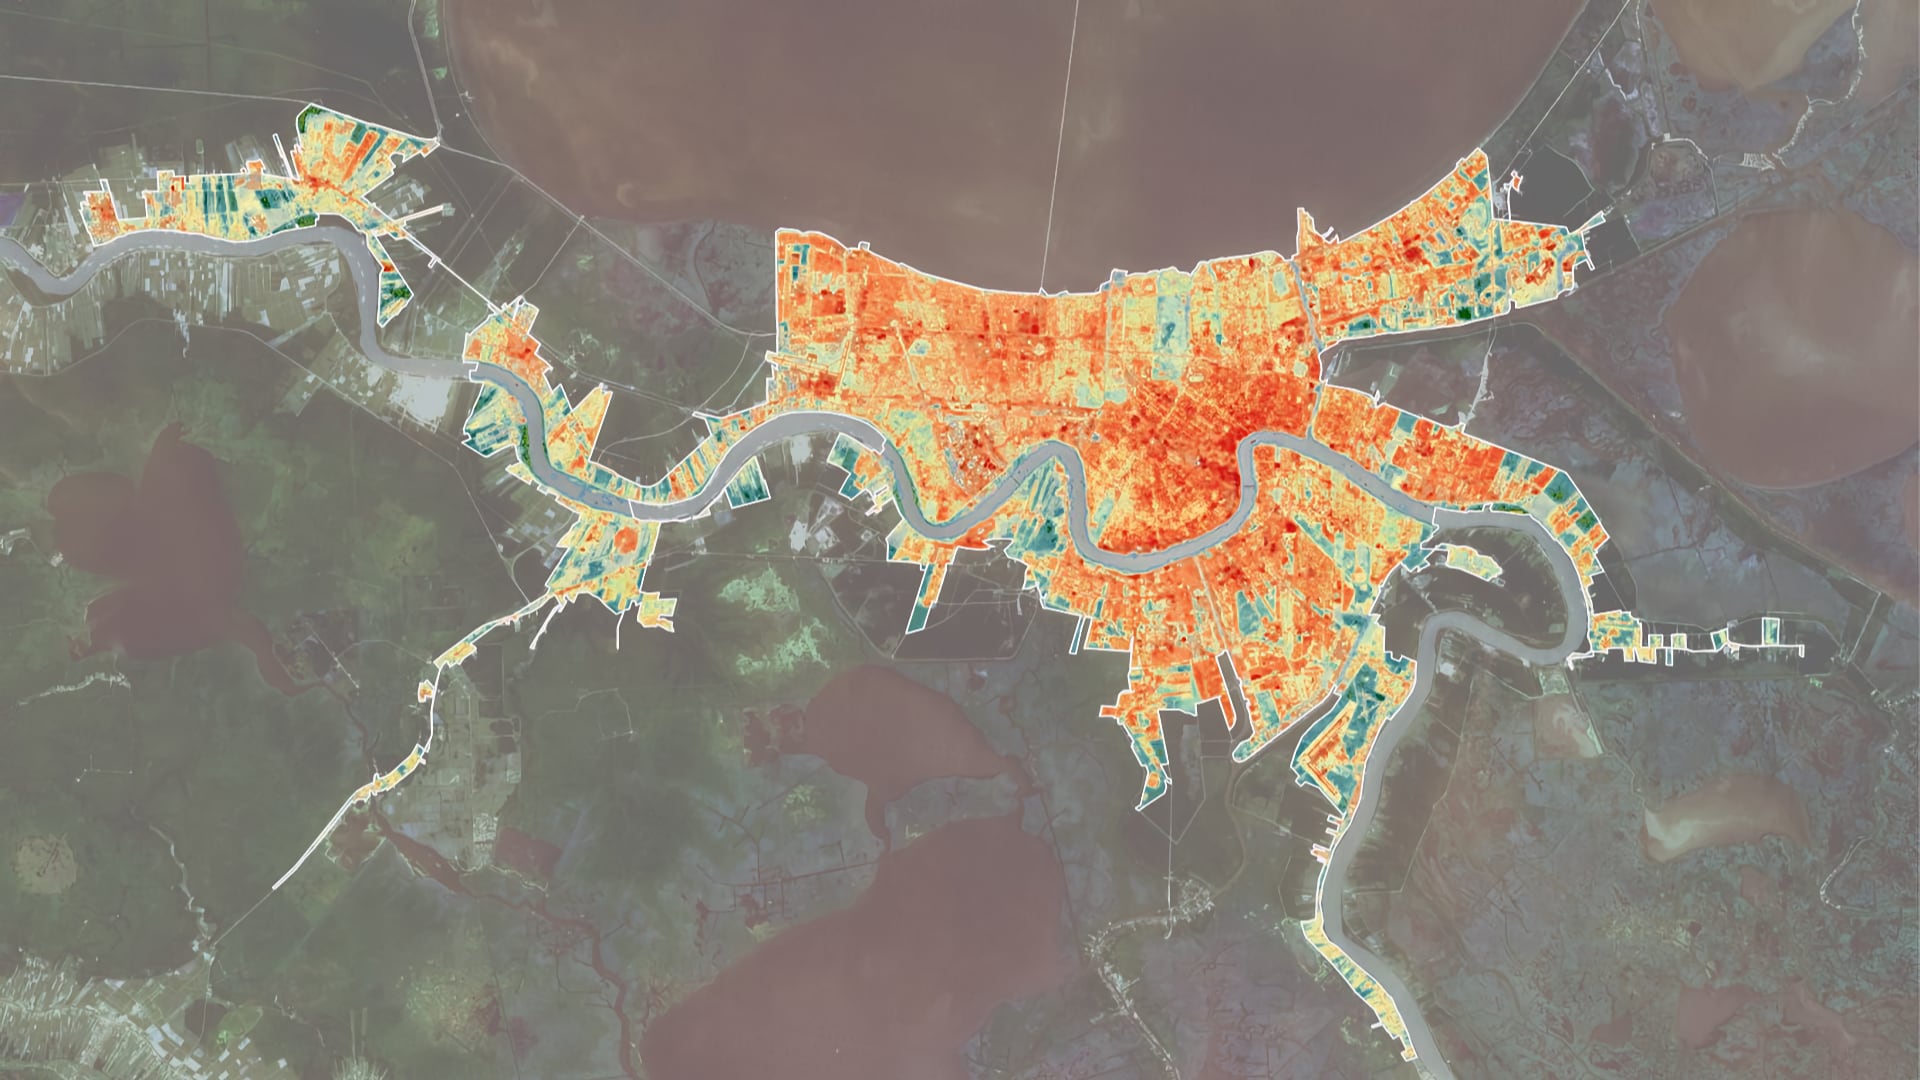
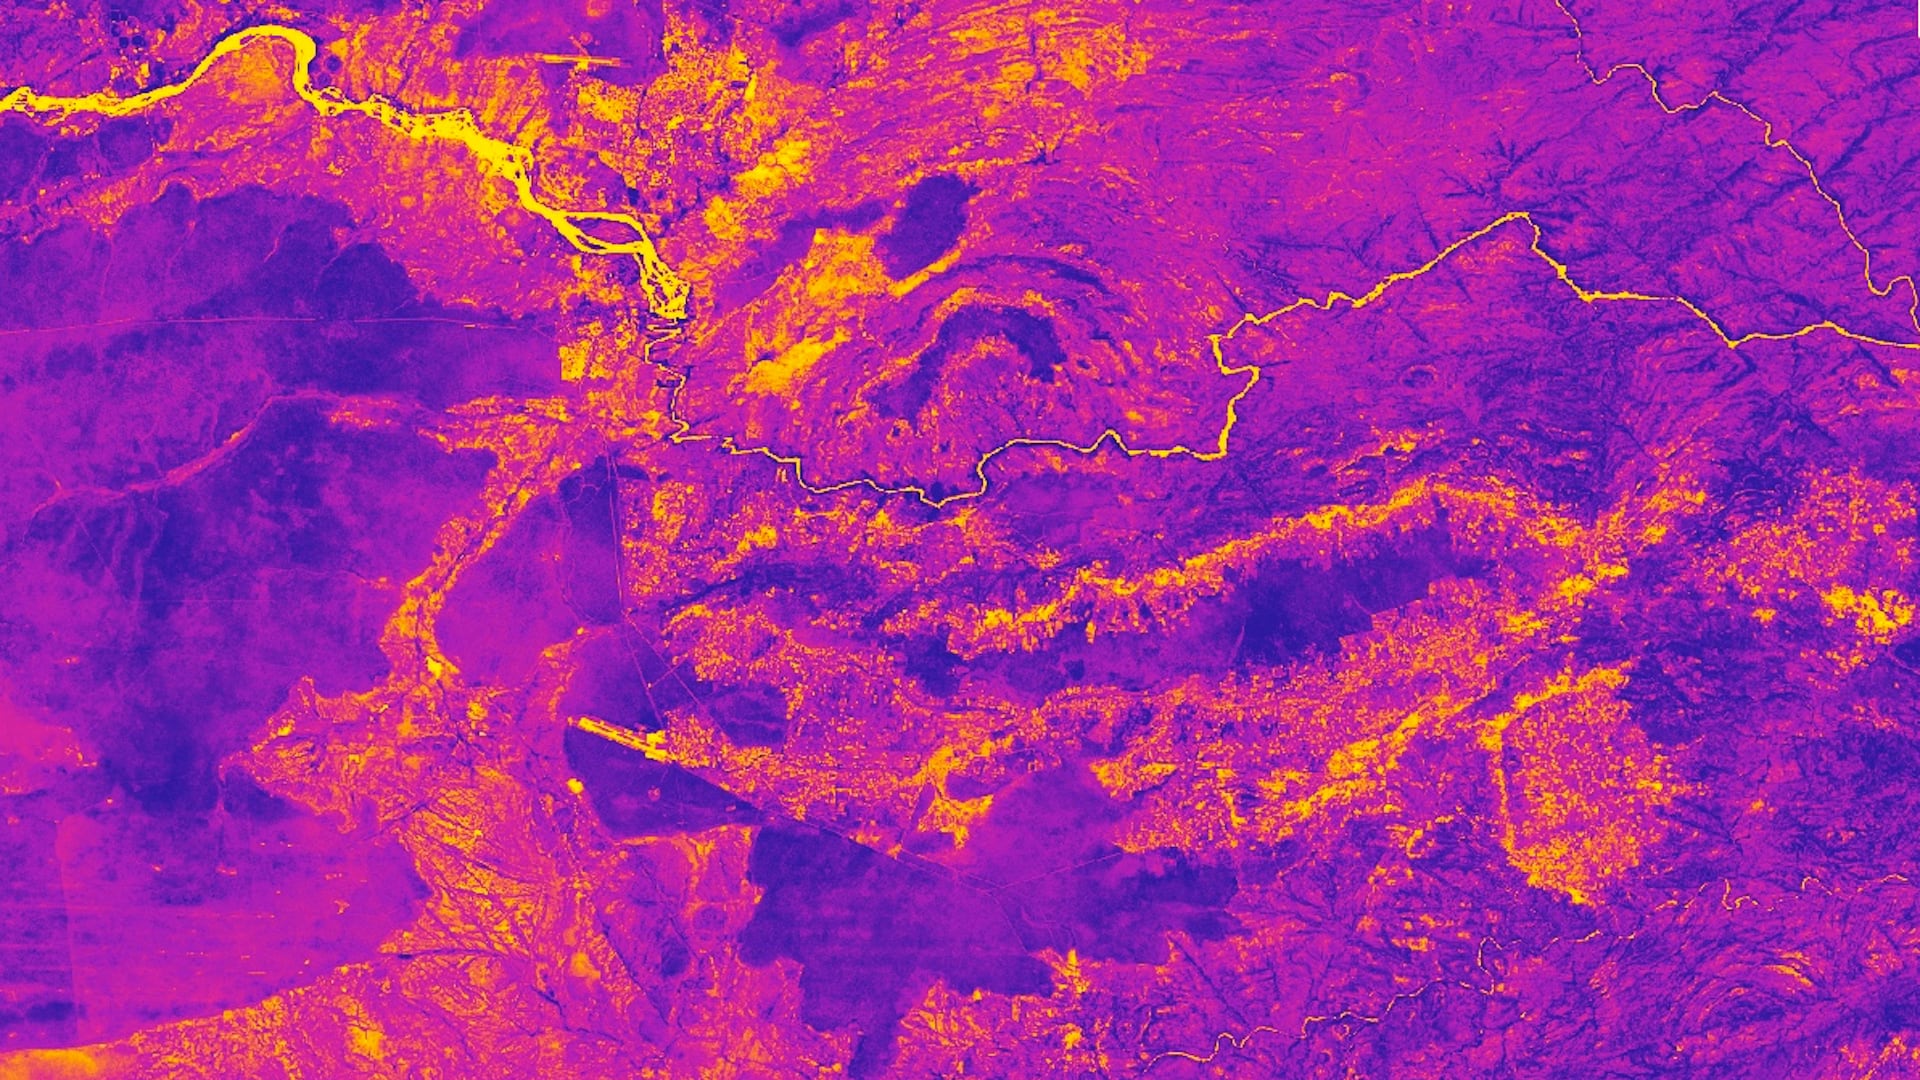
The urban heat island (UHI) effect occurs when non-vegetated surfaces trap heat during daylight hours, increasing the overall temperature of urbanized cities relative to adjacent rural areas. Excessive heat can increase the likelihood of heat stroke or dehydration, especially in vulnerable populations without access to...

Principal Investigator

Benjamin Rocha

Imagen
Diffuse Light Attenuation Coefficient (Kd(490)) processed image utilizing 2020 Landsat 8 OLI remote sensing data, showcasing turbidity within Port Everglades. Port Everglades is located along the Eastern Coast of Florida, south of Fort Lauderdale. Darker shades of blue represent lower levels of Kd(490), implying clearer, and generally healthier, water. Brown and orange represent high levels of Kd(490), generally indicating cloudier water conditions, which pose a threat to coral and coral reef health.  Keywords: Kd(490), Landsat 8 OLI, Coral, Port, Florida

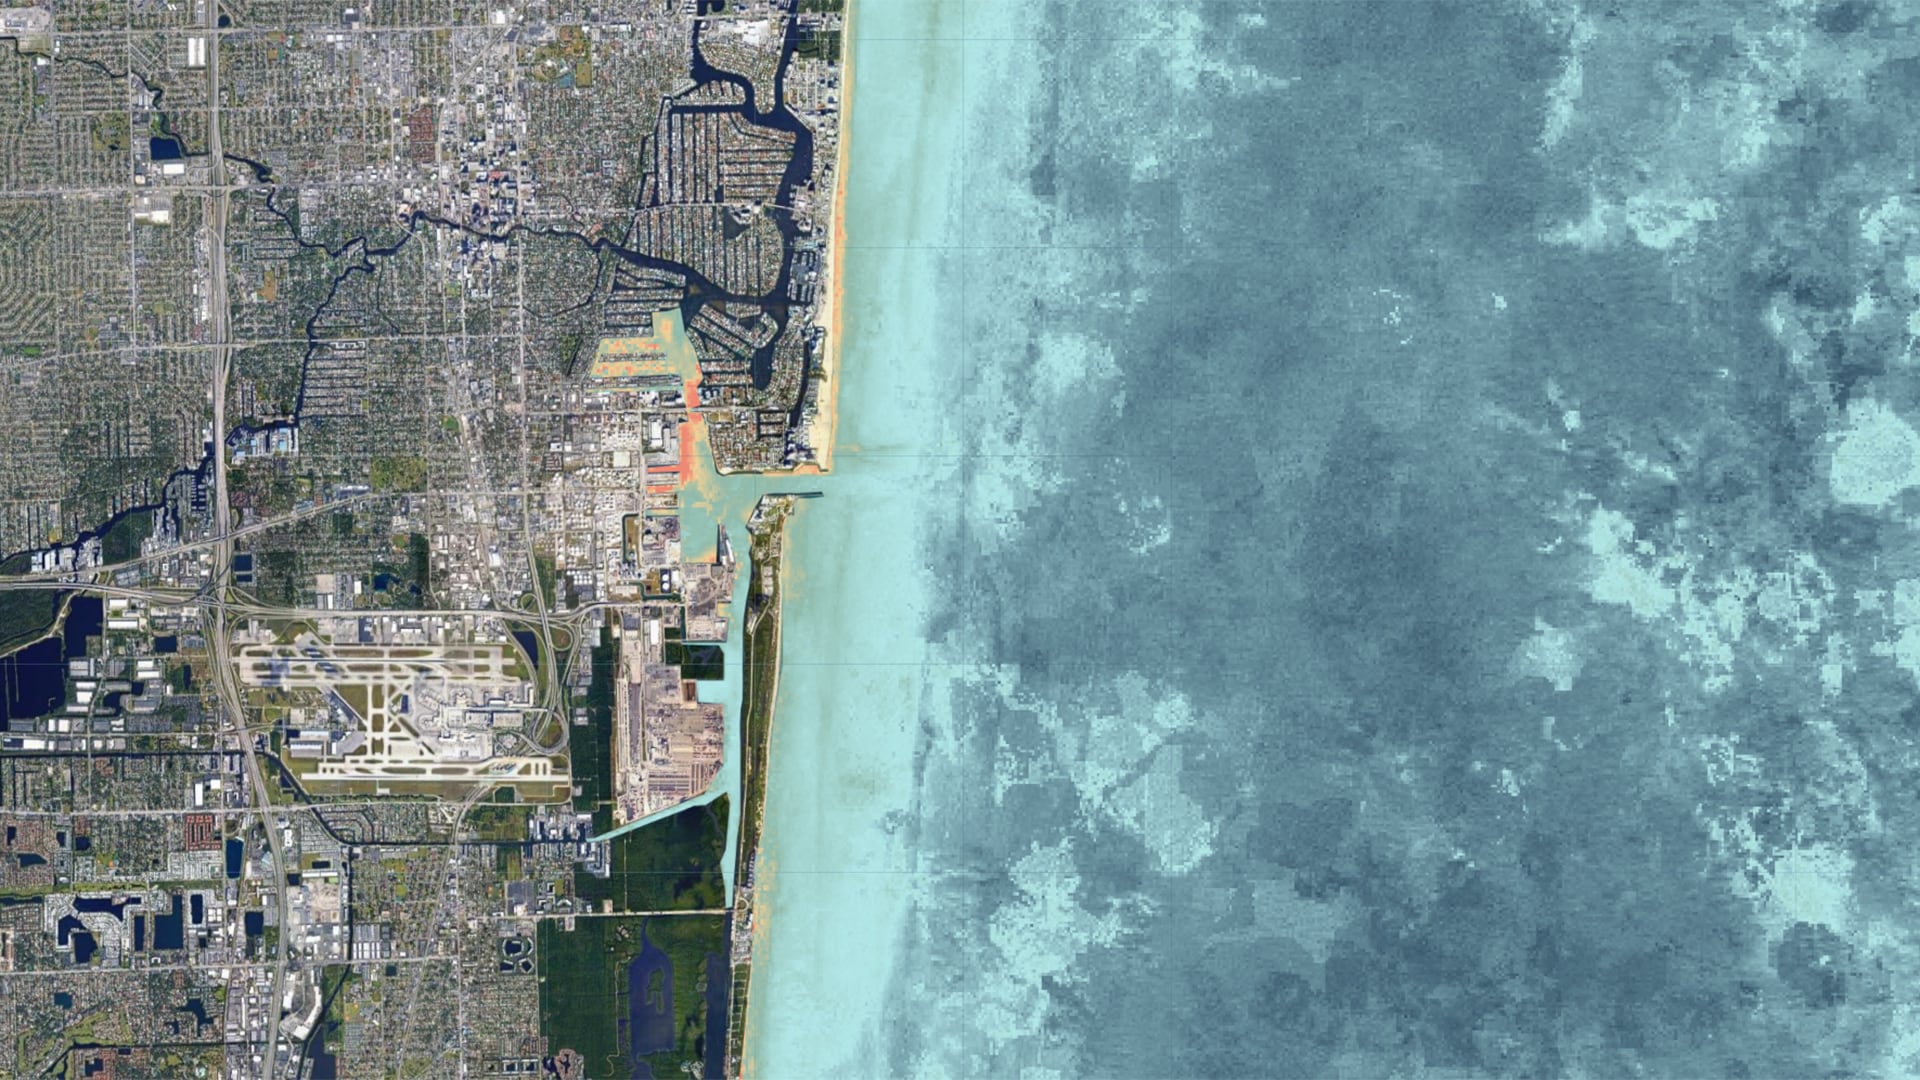
The U.S. Army Corps of Engineers (USACE) and National Oceanic and Atmospheric Administration (NOAA) National Marine Fisheries Service (NMFS) will be supervising a harbor deepening project in Port Everglades, Florida. The project raises concerns about potential impacts on the nearby...

Principal Investigator

Logan Kline

Imagen
Operational Analysis of Winter Cover Crop Environmental Performance throughout the State of Maryland

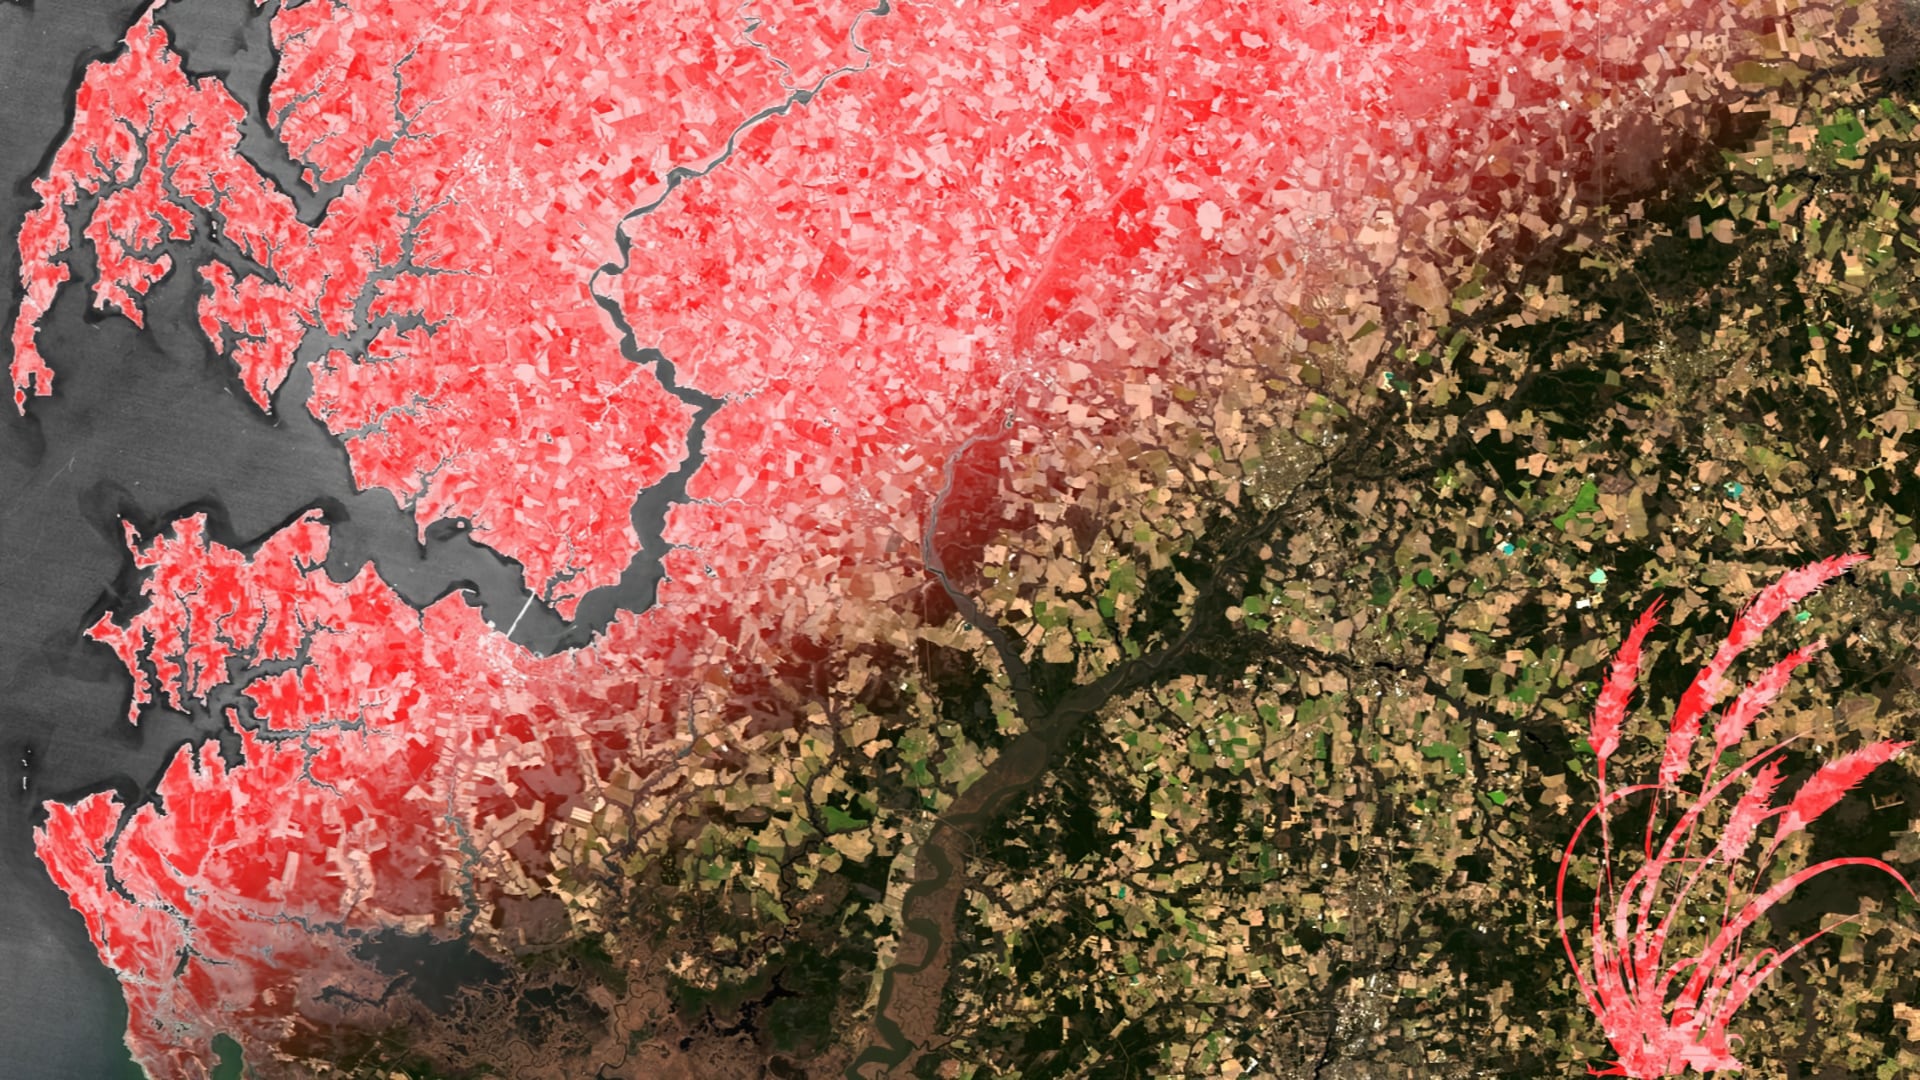
Winter cover crops increase the sustainability of agricultural lands and the health of surrounding watersheds through erosion control and nutrient retention. The Maryland Department of Agriculture (MDA) incentivizes the planting of winter cover crops in the Chesapeake Bay area via a cost-sharing program that offers...

Principal Investigator

Tyler Pantle

Imagen
A composite showing the difference in NDVI between the Summer and Winter of 2019 to capture phenology along the Colorado River in the Grand Canyon. Indices derived from Landsat 8 OLI SR, June 19 and Dec 12. Darker shades of brown indicate a greater difference in NDVI while darker shades of green indicate a lower difference. Pairing on-the-ground phenology observations with remotely sensed data can increase partners' monitoring capacity of native and non-native riparian species.  Keywords: Phenology, NDVI, Landsat

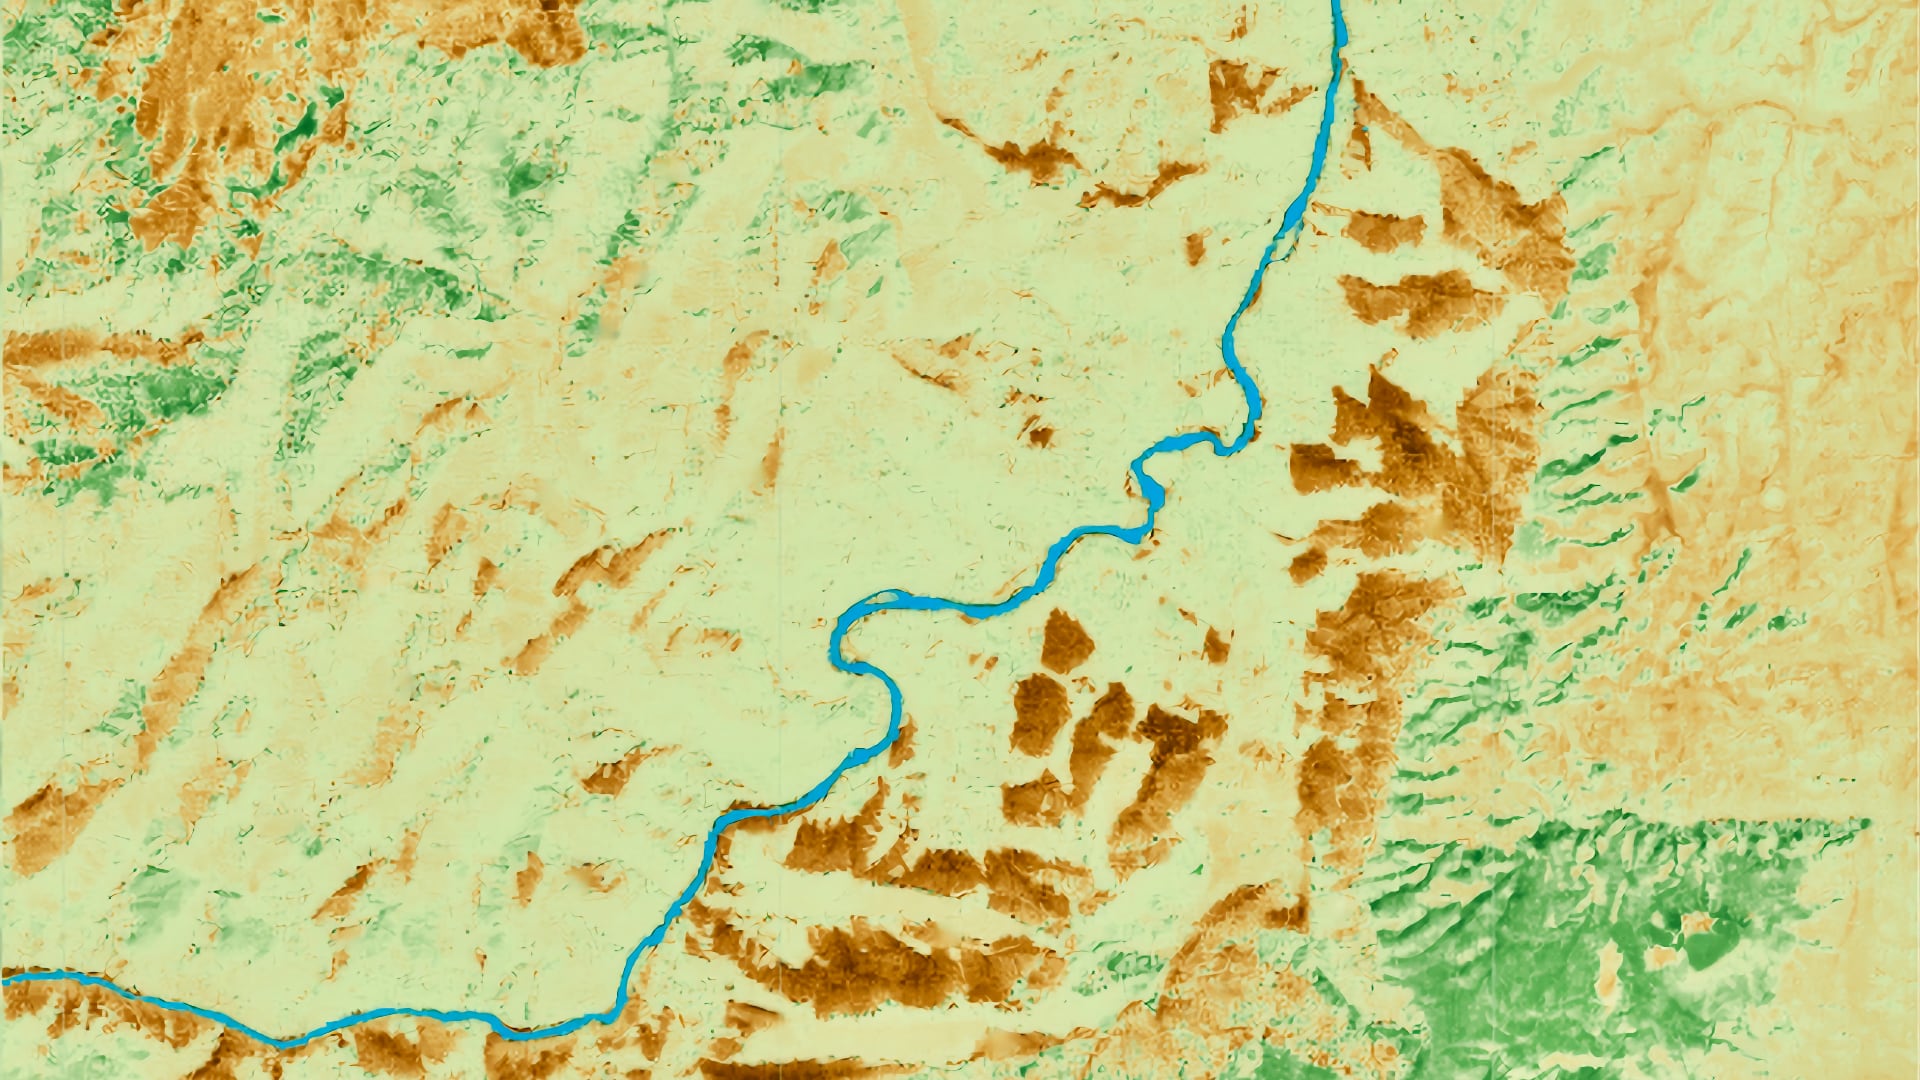
Native plant species in the Colorado River Basin are currently threatened by non-native species that are changing resource competition dynamics. Monitoring native species is essential for understanding changes in plant health throughout the year as well as how species’ distributions...

Principal Investigator

Alexandra Jones

Imagen
Predicting Grunion Migration Patterns and Spawning Areas in Response to Changes in California's Oceans

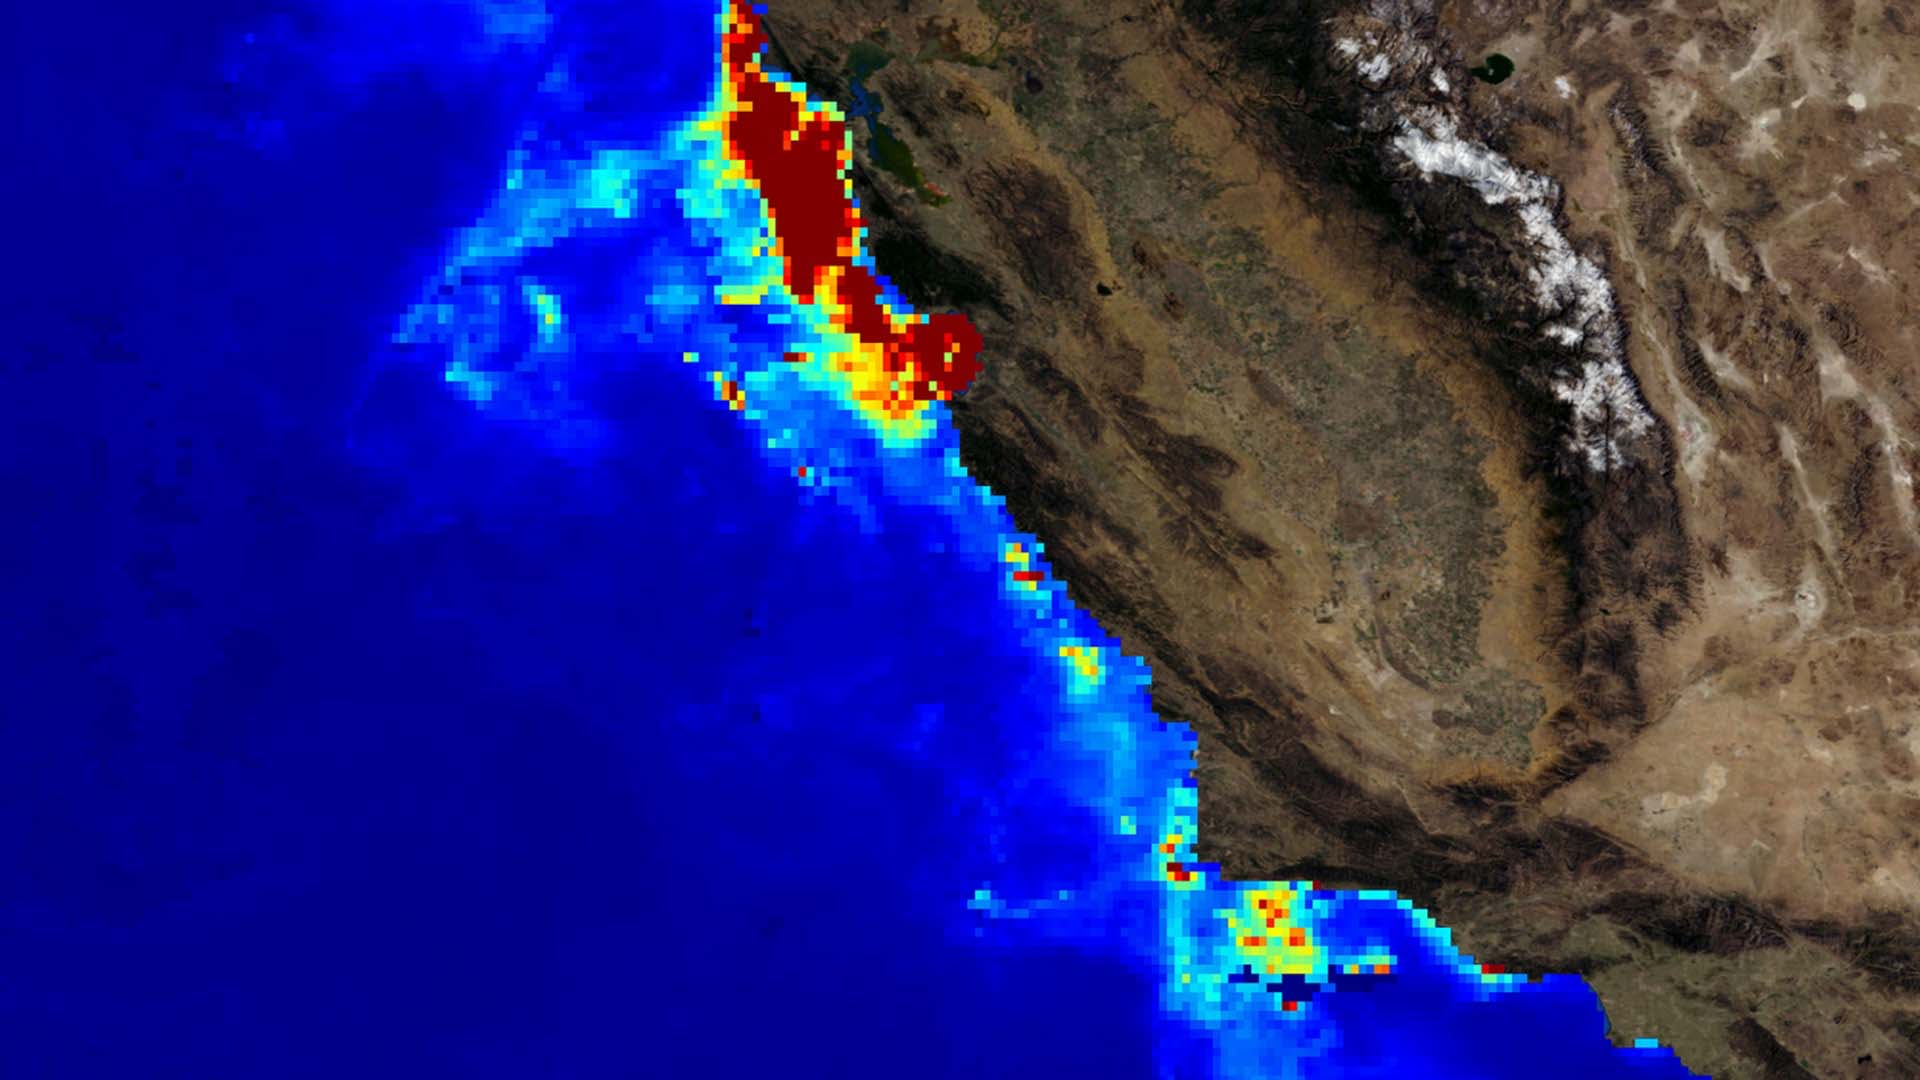
The California grunion (Leuresthes tenuis) is a species of fish endemic to the California coastline that plays an important role in the marine food chain as a consumer of zooplankton and a food source for larger marine creatures. Grunion spawning events, commonly referred to as...

Principal Investigator

Madison Bradley

Imagen
NDVI-processed imagery using Landsat 8 OLI data. Image is displaying Victoria Falls and its surrounding land area in Zimbabwe during the 2019 wet season (November – April). Darker shades of purple indicate healthier vegetation and brighter shades of yellow indicate less healthy vegetation. The yellow band in the right center of the image indicates agricultural plots where elephant crop raiding events have been recorded.   Keywords: NDVI, Zimbabwe, Victoria Falls, Human-Elephant Conflict, Climate, Vegetation, Elephant Habitat, Agriculture

Human-wildlife conflict is increasingly more common due to human population growth, habitat fragmentation, and changing climatic conditions. This conflict is particularly evident in the Kavango-Zambezi area, where over three million people share the landscape with an abundant megafauna population. As...

Principal Investigator

Madison Bradley

Imagen
Land use land cover classified image using Landsat 8 OLI imagery. The Landsat 8 imagery was collected between March and July of 2020. The alluvial fan of the Okavango Delta in Botswana is pictured. The cyan blue represents wetland habitats and dark blue is permanent water. Shades of green indicate woodlands and grasslands. The orange patches are agricultural areas that are prone to human-elephant conflict events and are the focus of this project’s research.  Keywords: Land Cover Classification, Kavango-Zambezi TFCA, Human Elephant Conflict, Okavango Delta, Google Earth Engine

In the Kavango-Zambezi area of southern Africa, three million people live within areas frequently traveled by free-ranging elephants. As the region continues to develop rapidly, urban and agricultural settlements further encroach upon the land that these elephants use. As elephants come...