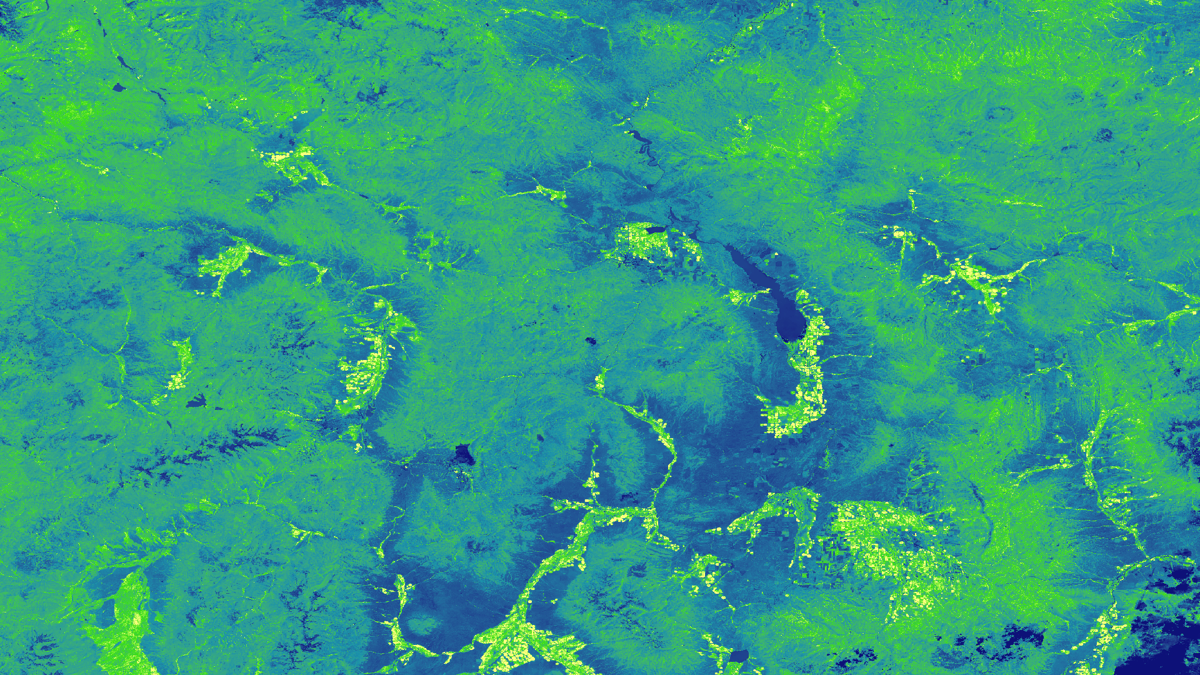
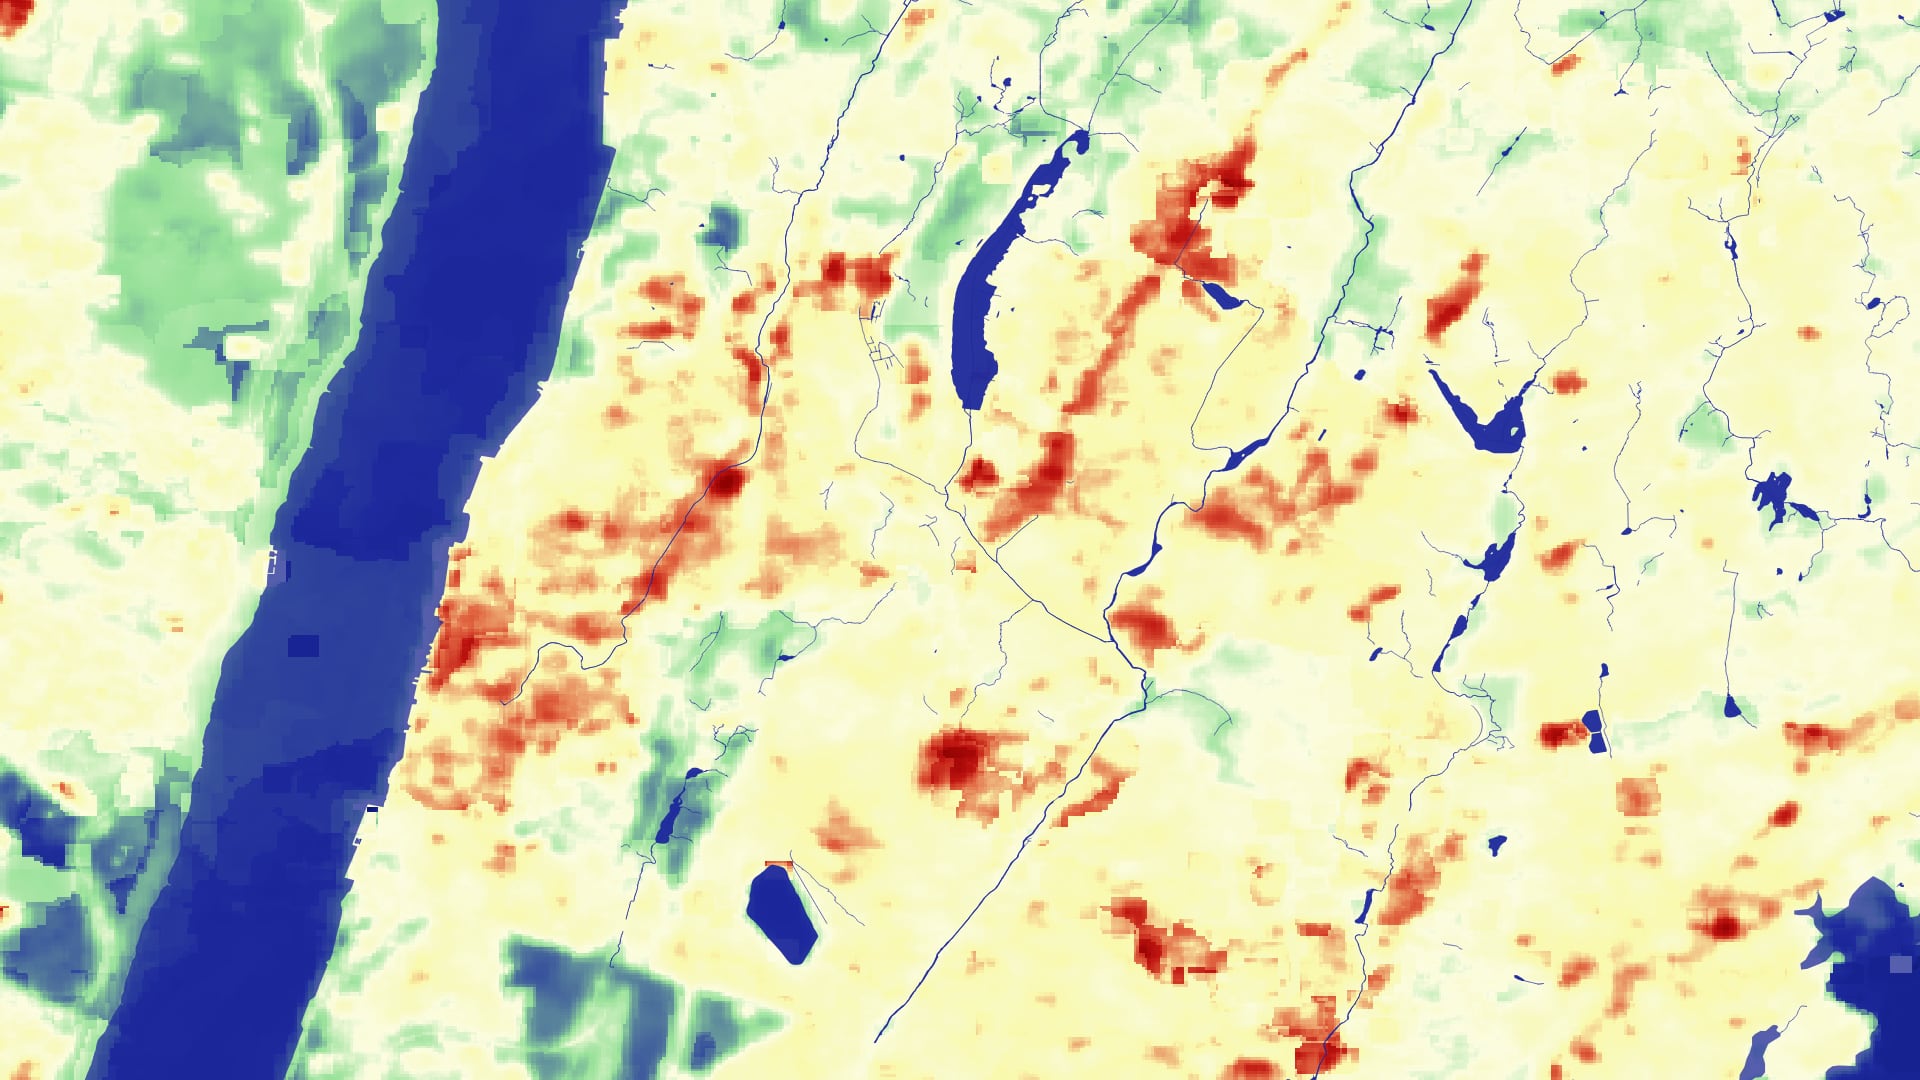
Principal Investigator

Megan Vahsen

Imagen
Utilizing NASA Earth Observations to Evaluate Invasive Species Cover in Riparian Areas of the Colorado River Basin

Riparian corridors are inhabited by unique and biodiverse plant communities that control erosion, manage sediment loads, and filter pollutants. These ecosystems are transitional zones between terrestrial and aquatic systems that provide important wildlife habitat and maintain the overall health of rivers. The Colorado River Basin...

Principal Investigator

Katie Walker

Imagen
Utilizing NASA Earth Observations to Evaluate the Distribution of Russian Olive and its Impact on Evapotranspiration in the Upper Colorado River Basin

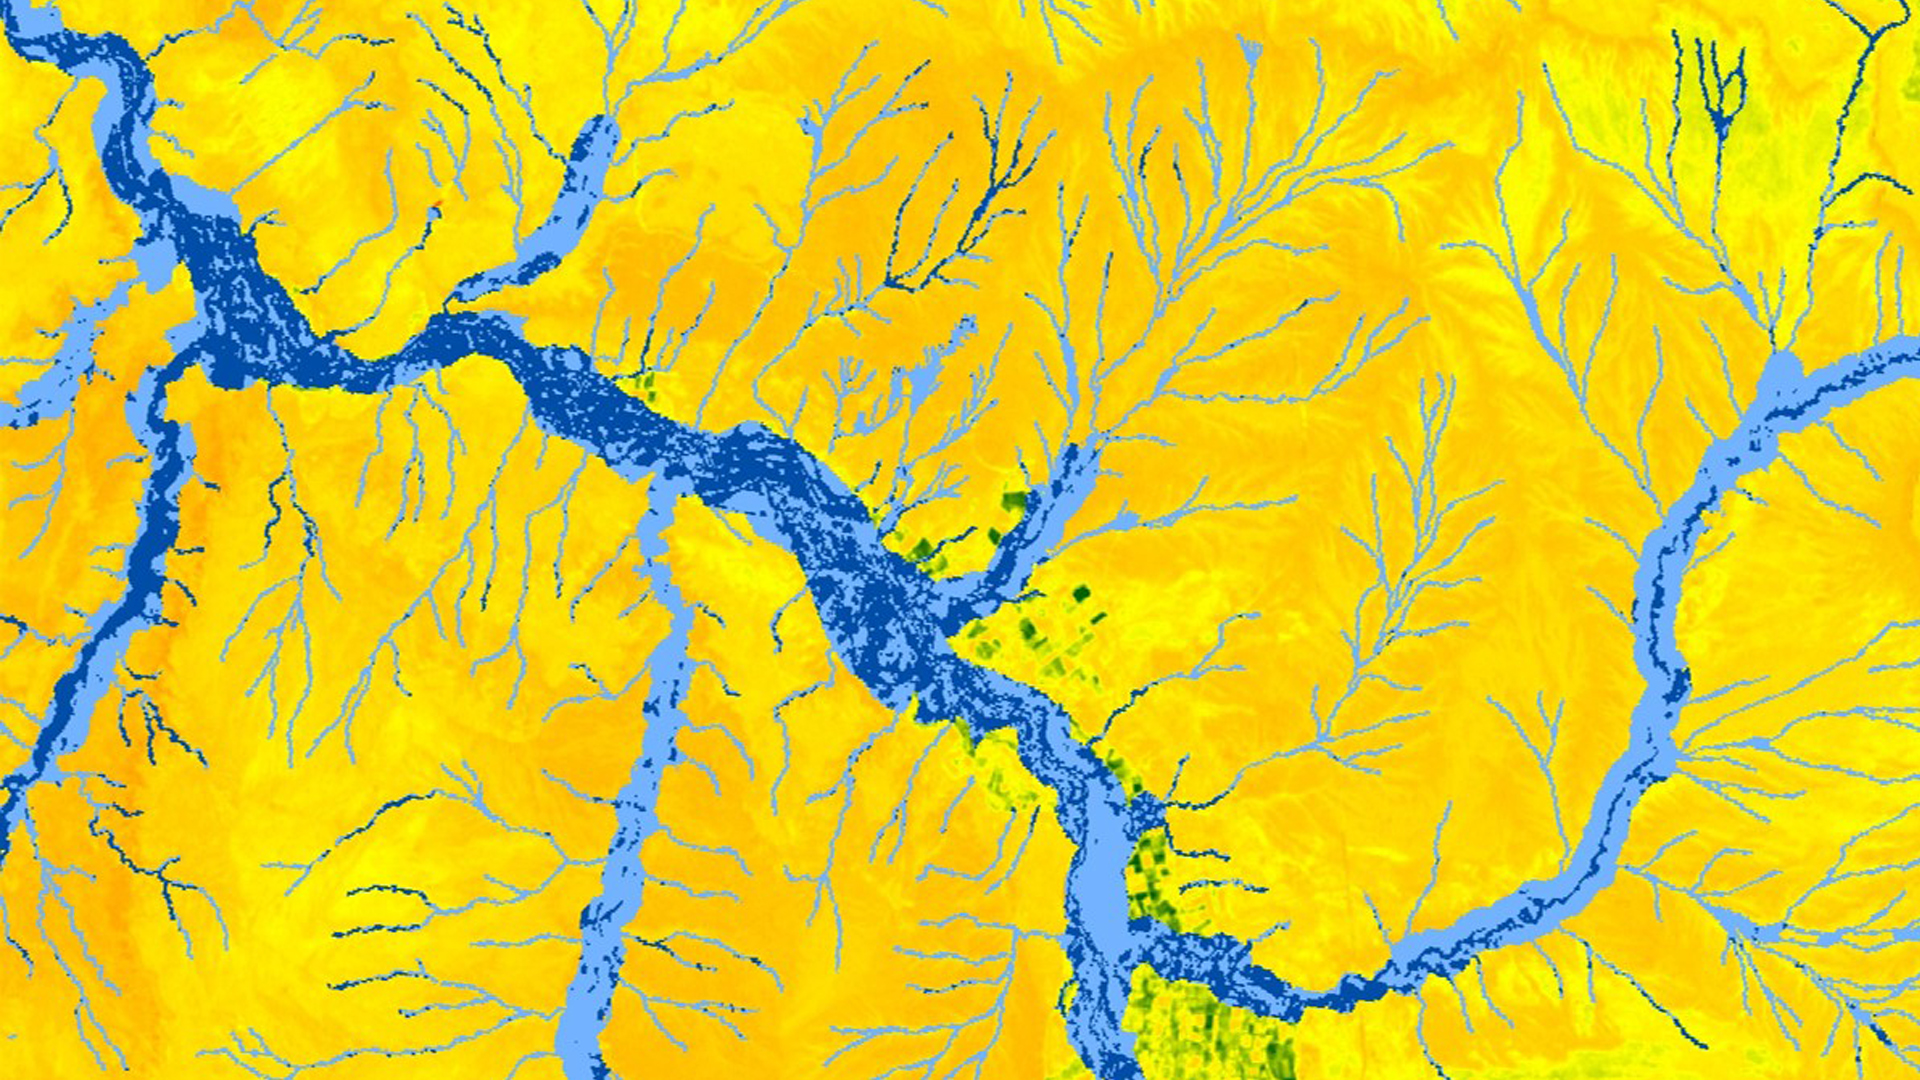
Riparian plant communities are vital to water quality, erosion control, biodiversity, and functionality of river ecosystems. The invasion of nonnative Russian olive (Elaeagnus angustifolia L.) poses a risk to these fragile ecosystems, as it outcompetes native riparian species such as cottonwoods (Populus spp.) and willows...

Principal Investigator

Greta Paris

Imagen
This image shows Landsat 8 OLI and TIRS imagery for Huntsville, Alabama averaged over the months of June, July, and August 2019. The imagery is processed (left to right): for NDVI with darker greens indicating higher NDVI and lighter greens indicating lower NDVI, LST with red indicating warmer temperatures, yellow indicating moderate temperatures, and blue indicating cooler temperatures, and NDBI with darker purple indicating higher NDBI and lighter purple indicating lower NDBI.   Keywords: Huntsville, Landsat, Urban Heat, Greta Paris, Thomas Quintero, Sabine Nix, Amanda Tomlinson​

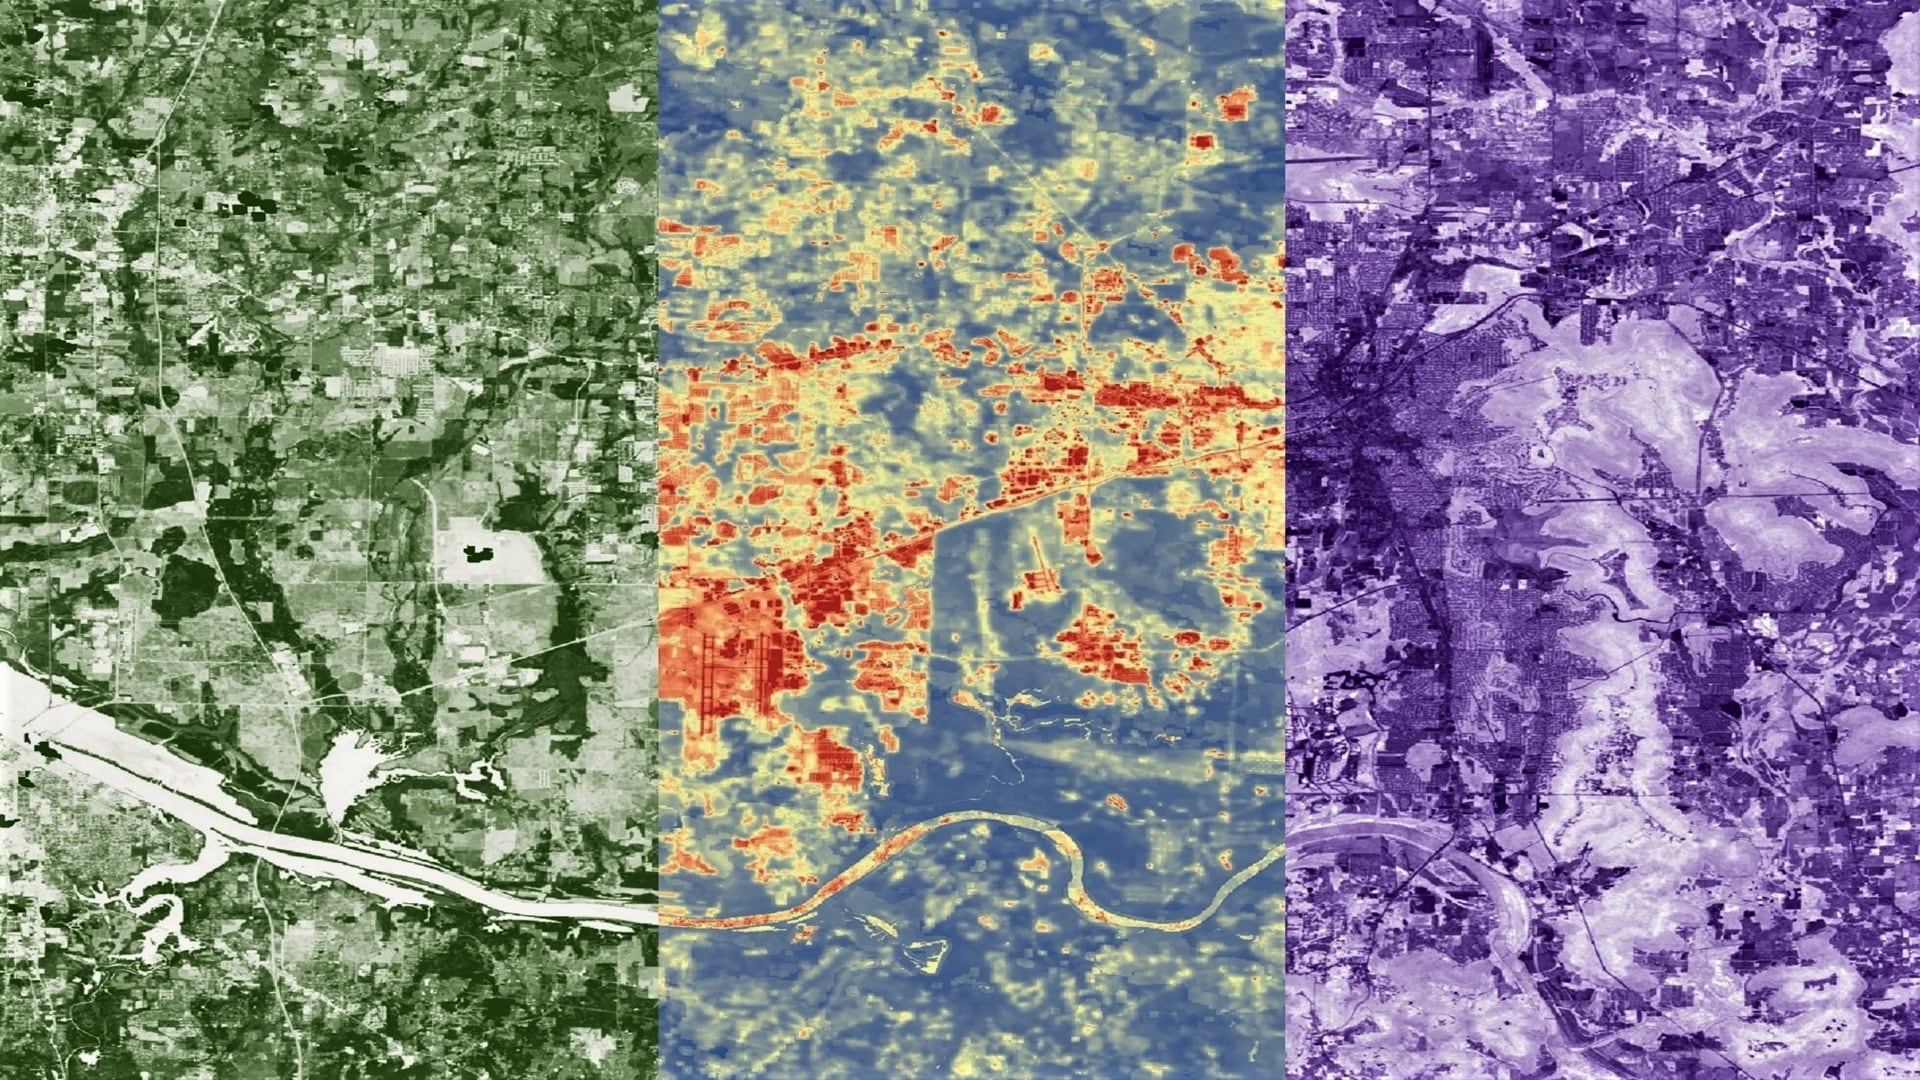
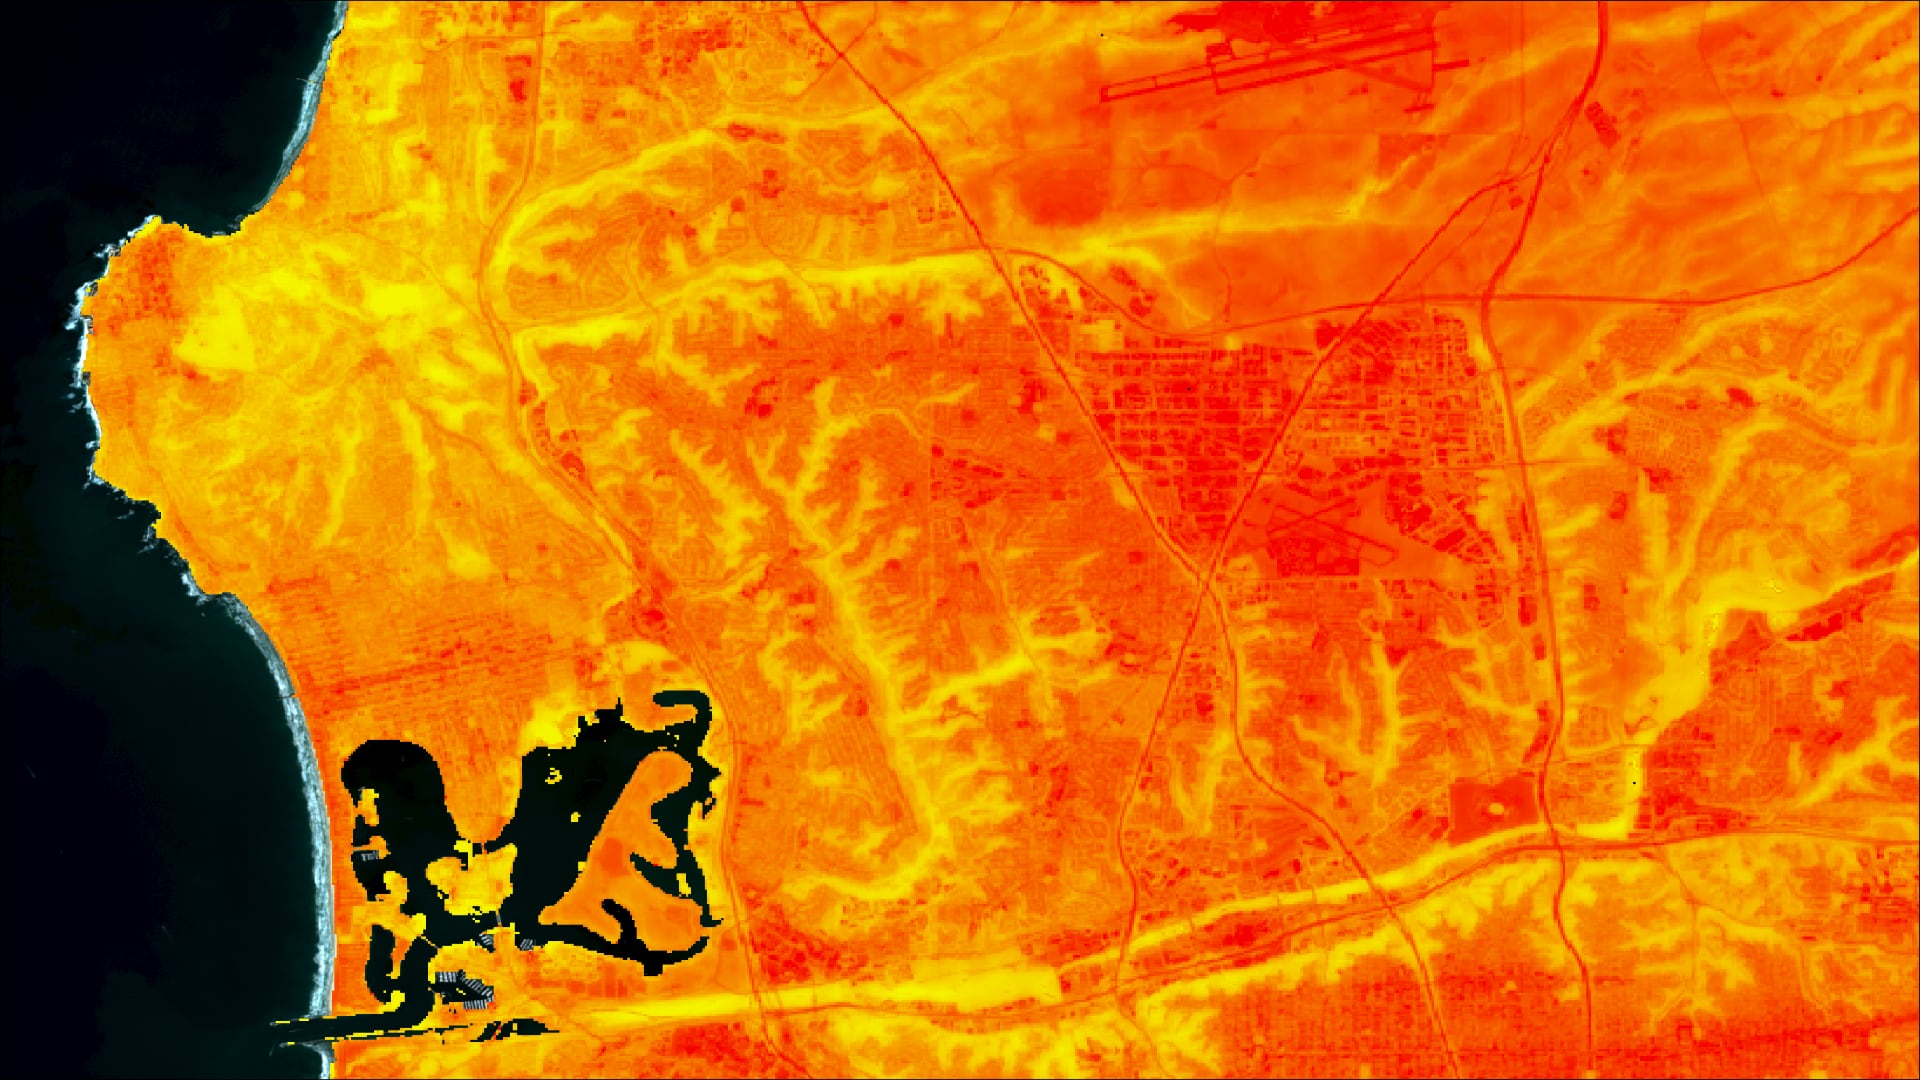
Huntsville, Alabama’s population has grown by approximately 11% since 2010, due in part to the city’s advancing engineering industry. Rapid urban growth negatively impacts the environment by decreasing tree canopy cover and increasing impervious surface cover, which can intensify the...

Principal Investigator

Holly Gould

Imagen
Land surface temperature averages for 2014 through 2018 derived using the new Landsat Level-2 Provisional Surface Temperature product (Landsat 7 ETM+ and Landsat 8 OLI). This image is focused on Providence, RI, and was used to assess urban heat within the city. Higher surface temperatures appear lighter pink; lower surface temperatures appear deeper pink. The blue areas represent the water surrounding the area.

Coastal cities like Providence, RI, and Elizabeth, NJ, are directly affected by extreme heat and flooding events, which impacts the lives of community members. Groundwork USA is a community-based non-profit organization dedicated to increasing environmental resilience in urban communities. One...

Principal Investigator

Julia Sullivan

Imagen
Utilizing NASA Earth Observations to Forecast Forest Risk to Bark Beetle Attack in Support of a Forest Bioenergy Feasibility Assessment

The mountain pine beetle (Dendroctonus ponderosae) is an endemic species and a natural driver of forest ecosystems. This beetle has impacted millions of acres of coniferous forest in the western United States since the early 2000s. Forest ecosystems provide critical habitat for wildlife, filter air...

Principal Investigator

John Dialesandro

Imagen
Daytime average land surface temperature (LST) for the City of San Diego, California from 2018-2020. LST data are derived from the Landsat 8 Operational Land Imager, retrieved from Google Earth Engine. The Surface Reflectance Tier 1 products of albedo, Normalized Difference Vegetation Index, and brightness were used to calculate LST. Yellow indicates coolest (65° F) and burnt orange the hottest (147° F) temperatures. Built environments (airports and freeways) are much hotter than unbuilt green areas.  Keywords: InVEST cooling model, Urban heat, San Diego

Exposure to heat exacerbated by an increase in urbanization as well as increasing global temperatures has become a growing concern for cities and their residents. Excess heat can cause increased heat-related morbidity, mortality, and energy costs. Vulnerability to heat-related illnesses...

Principal Investigator

Jillian Walechka

Imagen
Mean Land Surface Temperature (LST) calculated using thermal imagery from Landsat 8 TIRS using open-source code from Emirda et al. (2020), on imagery from June-August 2015-2020. The city of Yonkers, NY sits to the bottom-center of the map, the Hudson River to the west and Long Island Sound to the east. Blue shows waterbodies, green displays areas of cooler LST, and orange/red areas display areas of hotter LST.  Keywords: Land Surface Temperature, LST, UHI, Urban Heat Island, Yonkers, New York, Landsat 8, TIRS, Westchester County, Jillian Walechka, Joseph Scarmuzza, Kathryn Greenler, Samain Sabrin, Tanya Bils

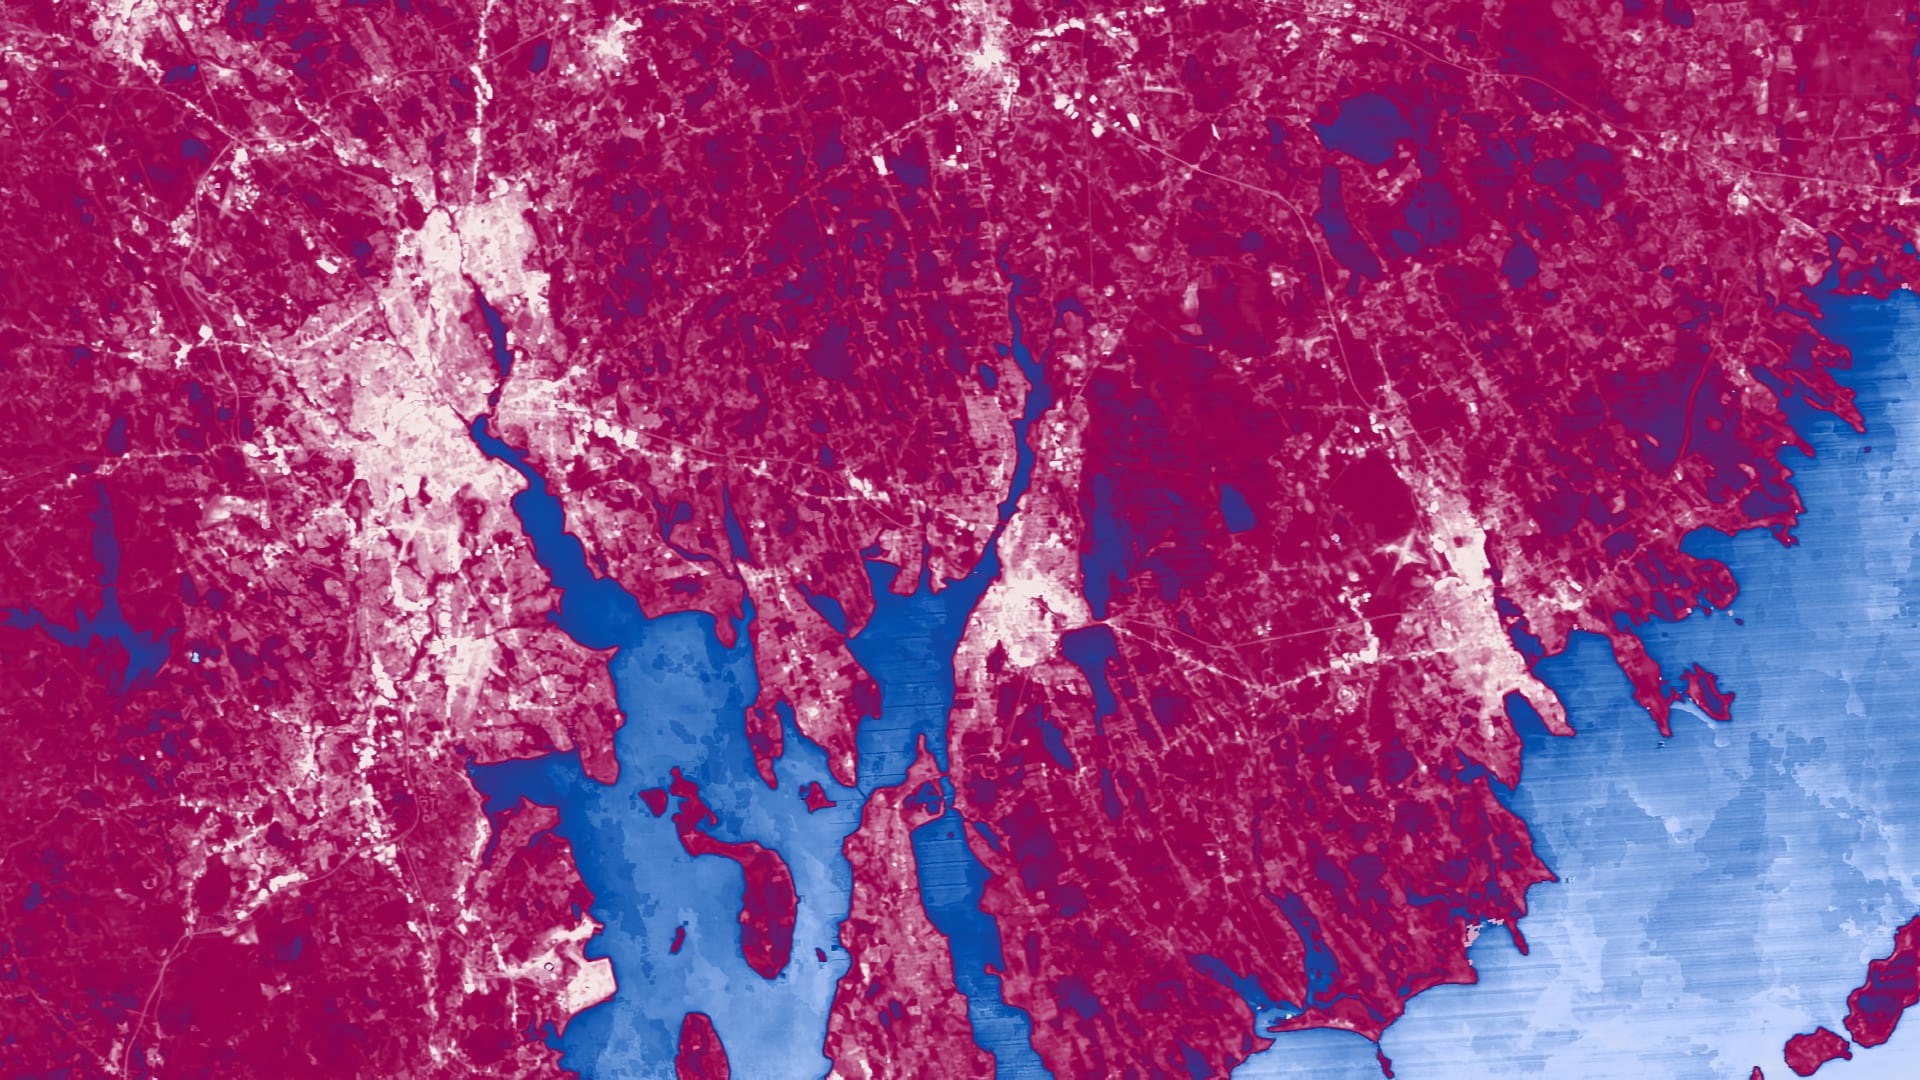
The City of Yonkers, New York, is located directly north of the Bronx in Westchester County and currently hosts a population of nearly 200,000. In response to increasing hot-weather episodes, the risk of heat-related illnesses and mortality is disproportionately affecting...

Principal Investigator

Cody O'Dale

 
Imagen
Utilizing NASA Earth Observations to Identify Existing Surface Water Features and Improve Water Management and Resource Allocation in Southeast Idaho

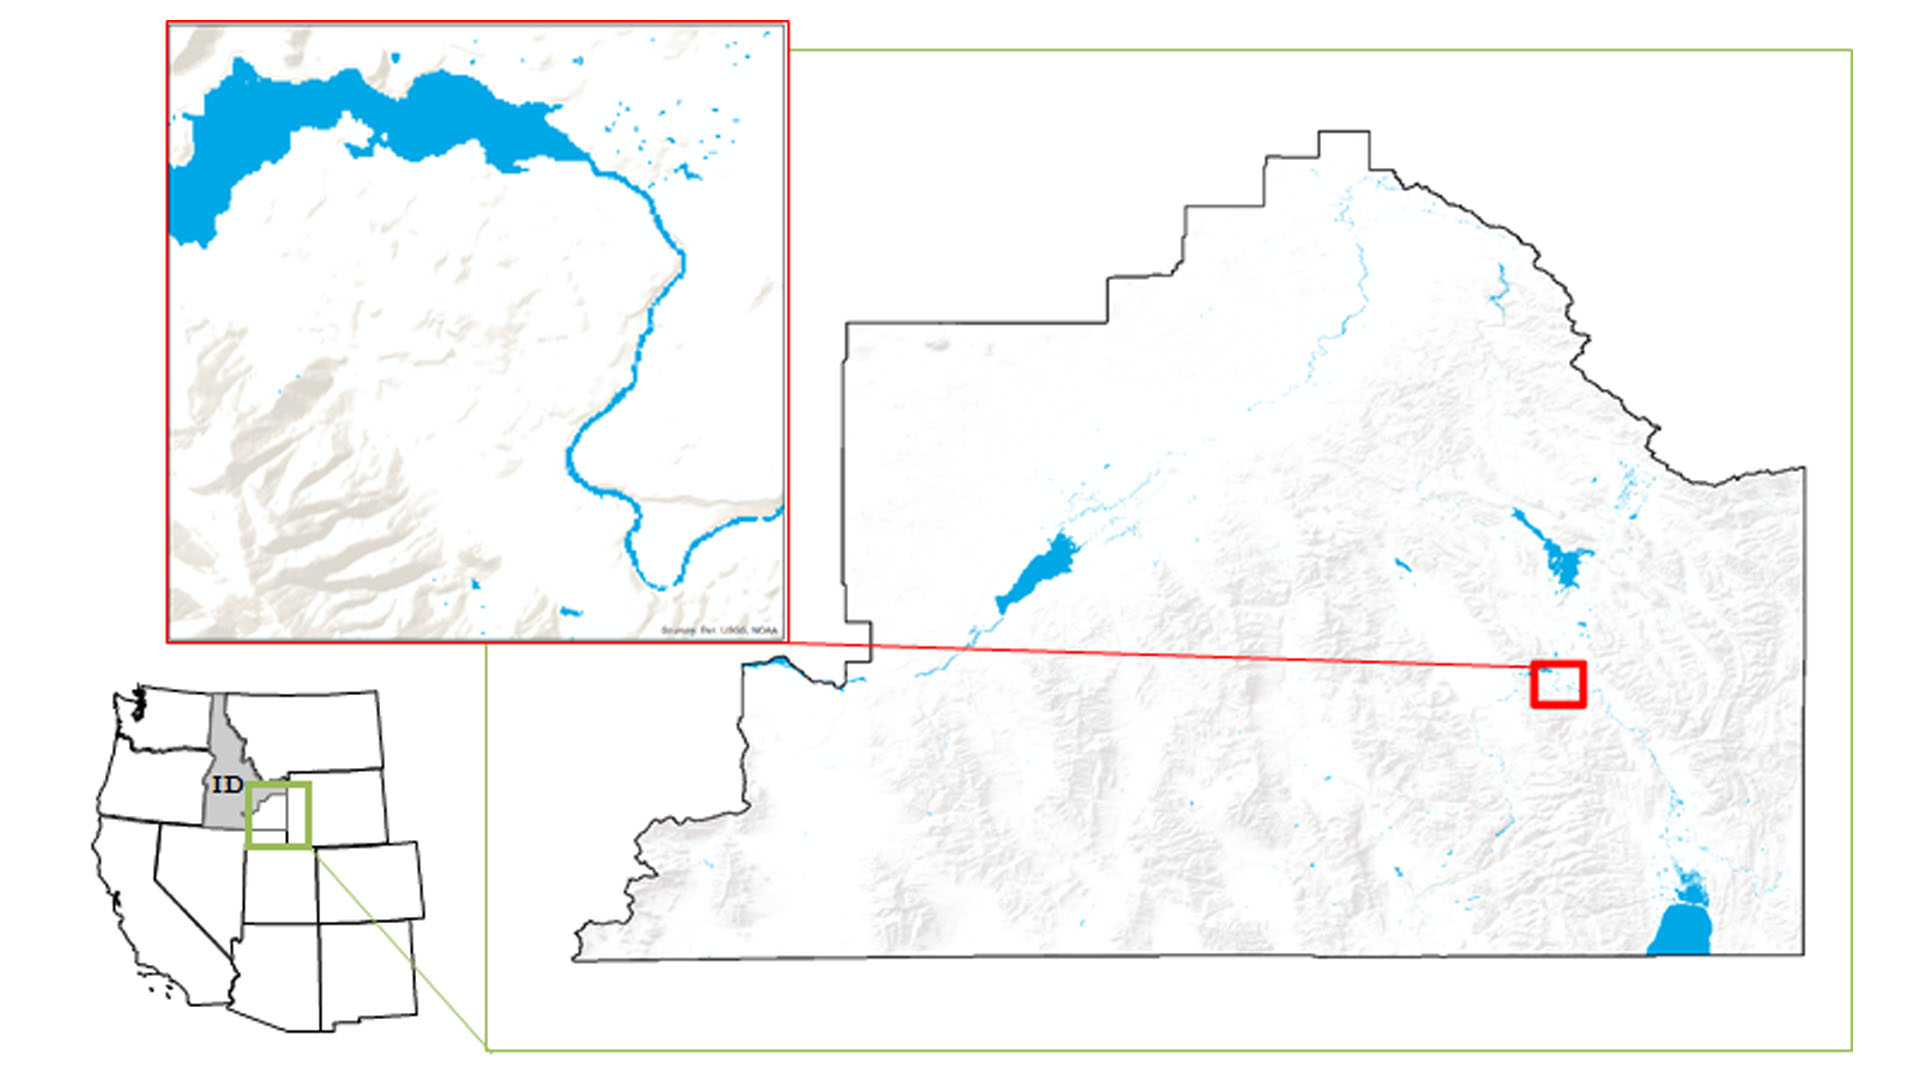
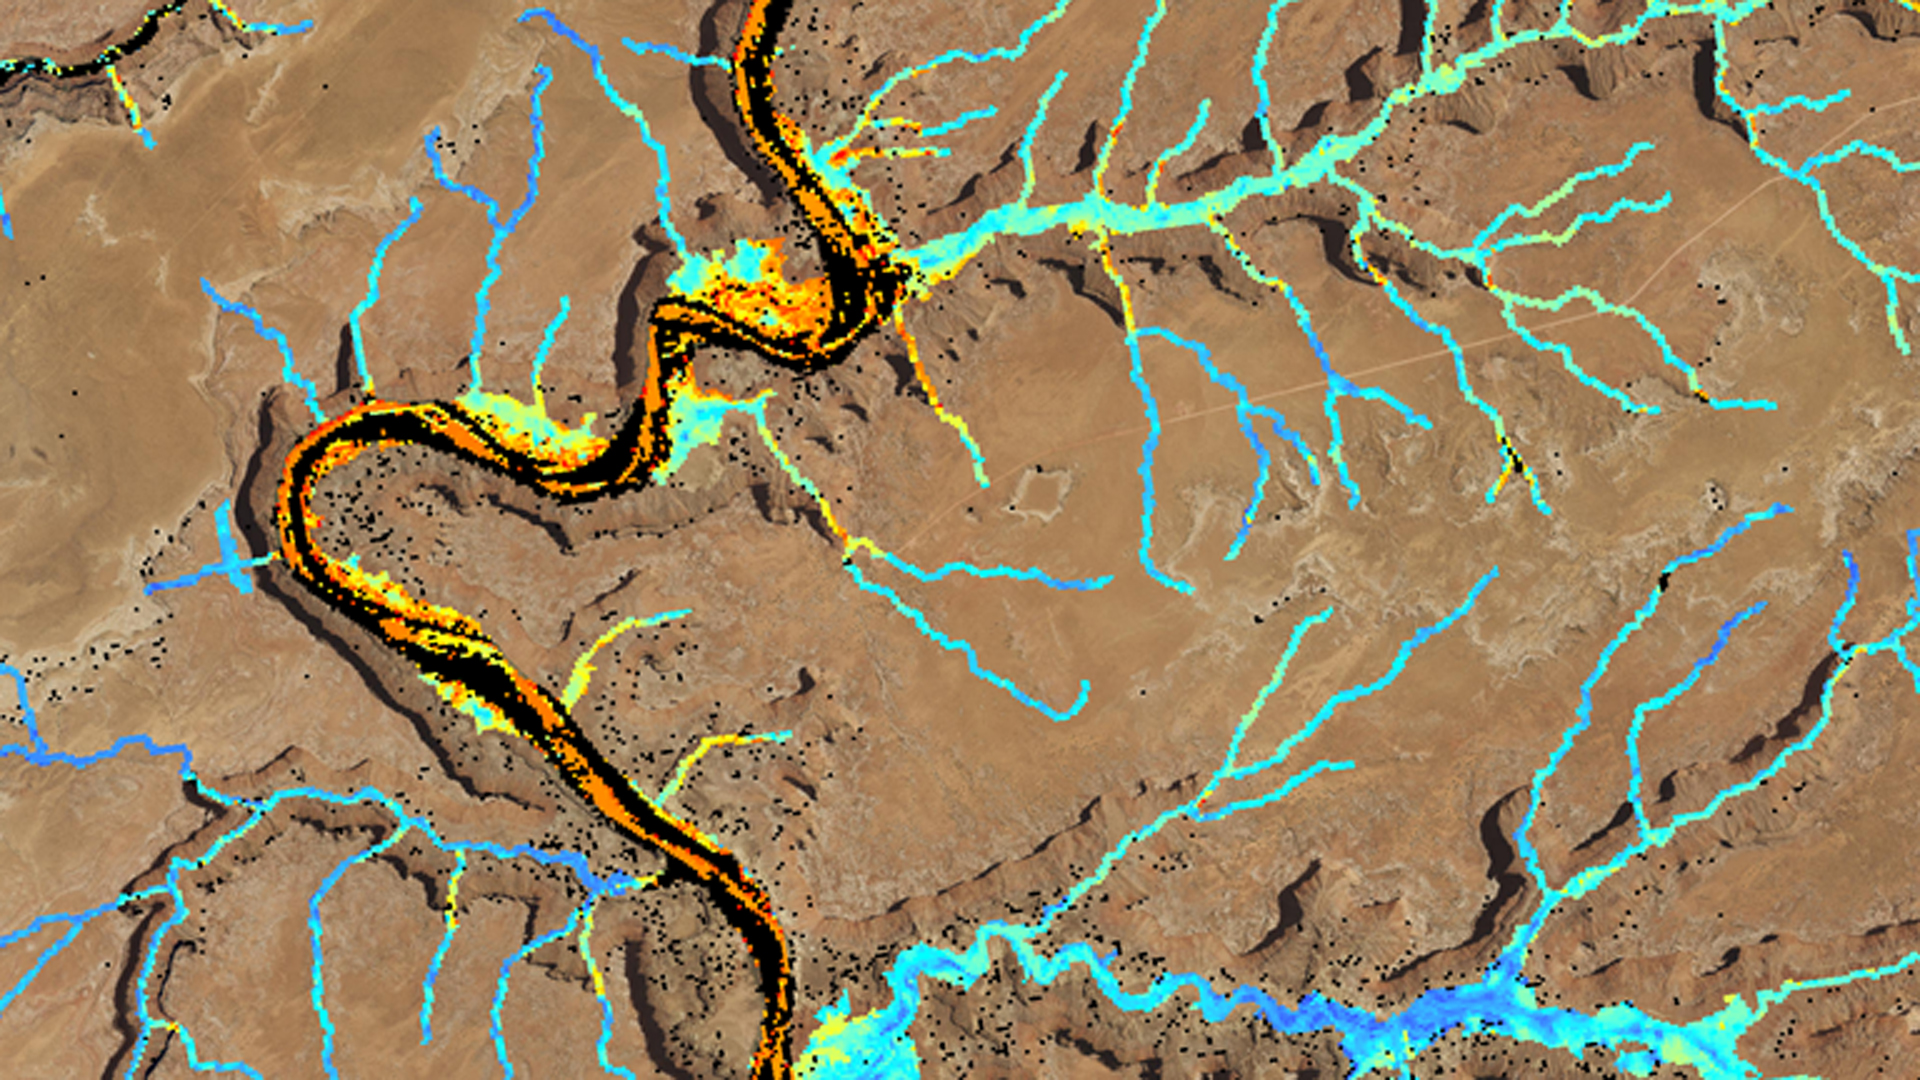
Understanding water dynamics in southeast Idaho is critical to planning and improving water management practices. Partner organizations that focus on water resource management, such as the Bureau of Land Management (BLM) and Idaho Department of Water Resources (IDWR), currently use the National Hydrography Dataset...

Principal Investigator

Madeline Ruid

 
Imagen
Utilizing NASA Earth Observations to Map Eastern Hemlock for Hemlock Woolly Adelgid Management in Adirondack Park and Tug Hill State Forest, New York

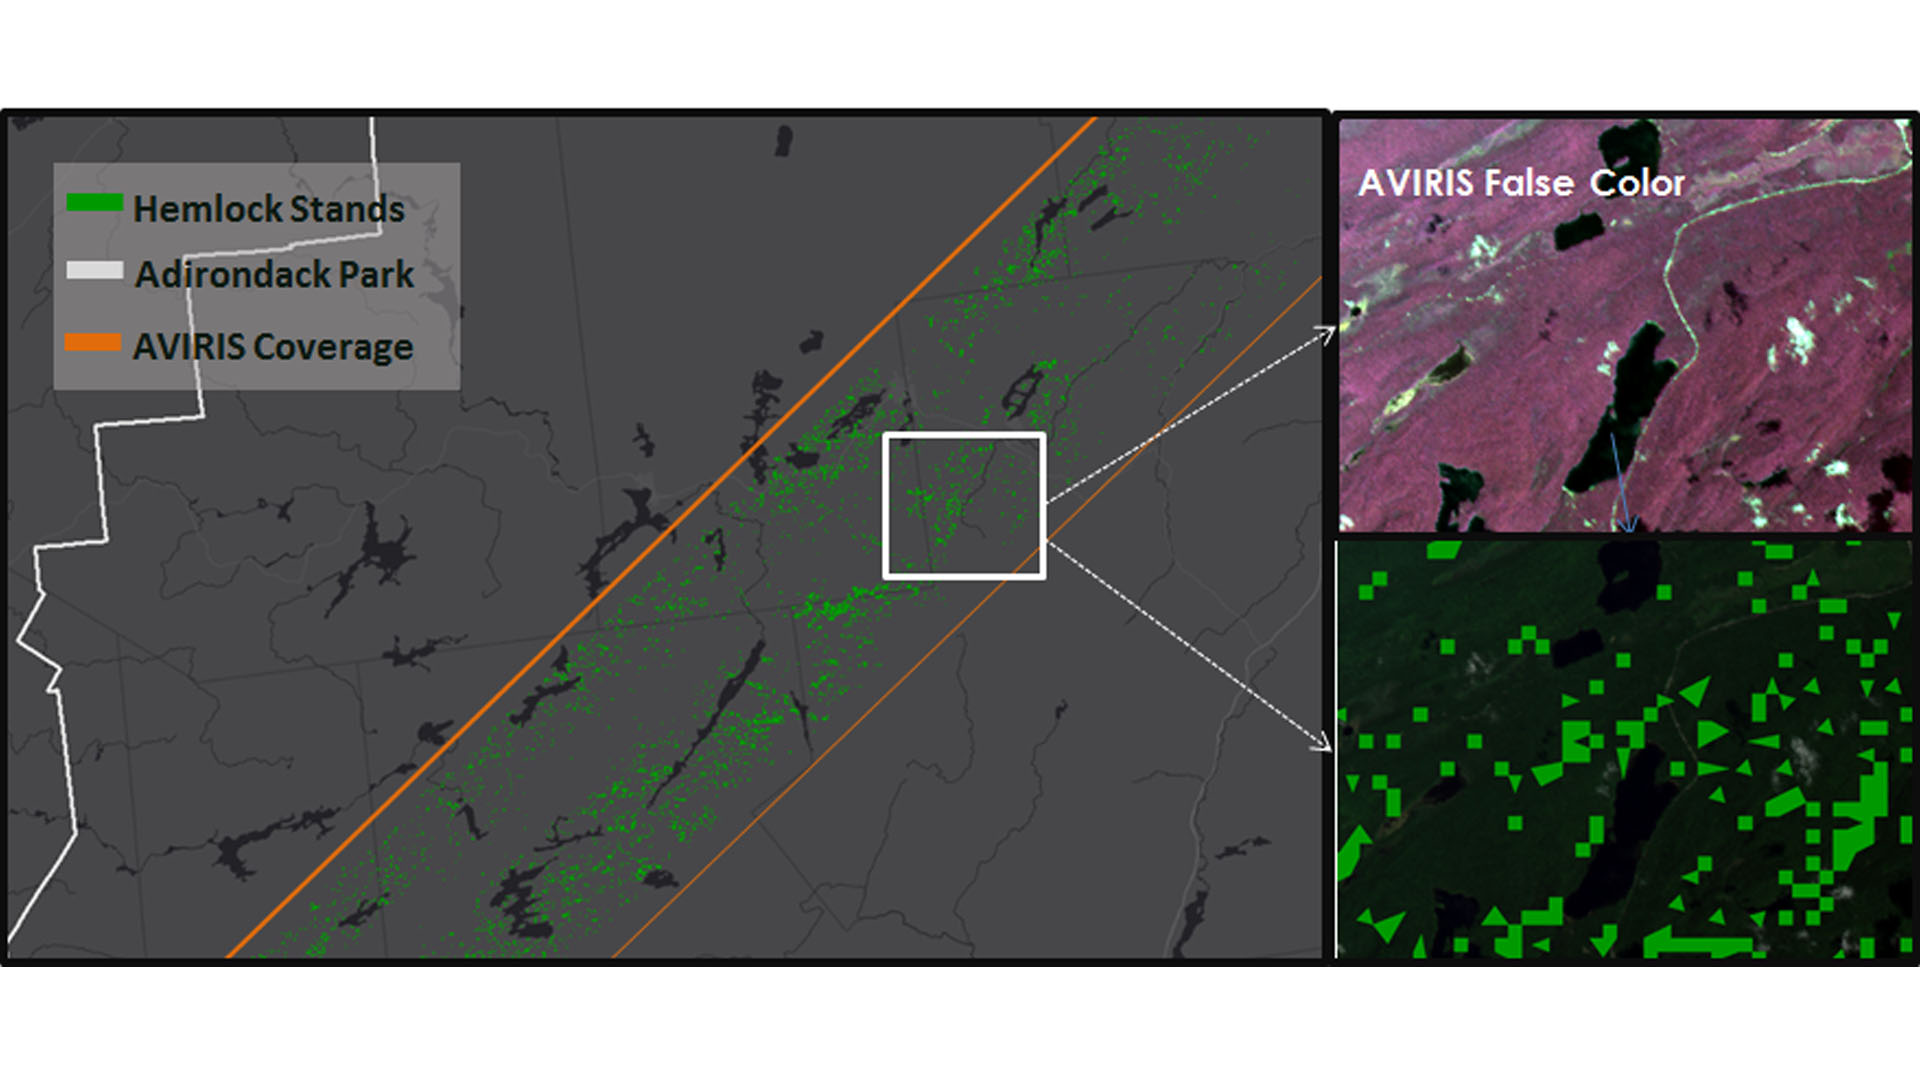
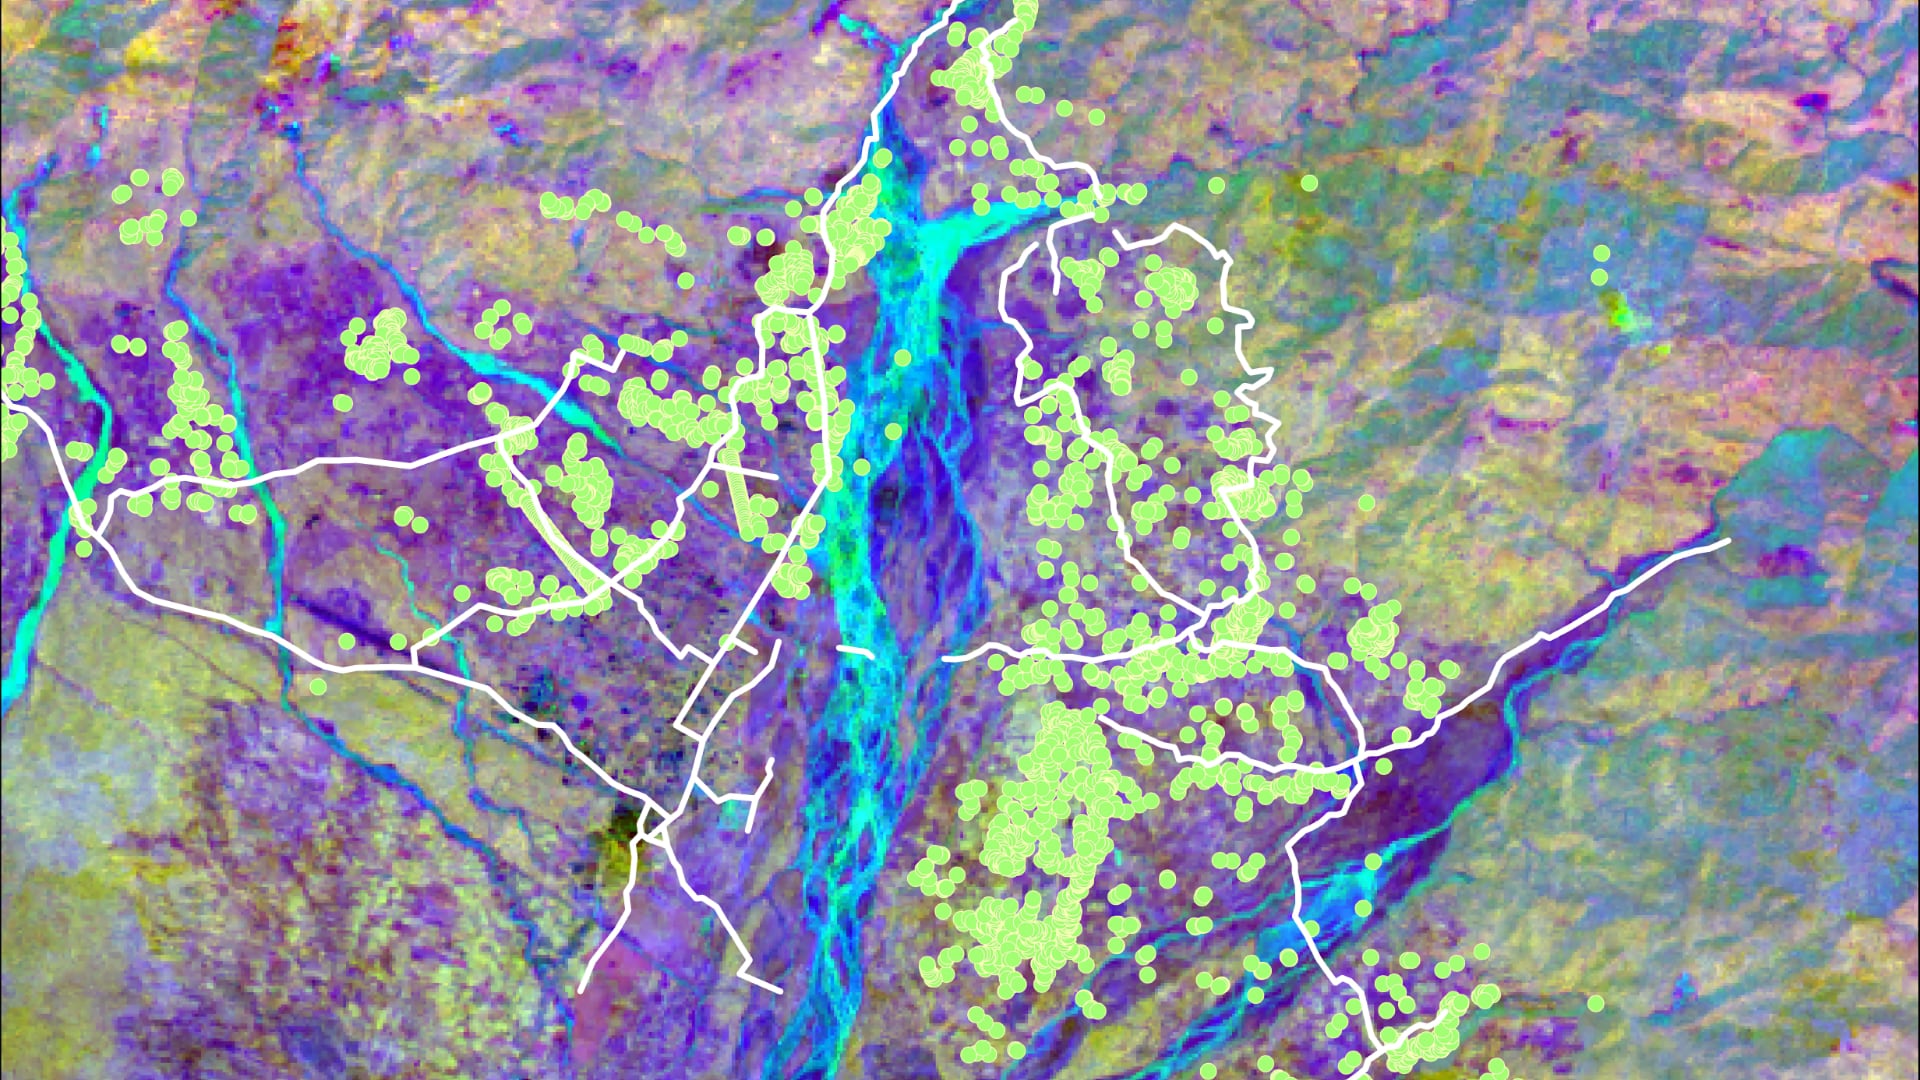
The hemlock woolly adelgid, Adelges tsugae (Annand), is an invasive species first identified on the East Coast of the United States in Richmond, Virginia in 1951. The pest has spread rapidly and has devastated eastern hemlock, Tsuga canadensis (L.) Carrière, populations from Georgia to...

Principal Investigator

Thinley Yidzin Wangden

Imagen
2020 Landsat 8 OLI data processed using principal component analysis with a band combination of 2, 3, and 9. Human settlements and roads are indicated by the green dots and white lines, respectively. The area displayed is the town of Gelephu along the southern border of Bhutan. Different colors represent different land cover types. This will provide information on land change trends which will assist partners in urban planning and allocation of wildlife corridors.  Keywords: remote sensing, Asian elephant habitat, Bhutan, LULC change mapping, LULC change forecasting, wildlife corridor mapping

Habitat loss of the endangered Asian elephants (Elephas maximus) accompanied by rapid urbanization has contributed to the rising Human-Elephant Conflict (HEC) crisis in southern Bhutan. This poses a serious threat to the survival of Asian elephants, a keystone...